Elemental Mapping of Nanoscale Boron-Containing Phases in Steel
Boron is used in the steel industries as an alloying element in certain special steels: Boron-induced precipitation hardening can lead to the desired increase in yield strength and strength in some austenitic Cr-Ni-steels. Furthermore, the strength properties of high-temperature steel grades are improved at higher temperatures with the help of boron-induced precipitation. Steels alloyed with boron are also used in nuclear technology, as boron has a high effective cross-section for neutron absorption.
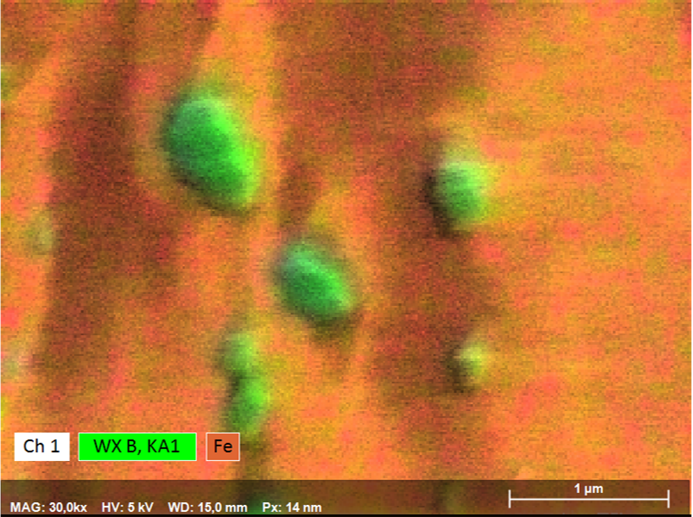
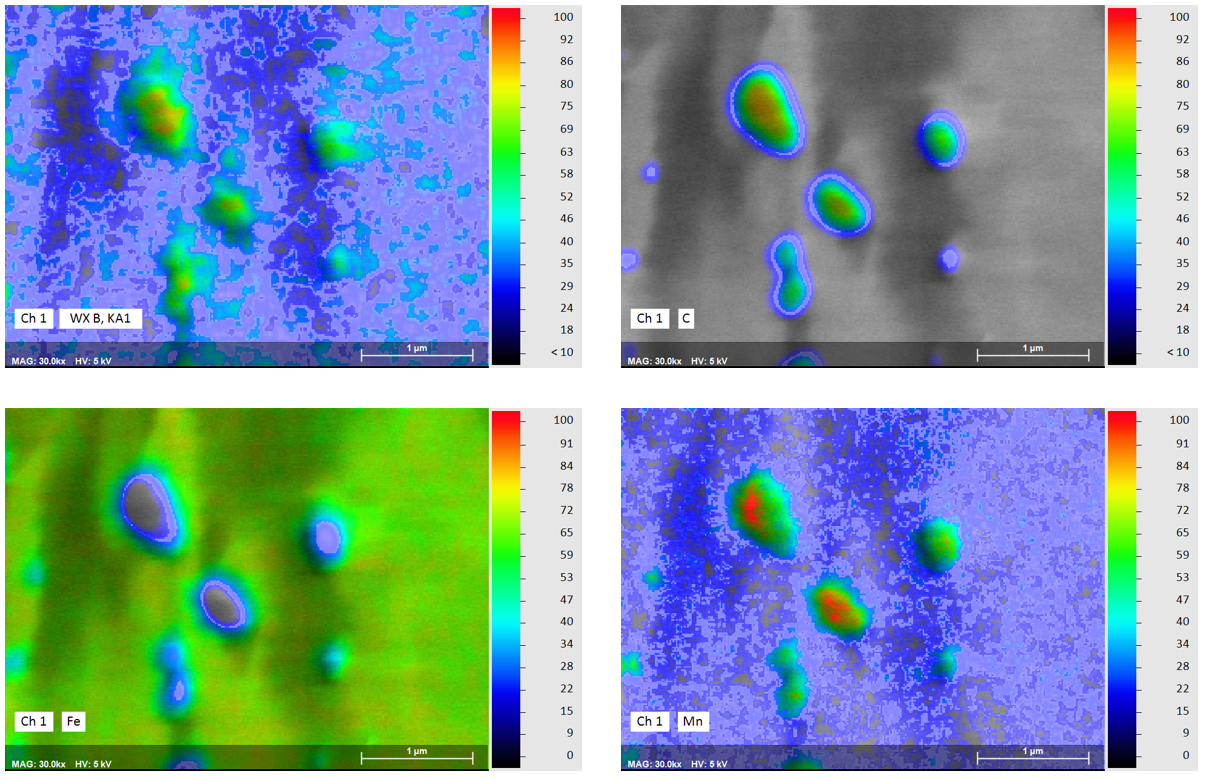
The example shown here of combined WDS/EDS mapping of a boron steel demonstrates that light element distributions can be mapped very well by QUANTAX WDS, even when concentrations are in the trace element range and phases of interest are extremely small.
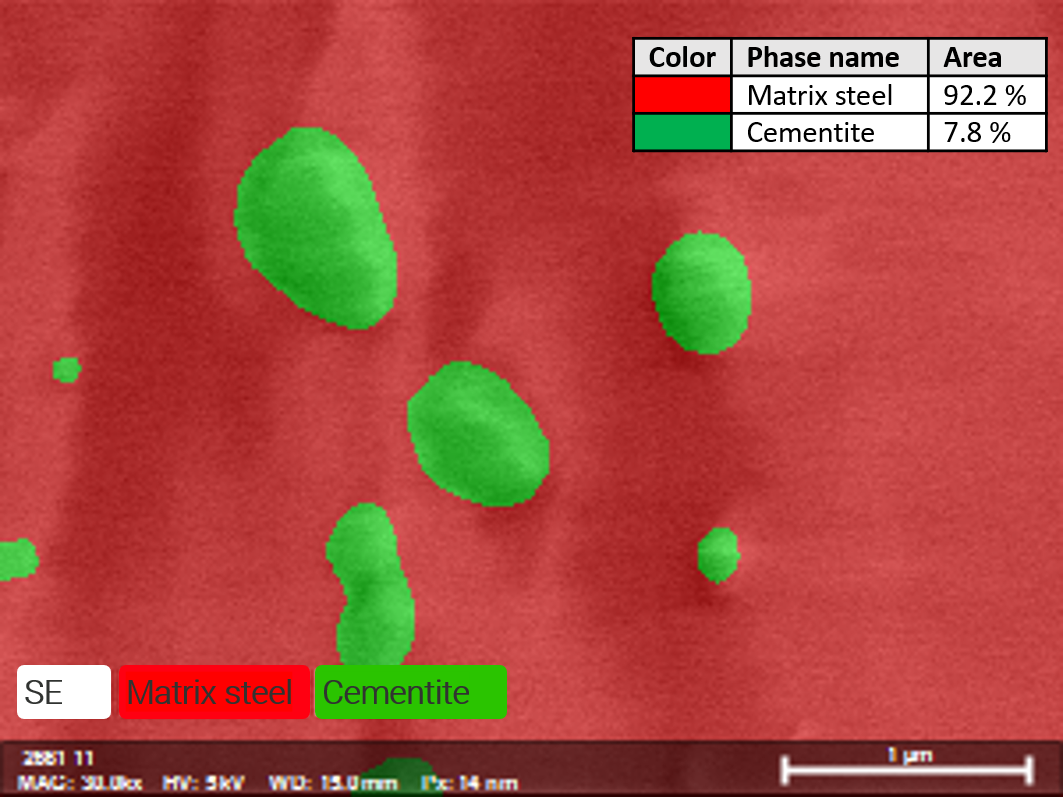
The results show that relative boron enrichments are related to sub-micron size cementite phases (Fe3C) that are characterized by relative enrichment of carbon, manganese, chromium and boron. Boron contents in cementite determined by WDS are 0.4 wt% as compared to 0.2% in the steel matrix. Mapping the trace element distribution with a pixel resolution of 14 nm was done at 5 kV, 17 nA in 120 minutes using diffractor BRML200.
Further resources:
QUANTAX WDS
QUANTAX WDS is a parallel-beam wavelength-dispersive X-ray spectrometer that is optimized for light element determination. The system is fully integrated in the ESPRIT software, allowing simultaneous acquisition and combined quantification with EDS.