Application Note: Measuring Simultaneous Neural Activity and Blood Flow Dynamics With the nVue™ System
Discover the benefits of the nVue dual color miniscope system
In this application highlight, readers can expect to learn more about the nVue system, including how it works and data examples. Read more about how to record and process calcium and blood flow recordings for insights into neurovascular coupling.
Readers can expect to learn more about:
- Measuring both neuronal activity and blood flow at cellular resolution in freely behaving animals with nVue™
- How the disruption of neurovascular coupling impacts brain diseases, including Parkinson’s disease and Alzheimer’s disease
- Advanced data acquisition and analysis tools for Inscopix miniscopes
Contents include experimental findings from the included case study on amphetamine-induced changes in the brain.

Introduction
The interaction between neuronal activity and vascular response is crucial for maintaining brain homeostasis1. Neurovascular coupling, the process of localized change in blood flow following neuronal activity2, ensures active regions of the brain are supplied with abundant levels of oxygen, glucose, and substrates in a timely manner. Optimal brain function is impaired when this intricate process is disrupted due to either neuro- or systemic-pathological conditions such as Parkinson’s disease3, stroke4, hypertension4, Alzheimer’s disease4,5, addiction6,7, aging8, and obesity9. The complex nature of how this disruption occurs, however, remains elusive. In order to gain insights into these synergistic interactions, it is necessary to precisely measure the spatial and temporal relationships between neural activity and blood flow across healthy and diseased states. This then paves the way for the translation of hemodynamic functional circuit data to awake humans.

Simultaneous neuronal activity and blood flow
during free behavior
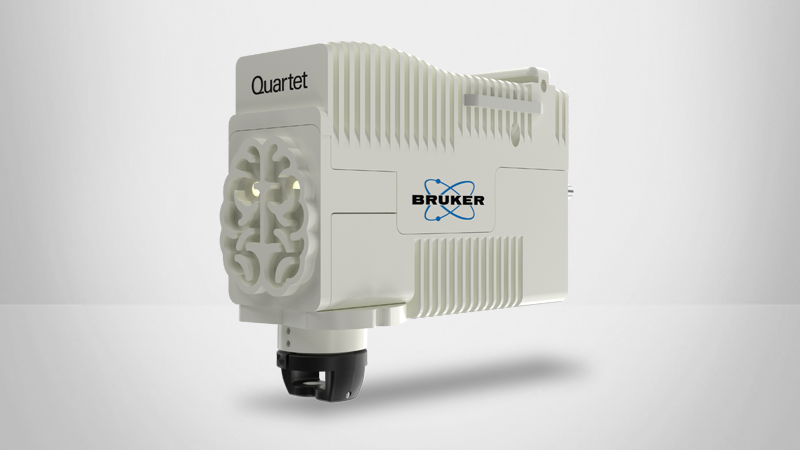
The nVue system is a lightweight miniscope that allows simultaneous imaging of dynamic green and red indicators. Cellular resolution neuronal activity can be measured using GCaMP calcium indicators and the blood flow can be imaged using plasma-labeling dyes such as Texas red or Rhodamine -dextran, during free behavior. Data acquisition in multiplexing mode with the nVue system, where imaging LEDs and frames are interleaved at a high frame rate of 100 Hz, allows for precise measurement of spatiotemporal changes in blood flow along with neuronal activity. In this application highlight, we show amphetamine-induced neurovascular changes in the mouse dorsal striatum using the nVue system.

Materials and supplies
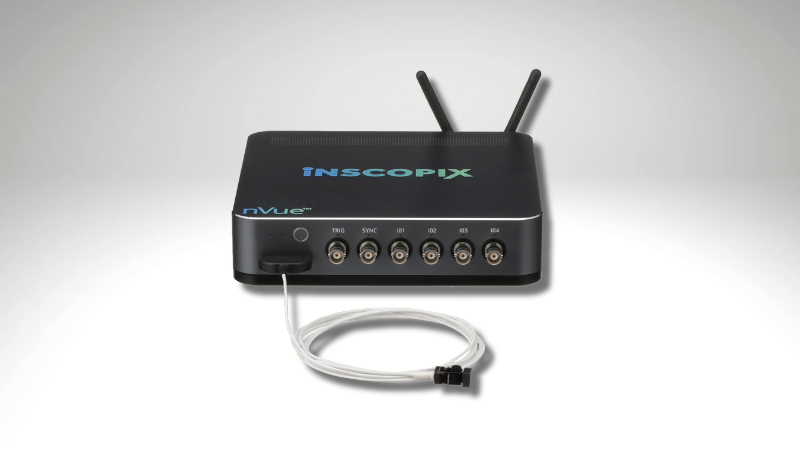
The nVue system comprises a miniature microscope, Inscopix data acquisition and analysis software. Simultaneous hemodynamics and neuronal activity imaging can readily be accomplished with nVue in multiplexing mode in animals implanted with either cranial windows or ProViewTM DC Integrated lenses or ProView Express Probes.
Data analysis and results
Simultaneous imaging of blood flow and neuronal activity
In this study, medium spiny neurons (MSNs) in the mouse dorsal striatum were labeled with GCaMP6m (via ProView Express Probes) and the blood plasma was labeled with Texas Red-dextran i.v. via tail-vein injection10. The nVue system was used to collect 5 minutes of baseline with simultaneous Ca2+ dynamics and blood flow data followed by administration of 4 mg/kg of amphetamine (i.p.).
After a wait time of 15 minutes to allow for amphetamine induced increased animal locomotion11, both neuronal and blood flow data were collected for another 5 minutes. All nVue data was paired with animal behavior. The control group received saline intraperitoneally.
Processing Ca2+ and blood flow
Multiplexed recordings at 100 Hz from the nVue system were imported into the Inscopix Data Processing Software (IDPS) where they were first deinterleaved to separate the green and red channel data at 20 and 80 Hz respectively. The green channel Ca2+ imaging data was processed to extract individual cells and their traces using the Inscopix’s constrained nonnegative matrix factorization (CNMFe) algorithm. A representative cell map and example traces of highlighted neurons in the baseline and amphetamine conditions are shown in Figure 3A. The Ca2+ activity of MSNs observed in mouse dorsal striatum in this study is consistent with previously published results of differential action of amphetamine on D1- and D2- dopamine receptor-expressing neurons12.
The red channel blood flow data was spatially bandpassed and motion corrected. The movies were then processed to compute the diameter of select vessels. Vessel map with ROIs used for vessel diameter computation and corresponding time course of change from a representative mouse is shown in Figure 3B.
For red blood cell (RBC) velocity measurement in IDPS, every 5th frame in the blood flow movie, was initially occupied by the green channel data during acquisition, and was then interpolated to generate a 100 Hz movie. The vessel diameter ROI set was used as an input for the ROIs for RBC velocity calculation. Adjustments to the auto-generated ROIs were made to accommodate any overlapping segments from neighboring vessels. ROIs overlaid on the maximum projection image of the baseline blood flow data along with velocity time course of change are shown below in Figure 3B.

Figure 3C shows the vessel diameter and RBC speed changes in the amphetamine condition normalized to baseline levels computed over 30 second time bins for all vessels from both amphetamine and saline control groups. Vessel diameter in the amphetamine group increased significantly from baseline (Paired t-test, P= 0.0002, n=21 vessels from n=3 mice) compared to the saline group (baseline vs. saline, Paired t-test, P= 0.1286, n=18 vessels, n=2 mice) (Figure 3E).
While the vehicle injections did not cause a change in the RBC speed in mouse dorsal striatum (baseline vs. saline, Paired t-test, P=0.0658, n=14 vessels, n=2 mice), amphetamine had a marked influence on the RBC speed (baseline vs. amphetamine condition, Paired t-test, P=0.0001, n=22 vessels, n=3 mice) (Figure 3F). These results are consistent with other techniques such as BOLD (blood oxygen level dependent) and gradient echo that also show an increase in signal in the striatum following amphetamine administration13.
Discussion
Understanding the intricate process of neurovascular coupling is essential for decoding how the brain operates in healthy and diseased states. The nVue system is a powerful technology that enables the simultaneous imaging of both neuronal and blood flow changes in freely behaving subjects with precision and accuracy. This opens up new ways to study functional circuit data with vascular dynamics in cortical and deep brain regions in awake animal paradigms for both basic and translational neuroscience areas.
References
- Han, K. et al. Neurovascular Coupling under Chronic Stress Is Modified by Altered GABAergic Interneuron Activity. J Neurosci 39, 10081–10095 (2019).
- Sharp, P. S. et al. Comparison of stimulus-evoked cerebral hemodynamics in the awake mouse and under a novel anesthetic regime. Sci Rep 5, 12621 (2015).
- Rosengarten, B. et al. Neurovascular coupling in Parkinson’s disease patients: effects of dementia and acetylcholinesterase inhibitor treatment. J Alzheimers Dis 22, 415–421 (2010).
- Girouard, H. & Iadecola, C. Neurovascular coupling in the normal brain and in hypertension, stroke, and Alzheimer disease. Journal of Appl Physiol 100, 328–335 (2006).
- Shaw, K. et al. Neurovascular coupling and oxygenation are decreased in hippocampus compared to neocortex because of microvascular differences. Nat Comm 12, 3190 (2021).
- Werlen, E. et al. Amphetamine disrupts haemodynamic correlates of prediction errors in nucleus accumbens and orbitofrontal cortex. Neuropsychopharmacology 45, 793–803 (2020).
- Spain, A. et al. Neurovascular and neuroimaging effects of the hallucinogenic serotonin receptor agonist psilocin in the rat brain. Neuropharmacology 99, 210–220 (2015).
- Lipecz, A. et al. Age-related impairment of neurovascular coupling responses: a dynamic vessel analysis (DVA)-based approach to measure decreased flicker light stimulus-induced retinal arteriolar dilation in healthy older adults. Geroscience 41, 341–349 (2019).
- Tarantini, S. et al. Demonstration of impaired neurovascular coupling responses in TG2576 mouse model of Alzheimer’s disease using functional laser speckle contrast imaging. GeroSci 39, 465–473 (2017).
- Zhang, S., Boyd, J., Delaney, K. & Murphy, T. H. Rapid reversible changes in dendritic spine structure in vivo gated by the degree of ischemia. J Neurosci 25, 5333–5338 (2005).
- Yates, J. W., Meij, J. T. A., Sullivan, J. R., Richtand, N. M. & Yu, L. Bimodal effect of amphetamine on motor behaviors in C57BL/6 mice. Neurosci Lett 427, 66–70 (2007).
- Yun, S. et al. Modulating D1 rather than D2 receptor-expressing spiny-projection neurons corresponds to optimal antipsychotic effect. bioRxiv 2021.08.03.454992 (2021).
- Chen, Y. C. et al. Detection of dopaminergic neurotransmitter activity using pharmacologic MRI: correlation with PET, microdialysis, and behavioral data. Magn Reson Med 38, 389–398 (2005).