Visualization and Characterization of Open and Closed Pore Networks
Characterization of Porosity and Permeability
Porosity analysis refers to the measure of “void fraction” and the characterization of the empty space. There are numerous application fields for which the analysis of pores is crucial in the understanding of the 3D structure and its mechanical properties. For example, in the field of bone research porosity is a parameter for the overall mechanical strength of the bone, while petroleum engineers are interested in the pore network connectivity to allow for transportation of liquids in oil & gas applications. Porosity analysis refers to the counting of empty space and characterization of their connections. Empty space is either fully surrounded by material on all sides, making it a closed pore, or if the empty space is not fully enclosed but at some point in 3D it can find a connection to the space outside of the object, it is defined as an open pore.
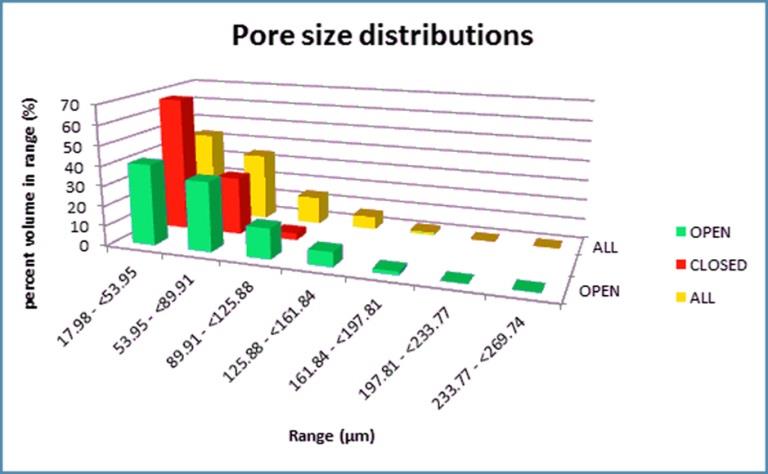
With conventional 2D imaging methods it is not trivial to assess the connectivity of the pore network. X-ray microscopy uniquely provides the full 3D picture. Quantifying both the open and closed porosity is straightforward with 3D.SUITE, the software suite that is included with all Bruker XRM solutions. The comprehensive analysis includes detailed information on all evaluated pores, such as their surface, volume and centroid location.
Visualization of Pore Networks
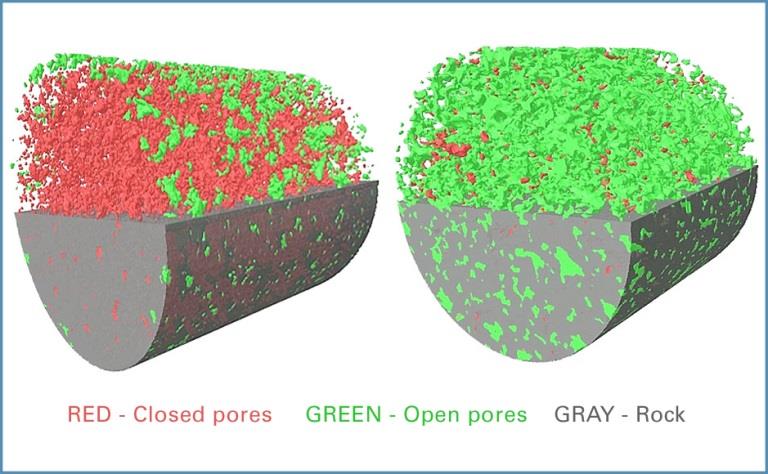
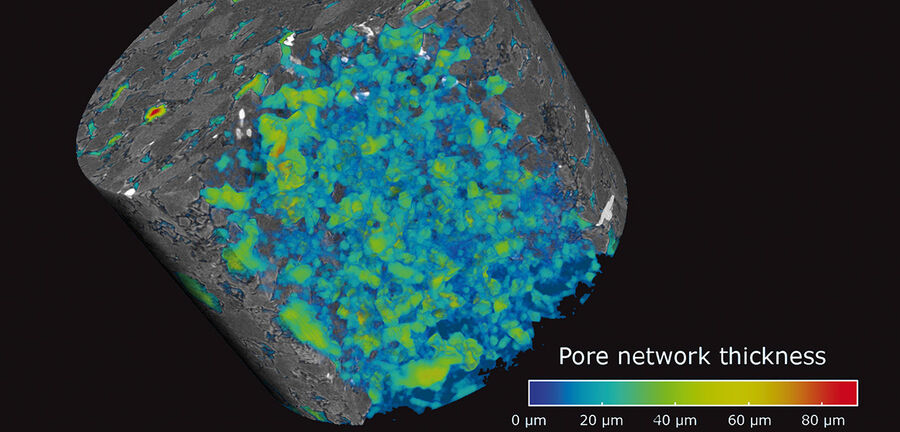
Visualization of open and closed porosity is very important when interpreting the data. 3D visualization is a lot more than “pretty pictures” and it is worthwhile to explore the techniques and tools available in the 3D.SUITE software. A visual representation of the calculated characteristic properties can help understanding the meaning of the numbers that were generated when performing porosity analysis as described in a previous section. The image below nicely illustrates how the open porosity (shown in green color) for the sample on the right is a measure of the sample itself, while the reported value for the open porosity for the rock on the left is artificial and is due to the sample drilling or the VOI selection. In fact, the rock on the left contains a closed pore structure and no gas or liquid transportation is possible.
CTVox (volume rendering) is by far the easiest and most well-known visualization tool of 3D.SUITE. CTVol (surface rendering) provides complementary visualization options and can generate color-coded images of the open and closed pore networks separately.