Torsional Resonance Modes
Exploring the Capabilities of Torsional Resonance-Based AFM Modes for High-Resolution Imaging and Property Extraction
Torsional resonance (TR) modes use horizontal probe actuation (parallel to the surface). Lateral forces between tip and sample cause a change in cantilever resonance behavior that can be used to track the surface at a constant distance, or to extract sample property information. Torsional resonance mode (TR-Mode) was initially developed for AFM topographical imaging, but its value is now much broader.
In this application note, Bruker experts describe the operation and applications of torsional resonance modes, from the original TR-Mode to the newly developed torsional resonance dynamic friction microscopy (TR-DFM).
Readers can expect to:
- Understand why TR-based modes can resolve in-plane anisotropy and measure dynamic friction.
- See how TR-DFM introduces the ability to image atomic lattice structures, even for 2D materials.
- Discover how combining the TR modulation with other modes results in unique imaging and analysis capabilities.
KEYWORDS: Atomic Force Microscopy; Torsional Resonance; Dynamic Friction; In-Plane Properties; TR-Mode; TR-TUNA; TR-DFM; TR-EFM; TR-MFM; Application Note

Introduction to Torsional Resonance Mode
A common characteristic of TappingMode, PeakForce Tapping mode, and contact mode is that the primary feedback control signals are based on flexural deflection of the cantilever probes, statically or dynamically. In TR-Mode, the torsional resonance amplitude (or phase) is used to control the feedback loop and maintainthe tip/surface relative position through lateral interaction. The nature of tip/surface interaction of the TR-Mode facilitates phase measurements to resolve the in-plane anisotropy of materials as well as measurements of dynamic friction at the nanometer scale.
The original application of TR-Mode—invented, patented, and introduced by Bruker in 2003—was to perform high-resolution topographic imaging, as an alternative to TappingMode. TR-Mode has been applied for high-resolution imaging on a variety of samples, including soft biological samples and polymers.1,2 Benefits were also found when imaging samples with high adhesion, where it is sometimes preferred to keep the tip within the tip-sample adhesion rather than increasing the amplitude in vertical resonant modes (such as TappingMode) to retract the tip sufficiently far to get out of the adhesion in every oscillation cycle.
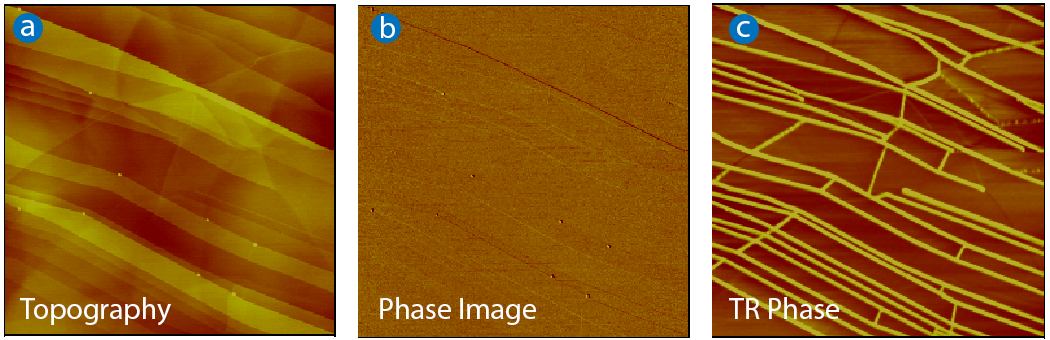
TR-Mode can also be of interest for samples that require highly sensitive phase detection. In general, the Q-factor of the torsional resonance is considerably higher than the Q-factor for the flexural mode, resulting in higher sensitivity. This is illustrated in Figure 1 on a freshly cleaved highly oriented pyrolytic graphene (HOPG) sample.3 The HOPG terrace and step structures can be resolved clearly in the tapping height image, but the tapping phase signal did not provide further information; the contrast only reflects some of the topographic features. However, the TR-Mode phase image shows very strong contrast for some step edges. The ratio of TR-Mode phase contrast to tapping phase could be as high as a factor of 20. It is believed that the initial adsorption of water on the HOPG surface concentrates on the surface defects like step edges and is observed in these phase images. This example was acquired using interleave scanning, in which each scan line is initially collected in TappingMode, immediately followed by a TR-Mode scan of the same scan line.
Implementation of TR-Mode
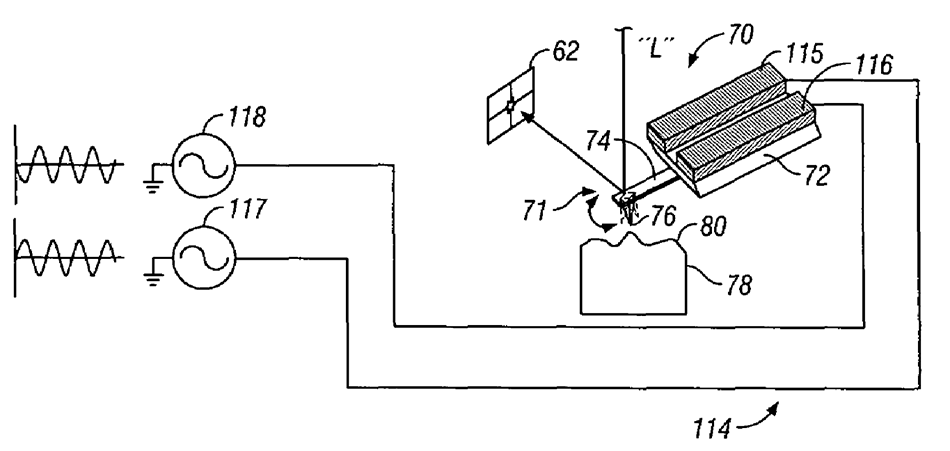
TR-Mode requires a system capable of driving the cantilever into both flexural and torsional resonances, and of easily swapping between control and measurement of these two resonance modes. A two-element piezo control system is used to produce the desired driving force (Figure 2). Each element is coordinated with the other and automatically adjusted so that the coupling between torsional and flexural resonance is minimized. The NanoScope® controller’s lock-in amplifiers measure amplitude and phase of the photodetector outputs (vertical for flexural resonances and/or lateral for torsional resonances). Among Bruker AFMs, TR-Mode is implemented on the MultiMode®, Dimension® Icon® and Dimension IconIR® series. Standard cantilevers used for TappingMode can also be used for TR-Mode, for example FESPA-V2 (nominal flexural free resonance frequency of 75 kHz, tip radius of 8 nm, length of 225 µm, and spring constant of 2.8 N/m). For some applications, it can be of interest toquantify the TR amplitudes (in nanometers), which can be done by following a few calibration steps. Mullin and Hobbs published a full quantitative comparison of two approaches to this calibration.4
Torsional Resonance Combined with other AFM Modes
A TR modulation can be applied in a wide variety of operating modes—typically with the same goal: to resolve in-plane (often anisotropic) sample properties. Table 1 presents some of the common uses of torsional resonances, showing the base operating mode, the corresponding feedback signal used for topography imaging, the properties or channels which are acquired, and whether LiftMode™ or interleave scanning is applied (often used as a method to deconvolute topography-related effects from the sample property measurement).

Torsional Resonance Dynamic Friction Microscopy
When a TR modulation is applied during contact mode operation, the TR amplitude and phase are highly sensitive to tribological properties such as friction. When operated at or near the contact (torsional) resonance frequency under constant normal load, the TR friction force images show much higher sensitivity than conventional contact mode–based friction measurements. The TR friction force images are also less affected by surface topography and are typically independent of the scanning direction of the tip, in contrast with conventional contact mode (lateral force microscopy, LFM) friction force measurements. This TR-based mode operating at a contact (torsional) resonance is called TR dynamic friction microscopy (TR-DFM).
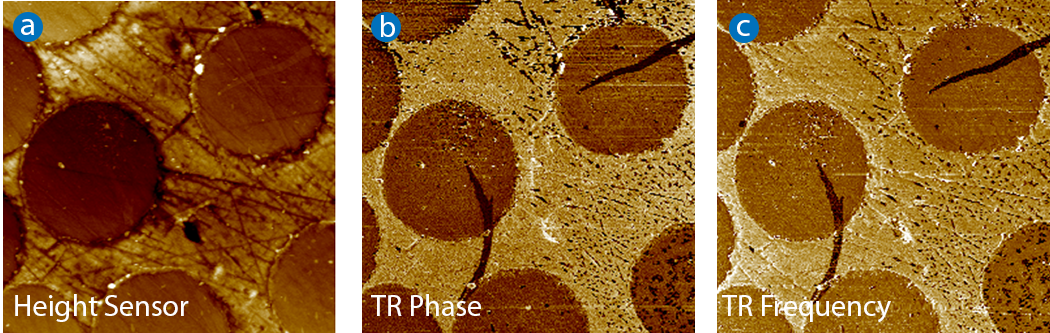
Figure 3 shows the result of TR-DFM applied to a sample with cross-sectioned carbon fibers embedded in epoxy. As seen in the TR phase image (Figure 3b), TR modulation results in a strong contrast related to mechanical properties (dynamic friction and viscoelastic properties) of the two components. A phase-locked loop (PLL) can also be applied to adjust (null) the measured phase shift, and the resulting contact (torsional) resonance frequency shifts can be extracted as an image (Figure 3c).
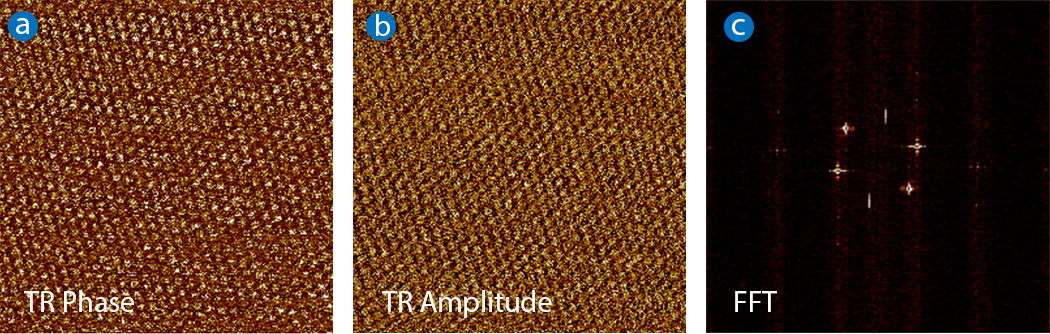
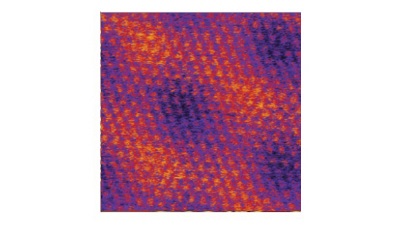
Recently, TR-DFM has been successfully explored for high-resolution imaging of atomic lattice structures, including 2D materials. In this case, it is important to minimize noise and drift of the AFM and to apply small torsional resonance amplitudes. Figure 4 shows a 10x10 nm scan of a freshly cleaved HOPG surface, resolving the atomic lattice structure in both the TR phase and TR amplitude image. Fast Fourier transform (FFT) analysis of the data illustrates the hexagonal structure of this lattice, and the minimal drift during the measurement. Similar resolution can be obtained by careful operation in other modes, but the high sensitivity of TR-DFM results in superior signal-to-noise and generally easier operation.
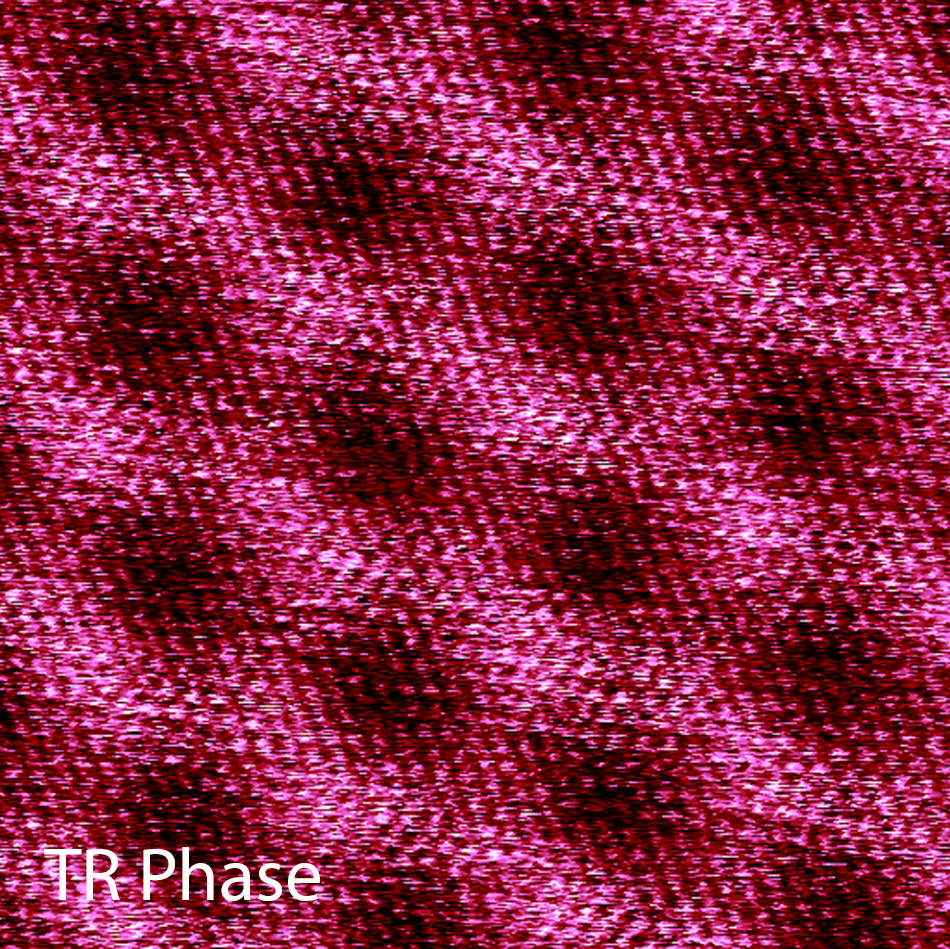
M. Pendharkar et al. applied TR-DFM (called torsional force microscopy (TFM) by the authors) to study a stack of atomically thin van der Waals (vdW) layers.5 In these layers, interlayer twist or lattice mismatch creates a moiré superlattice whose period is a function of twist angle. Changes in that twist angle of even hundredths of a degree can dramatically transform the system’s electronic properties; therefore, determining twist angle and mapping its spatial variation is very important.
In Reference 5, TR-DFM was shown to reveal surface and shallow subsurface structure of vdW stacks on multiple length scales: (i) the moirés formed between bilayers of graphene as well as between graphene and hexagonal boron nitride (hBN), and (ii) the atomic crystal lattices of graphene and hBN. Figure 5 is a high-resolution example showing the moiré pattern period as well as the underlying lattice of graphene. TR-DFM enabled the determination of precise structural information including twist angles and strain in moiré superlattices and crystallographic orientation of vdW flakes to support predictable moiré heterostructure fabrication.
Other AFM modes such as piezoresponse force microscopy (PFM), scanning microwave impedance microscopy (sMIM), tunneling AFM (TUNA), PeakForce quantitative nanomechanics (PeakForce QNM®), etc. have also been applied for moiré pattern imaging. Compared to those modes, M. Pendharkar et al. found imaging in TR-DFM straightforward and had a high success rate; they were able to find at least one moiré in 94% of the 33 regions in 32 unique samples measured. Regions that did not show a moiré had likely relaxed to Bernal stacking. Atomic lattices were observed at an even higher success rate.
TR-DFM was also applied to study nanoscale triboelectric effects (though the authors did not distinguish it by name and simply referred to their operational mode as “TR mode”).6 Triboelectric charges generated during the lateral tip motion in TR-DFM were characterized using Kelvin probe force microscopy (KPFM). The measured efficiency of generating triboelectric charges was found to be about 10 times higher than conventional static/contact mode.
Torsional Resonance Combined with Force Mapping
By acquiring a force-distance curve at each image pixel over a given area, force volume mode can be used to not only examine the morphology of a sample, but also to measure its mechanical properties, such as adhesion, deformation, and elastic modulus.7 The introduction of PeakForce Tapping mode and the related PeakForce QNM modes in 2009 provided a powerful alternative approach for the measurement of mechanical properties. These force mapping methods (force volume and PeakForce QNM) are now widely adapted to simultaneously obtain information on sample morphology and mechanical properties at the surface with extremely high lateral resolution.
Force mapping–based methods can also be combined with TR-DFM: during the time of contact between tip and sample (in each force-distance cycle), a TR oscillation can be applied, and the corresponding TR phase and amplitude can be collected in the same way as in TR-DFM.
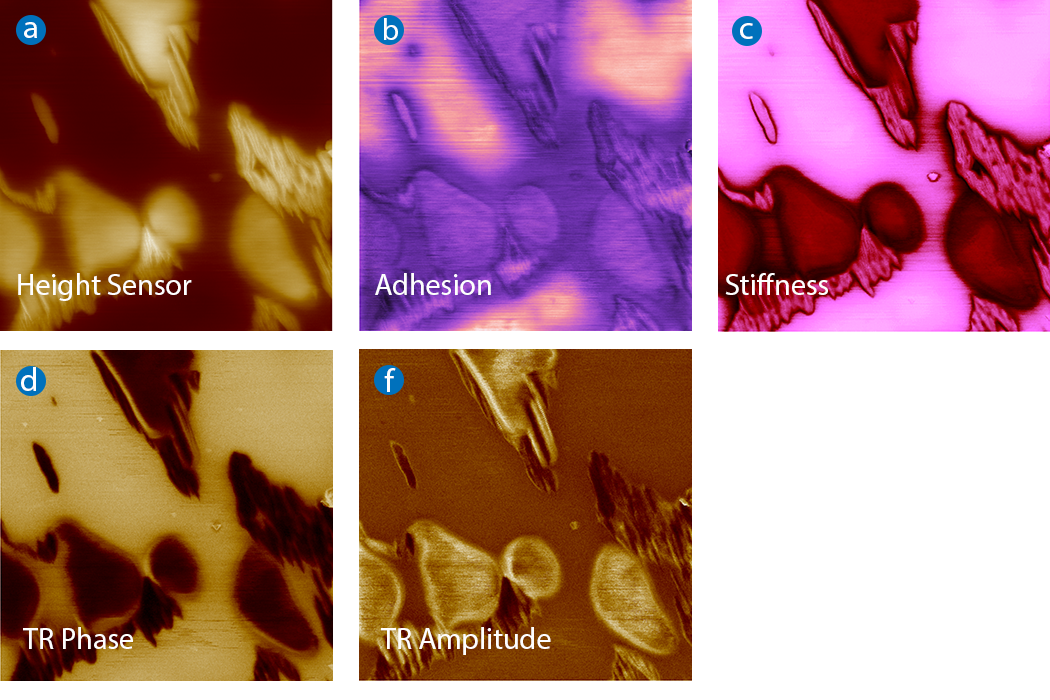
Figure 6 shows an example of combined force volume and TR-DFM on a PDES sample on Si substrate. TR phase and TR amplitude information was collected at the same location as the regular force volume image channels (height, adhesion, stiffness, modulus), providing correlated imaging of many mechanical properties. Each of the image channels shows unique information due to differing sources of contrast, illustrating the complementarity of this combined method.
PeakForce Tapping and TR-Mode can also be combined, inheriting the advantages that PeakForce QNM has over force volume imaging: (i) higher operation speeds, with peak force cycles of 2 kHz, (ii) lower operating forces, (iii) superior force control due to the built-in peak force feedback mechanism. In Reference 8, the authors propose a data processing and multidimensional mechanical information extraction algorithm based on the composite mode of PeakForce Tapping and TR-Mode. Through decoupling of transverse and longitudinal mechanical information, they achieve both quantitative measurements of longitudinal mechanical properties from PeakForce Tapping and qualitative analysis of transverse mechanical properties from TR-Mode. Based on this approach, they developed an optimized algorithm for synchronizing AFM images and proposed a method to accurately identify the contact area between tip and sample for each peak force cycle, thereby enabling collection of more accurate information about morphology and mechanical properties.
Torsional Resonance Combined with Magnetic Force and
Electric Force Microscopies
The capability to interchange between flexural and torsional resonance within scan lines can also be applied to magnetic force microscopy (MFM) and torsional resonance MFM (TR-MFM). Tapping mode–based (conventional) MFM is sensitive to the vertical component of the magnetic fields, while in TR-MFM, the tip selectively detects the field that has a force gradient parallel to the tip. Obtaining both force gradient components provides a new dimension of information, leading to a better understanding of the force and its gradient source. The in-plane force gradient components can be measured with same resolution and signal-to-noise ratio as flexural modes at the same location.9,10
Studies evaluating TR-MFM for imaging magnetic structures have shown that the mode provides two advantages over conventional MFM: (i) the ability to obtain magnetic contrast free from topographic influence and (ii) a 15% lateral resolution improvement.11 The lateral resolution enhancement is directly related to the tip-sample separation, which is kept constant at extremely small values. This is in contrast to conventional MFM, where tip-sample separation varies over larger ranges. This resolution improvement concerns any magnetic tip; thus, the combination of TR-MFM with ultra-sharp magnetic probes can lead to further optimization of the magnetic lateral resolution.
Because electric force microscopy (EFM) follows the exact same operating principles as MFM, TR-Mode can also be applied to perform TR-EFM and TR-KPFM.12
Torsional Resonance Combined with Tunneling Atomic Force Microscopy
Several nanoelectrical atomic force microscopy modes are based on contact mode, as they require tip-sample contact to measure the electrical property of interest (such as conductivity). However, conventional contact mode techniques such as conductive AFM (C-AFM) and tunneling AFM (TUNA) are not suitable for soft and fragile materials such as some organic materials or nanowires. Measurement artefacts like plowing or piling-up of material can be observed because of high lateral forces resulting from contact mode operation. The key to analyzing these materials is using intermittent-contact electrical methods like Bruker's PeakForce TUNA™ or force volume (as used in DataCube methods). These methods have become very popular with researchers due to their main advantages: (i) no lateral forces, resulting in the capability to image soft and fragile samples, obtain higher spatial resolution, and extend tip lifetime; (ii) ability to facilitate correlated mechanical and electrical property characterization.
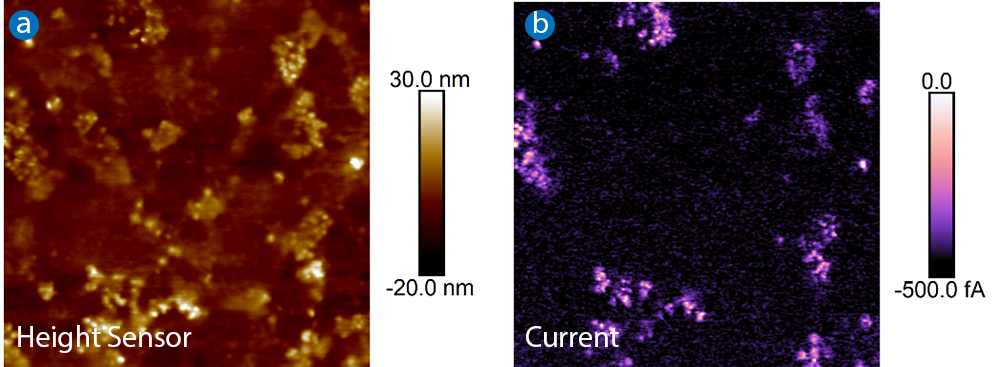
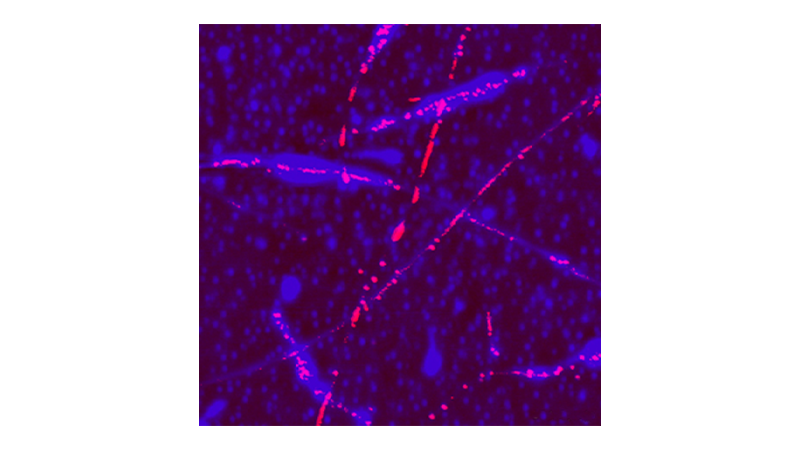
Operating TUNA with a TR modulation (TR-TUNA) offers an alternative approach to overcome the limitations related to contact mode–based electrical measurements, since using TR amplitude feedback keeps the tipsample distance constant at a very small value. This distance is sufficiently small to enable measurements of sample conductivity. TR-TUNA was invented and patented by Bruker, and has been used to map conductivity of a variety of samples with high spatial resolution: carbon tape (Figure 7), nanofibrillar-polyaniline/carbon nanotube composites13, a conducting polymer blend of poly(3,4-ethylenedioxythiophene) poly(styrenesulfonate)14, vertical nanorods and pillar array structures15, nanoparticles16, and thin dielectric and organic semiconductor films17.
Summary
TR-Mode was initially developed only for topographical imaging, but its value now is much broader. TR-based modes can resolve in-plane anisotropy and measure dynamic friction. TR-DFM introduces the ability to image atomic lattice structures, even for 2D materials. Combining the TR modulation with other modes results in unique capabilities like imaging delicate conductive samples and mapping in-plane magnetic fields.
Further Reading
The following Bruker application notes provide additional detail on some of the AFM operating modes mentioned:
- Quantitative Mechanical Property Mapping at the Nanoscale with PeakForce QNM (AN128)
- Performing Hyperspectral Mapping with AFM DataCube Nanoelectrical Modes (AN152)
- Simultaneous Electrical and Mechanical Property Mapping at the Nanoscale with PeakForce TUNA (AN132)
- PeakForce Kelvin Probe Force Microscopy (AN140)
Authors
- Bede Pittenger, Bruker (bede.pittenger@bruker.com)
- Shuiqing Hu, Bruker (shuiqing.hu@bruker.com)
- Chanmin Su, Bruker (chanmin.su@bruker.com)
- Peter De Wolf, Bruker (peter.dewolf@bruker.com)
References
- N. Mullin, C. Vasilev, J.D. Tucker, et al. 2009. “‘Torsional Tapping’ Atomic Force Microscopy Using T-Shaped Cantilevers.” Appl. Phys. Lett. 94 (17): 173109. DOI: 10.1063/1.3126047
- R.C. Savage, N. Mullin, and J.K. Hobbs. 2015. “Molecular Conformation at the Crystal–Amorphous Interface in Polyethylene.” Macromolecules 48 (17): 6160–65. DOI: 10.1021/ma5025736
- L. Huang and C. Su. 2004. “A Torsional Resonance Mode AFM for In-Plane Tip Surface Interactions.” Ultramicroscopy 100 (3–4): 277–85. DOI: 10.1016/j.ultramic.2003.11.010
- N. Mullin and J. Hobbs. 2014. “A non-contact, thermal noise based method for the calibration of lateral deflection sensitivity in atomic force microscopy”, Rev. Sci. Instrum. 85, 113703, DOI: 10.1063/1.4901221
- M. Pendharkar, S.J. Tran, G. Zaborski Jr, et al. 2024. “Torsional force microscopy of van der Waals moirés and atomic lattices.” PNAS 121(10): e2314083121. DOI: 10.1073/pnas.2314083121
- Cai, Wei, and Nan Yao. 2016. “Dynamic Nano-Triboelectrification Using Torsional Resonance Mode Atomic Force Microscopy.” Sci. Rep. 6 (1): 27874. DOI: 10.1038/srep27874
- M. Radmacher, J.P. Cleveland, M. Fritz, et al. 1994. “Mapping interaction forces with the atomic force microscope.” Biophys. J. 66: 2159–2165. DOI: 10.1016/s0006-3495(94)81011-2
- C. Hao, S. Wang, S. Yuan, et al. 2022. “Extraction Algorithm for Longitudinal and Transverse Mechanical Information of AFM.” Nanotechnol. Precis. Eng. 5 (2): 023004. DOI: 10.1063/10.0010252
- C. Su, L. Huang, P. Neilson, et al. 2003. “In-Situ Measurement of in-Plane and out-of-Plane Force Gradient with a Torsional Resonance Mode AFM.” AIP Conf. Proc. 696: 349. DOI: 10.1063/1.1639717
- T. Kasai, B. Bhushan, L. Huang, et al. 2004. “Topography and Phase Imaging Using the Torsional Resonance Mode.” Nanotechnology 15 (7): 731–42. DOI: 10.1088/0957-4484/15/7/004
- A. Kaidatzis and J.M. García-Martín. 2013. “Torsional Resonance Mode Magnetic Force Microscopy: Enabling Higher Lateral Resolution Magnetic Imaging without Topography-Related Effects.” Nanotechnology 24 (16): 165704. DOI: 10.1088/0957-4484/24/16/165704
- H. Zhang, H. Gao, J. Geng, et al. 2022. “Torsional Harmonic Kelvin Probe Force Microscopy for High-Sensitivity Mapping of Surface Potential.” IEEE Trans. Ind. Electron. 69 (2): 1654–62. DOI: 10.1109/TIE.2021.3057040
- W.K. Maser, P. Jiménez, N.O. Payne, et al. 2009. “Nanofibrilar-Polyaniline/Carbon Nanotube Composites: Aqueous Dispersions and Films.” J. Nanosci. Nanotechnol. 9 (10): 6157–63. DOI: 10.1166/jnn.2009.1578
- S.A.L. Weber and R. Berger. 2013. “Electrical Tip-Sample Contact in Scanning Conductive Torsion Mode.” Appl. Phys. Lett. 102 (16): 163105. DOI: 10.1063/1.4802725
- S.A.L Weber, N. Haberkorn, P. Theato, et al. 2010. “Mapping of Local Conductivity Variations on Fragile Nanopillar Arrays by Scanning Conductive Torsion Mode Microscopy.” Nano Lett. 10 (4): 1194–97. DOI: 10.1021/nl9035274
- C. Prastani, A. Vetushka, A. Fejfar, et al. 2012. “Conductivity Mapping of Nanoparticles by Torsional Resonance Tunneling Atomic Force Microscopy.” Appl. Phys. Lett. 101 (8): 083107. DOI: 10.1063/1.4744601
- A. Hofer, R. Biberger, G. Benstetter, et al. 2013. “Scanning Probe Microscopy Based Electrical Characterization of Thin Dielectric and Organic Semiconductor Films.” Microelectron. Reliab. 53 (9–11): 1430–33. DOI: 10.1016/j.microrel.2013.07.086
©2024 Bruker Corporation. Dimension, Icon, IconIR, LiftMode, Multimode, PeakForce QNM, PeakForce Tapping, PeakForce TUNA, TR-Mode, and TR-TUNA are trademarks of Bruker Corporation. All other trademarks are the property of their respective companies. All rights reserved. AN158, Rev. A0.