AFM/OT and Advanced Optics
Super-Resolution Microscopy (STED, STORM, PALM)
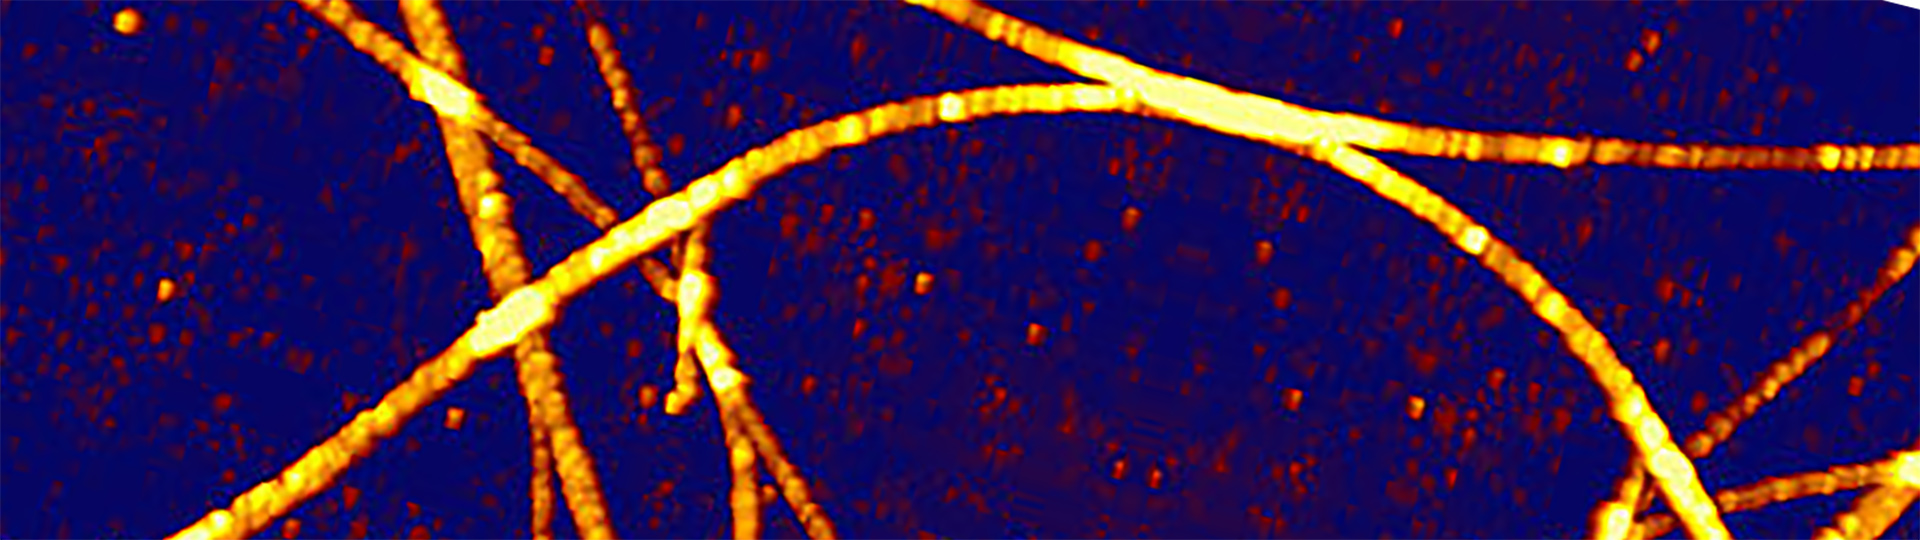
Video – Real-Time Bending of Microtubules - Correlative AFM and STED Measurements
Microtubules of living human skin fibroblasts are manipulated with the NanoWizard® Atomic Force Microscope (AFM) and imaged with Stimulated Emission Depletion (STED) microscopy. The Microtubules were labeled with SiR Tubulin and imaged with an Abberior Instruments Expert Line STED microscope (excitation, 640 nm; STED, 775 nm). The AFM manipulation path is marked with an arrow, the manipulation force was set to 5 nN with a velocity of 1 µm/s.
The bending and manoeuvering of the microtubules by the AFM tip can clearly be monitored by the STED microscope in real-time. Microtubules can be targeted and manipulated on the nanometer scale via the JPK DirectOverlay™ feature. The pressure exerted by the AFM tip can be monitored and controlled. This can provide more information about the elastic behavior of microtubules.
Sample courtesy:
Abberior Instruments GmbH
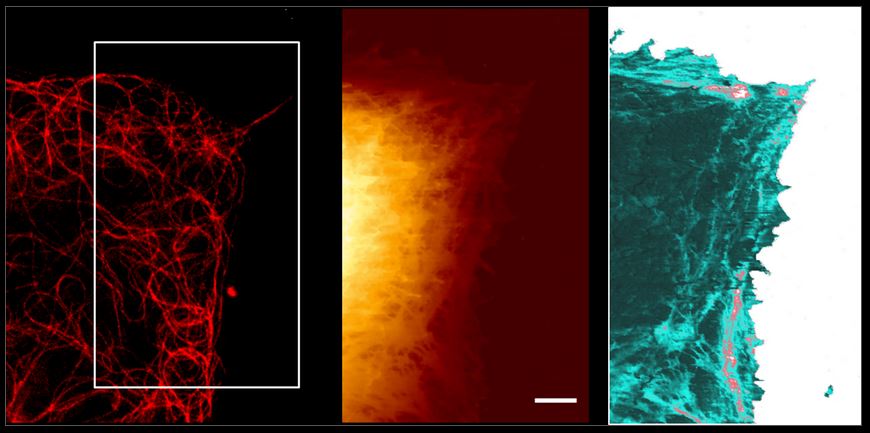
Living A549 Cells - Simultaneous AFM and STED
Living A549 cells were measured at 37°C using a NanoWizard BioScience AFM. Microtubules were labeled with silicon rhodamine (SiR-tubulin).
- Left: STED image (640 nm excitation, STED wavelength 775 nm) with marked AFM position
- Middle: AFM height image displaying the cell surface texture (scale bar: 2 µm; z: 3.5 µm)
- Right: Young´s Modulus (scale bar: 2 µm; z: 100 kPa)
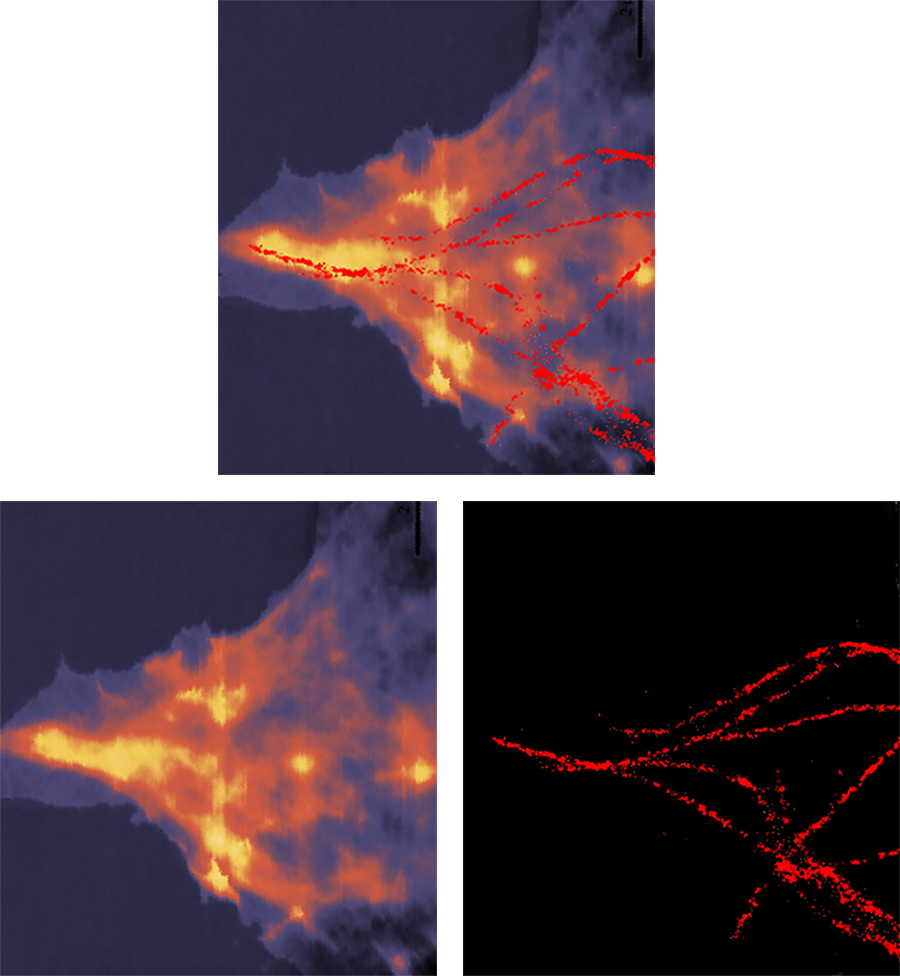
HeLa Cell in Buffer - AFM with STORM
HeLa cell measured in buffer solution and imaged with a NanoWizard BioScience AFM in QI™ mode. Microtubules were labeled with Alexa647-antibodies and measured with dSTORM.
- Top: Overlay AFM and STORM image
- Bottom left: Height image (scan size: 8 μm; z-range: 300 nm)
- Bottom right: STORM image
Sample courtesy of:
Dr. Josef Madl, Prof. Winfried Römer
BIOSS
Freiburg, Germany
Confocal Microscopy (FCS, FLIM, TIRF, IRM)
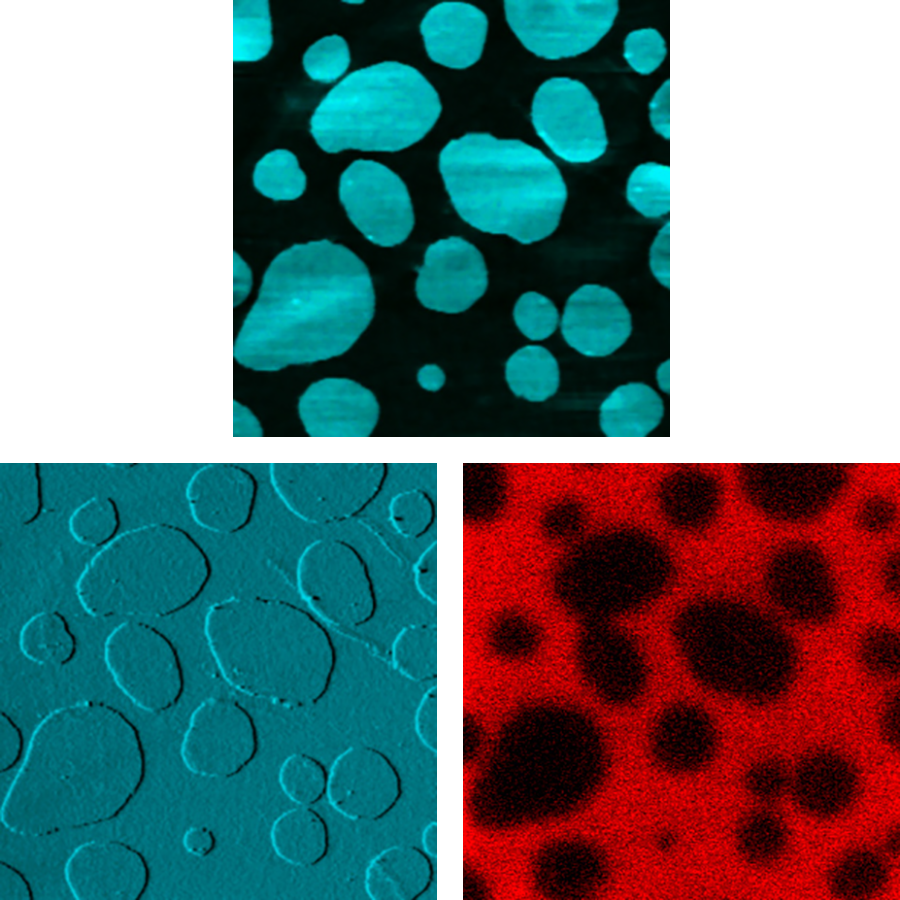
Lipid Bilayer - AFM with Confocal Microscopy
AFM and confocal fluorescence images of a phase-separated lipid bilayer sample. The background liquid disordered phase is around 1 nm lower than the liquid ordered islands. DirectOverlay™ was used with the NanoWizard BioScience AFM. Scan field: 15 µm x 15 µm; Z-range 2 nm.
- Top: Height image
- Bottom left: Deflection image
- Bottom right: Confocal fluorescence image
Sample courtesy of:
Dr. S. Chiantia, group of Prof. Schwille
TU Dresden
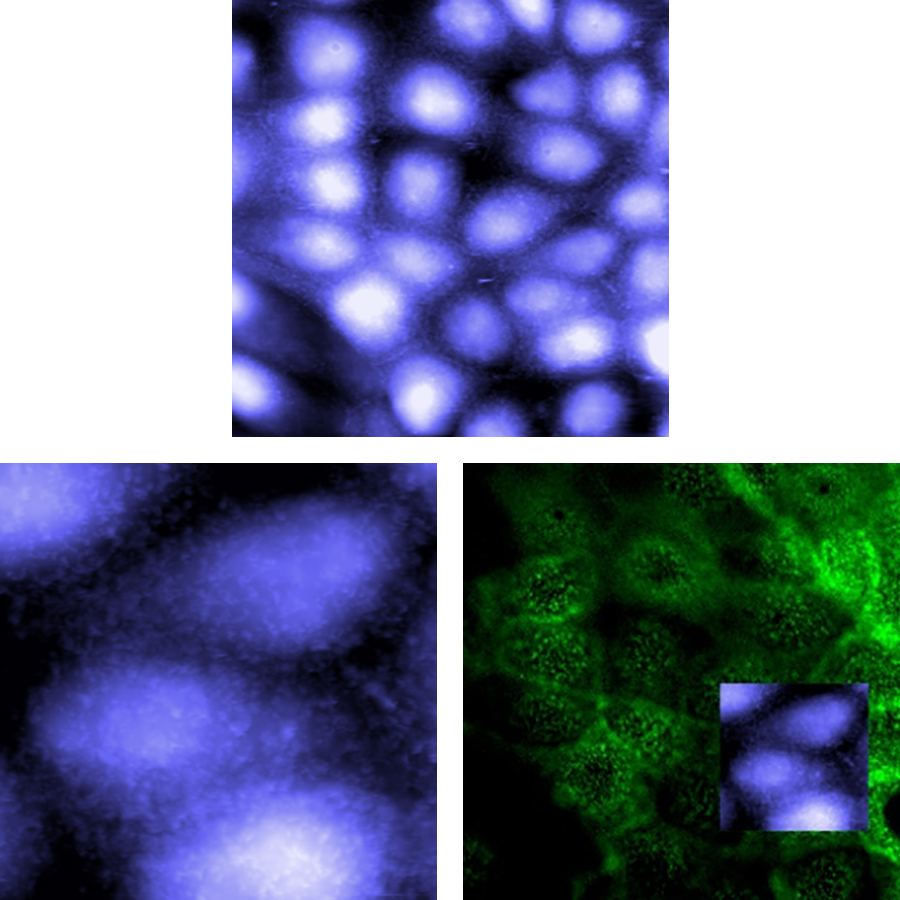
MDCK Cells – AFM with Confocal Microscopy
AFM and confocal fluorescence images of a confluent monolayer of MDCK cells with labeled actin. The rough texture on the surface comes from the characteristic microvilli covering the apical surface. Imaged with a NanoWizard BioScience AFM with DirectOverlay™.
- Top: Height image (scan field: 100 µm x 100 µm; z-range: 5 µm)
- Bottom left: Height image zoomed (scan field: 30 µm x 30 µm; z-range: 5 µm)
- Bottom right: Confocal fluorescence image (fluorescence - scan field: 100 µm x 100 µm) (AFM - scan field: 30 µm x 30 µm)
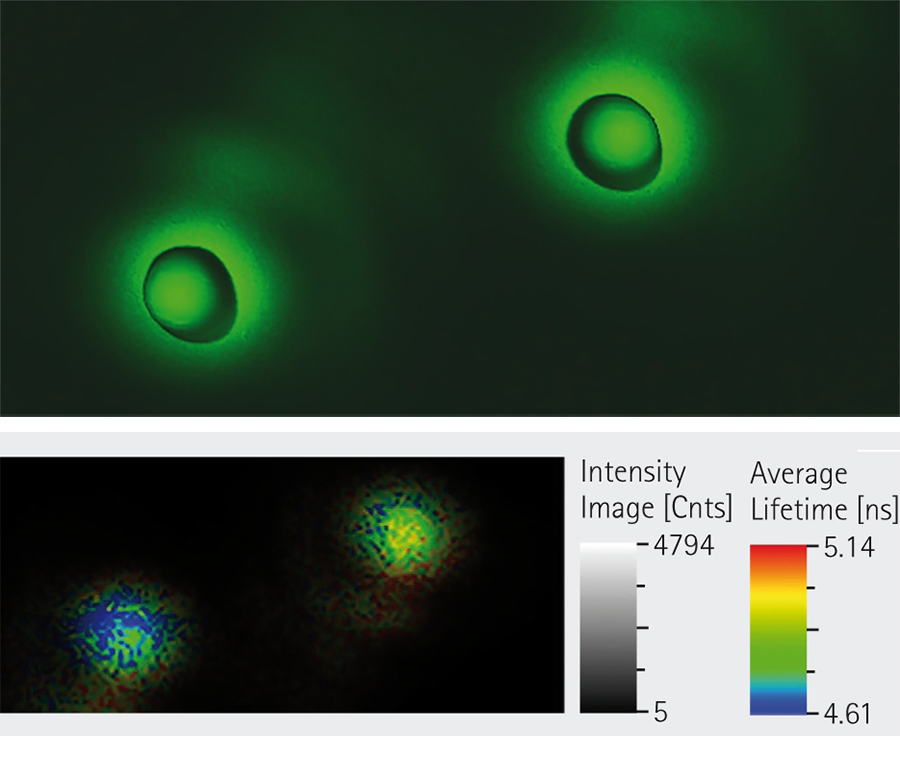
Simultaneous AFM and FLIM Measurements
Simultaneous AFM and FLIM measurements on nanoparticles. Scan size 800 nm². Imaged with a NanoWizard NanoScience AFM.
- Top: 3D height information with fluorescence signal overlaid in green
- Bottom: Lifetime signal
SAOS Cells – AFM with Confocal Microscopy
AFM and confocal fluorescence images of two SAOS cells in buffer. Actin fibres were labeled with FITC-phalloidi. A NanoWizard Sense+ AFM with DirectOverlay™ was used. Scan field: 75 µm * 100 µm; z-range: 10 µm.
- Top: Height image
- Bottom left: Deflection image
- Bottom right: Confocal fluorescence image
VIDEO – Confocal Scanning Combined with Optical Particle Manipulation
This movie demonstrates the seamless integration of confocal scanning with optical particle manipulation as well as the multiple degrees of freedom offered by the NanoTracker™ system in positioning a sample relative to a trapped object.
A fluorescent bead is optically trapped and moved in 3D through a sample of fluorescently labeled cells. Movements of the cell sample in x, y, and z are performed using a three-axis piezo scanner (when the cells move relative to the field of view or the focus changes). For movements of the bead relative to the camera image, the NanoTracker's 3D trap steering system is used (when the bead moves in x and y or in and out of focus). The movie nicely shows that the sample can be positioned in 3D relative to a trapped bead and also the bead can be freely moved through the stationary sample.
Fluorescence Microscopy
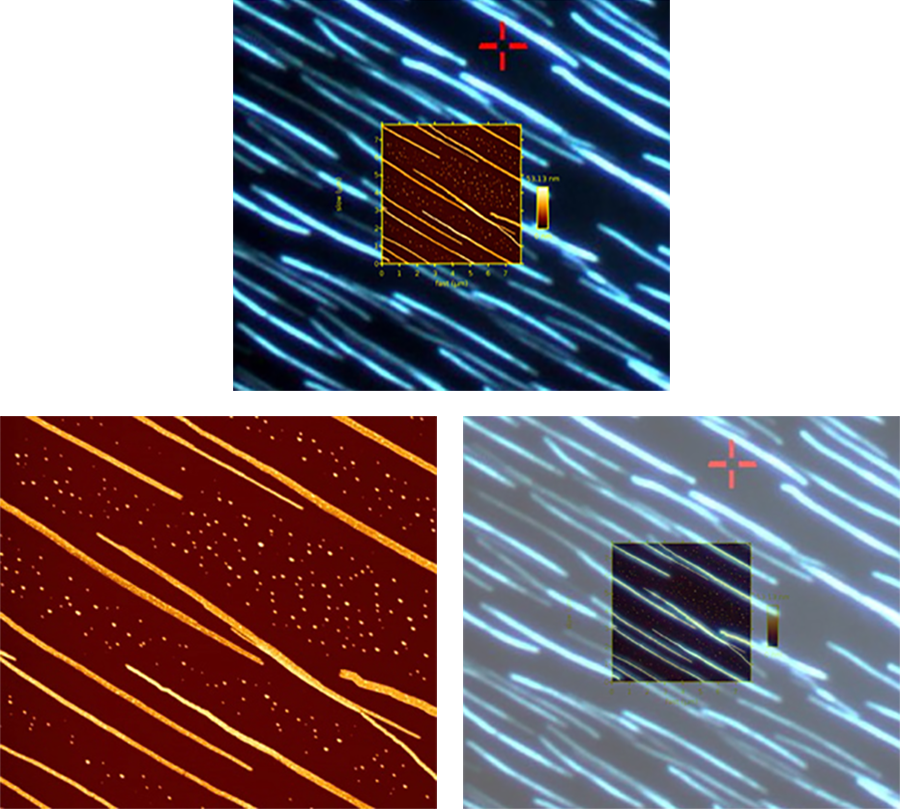
Hexaphenyl Nanofibers – AFM with Fluorescence Microscopy
AFM and fluorescence images of p-Hexaphenyl polymer nanofibers formed on mica. For perfect integration, the DirectOverlay™ feature of the NanoWizard NanoScience AFM was used. Scan field: 8 µm x 8 µm; z-range: 60 nm.
- Top: AFM image on top of fluorescence image
- Bottom left: Height image
- Bottom right: AFM and transparent fluorescence image
Courtesy of:
Dr. F. Balzer
Humboldt University
Berlin
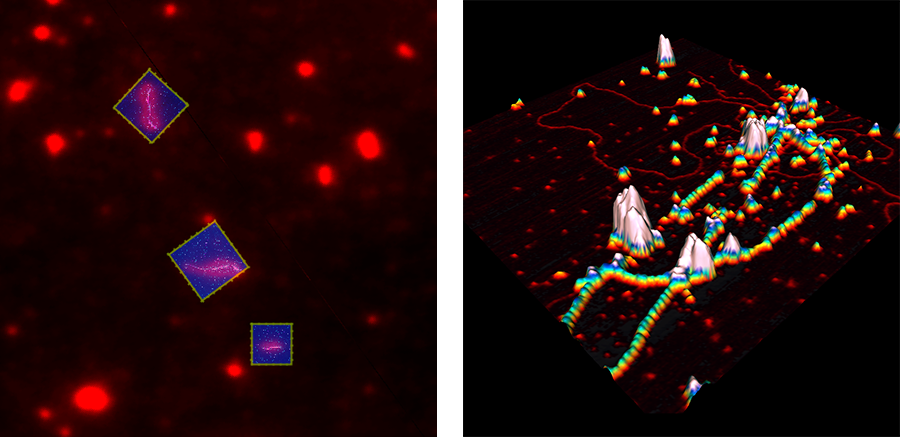
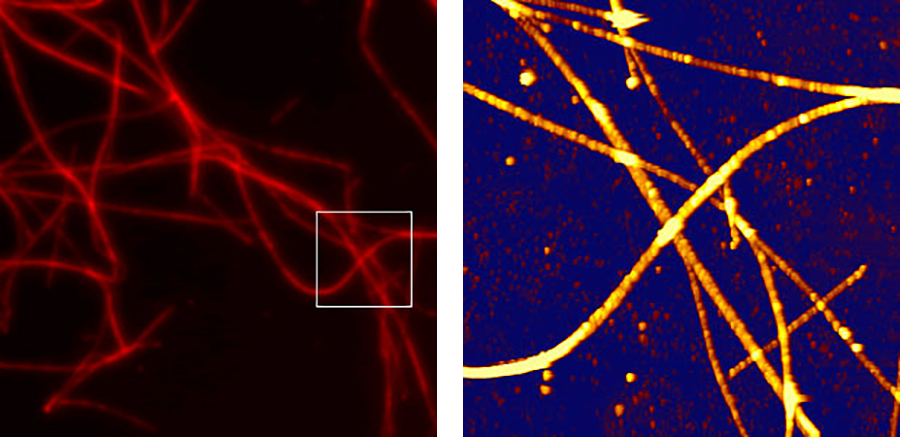
Rad51 Proteins Bound to DNA – AFM with Fluorescence Microscopy
AFM and fluorescence image of Alexa555-labeled Rad51 proteins bound to DNA. Imaged with a NanoWizard BioScience AFM.
Rad51 assembles into filaments along double-stranded DNA, which can be seen in the 3D plot of the 700nm topography image. In the fluorescence overview image, the Rad51 filaments are red fluorescent, with the AFM scan regions superimposed. Each blue AFM scan encloses a single DNA molecule, partially coated with Rad51. To precisely and easily combine AFM and optical microscopy, DirectOverlay™ was used.
- Left: Fluorescence overview image
- Right: 3D topography image
Courtesy of:
Modesti group
CBRS Marseille
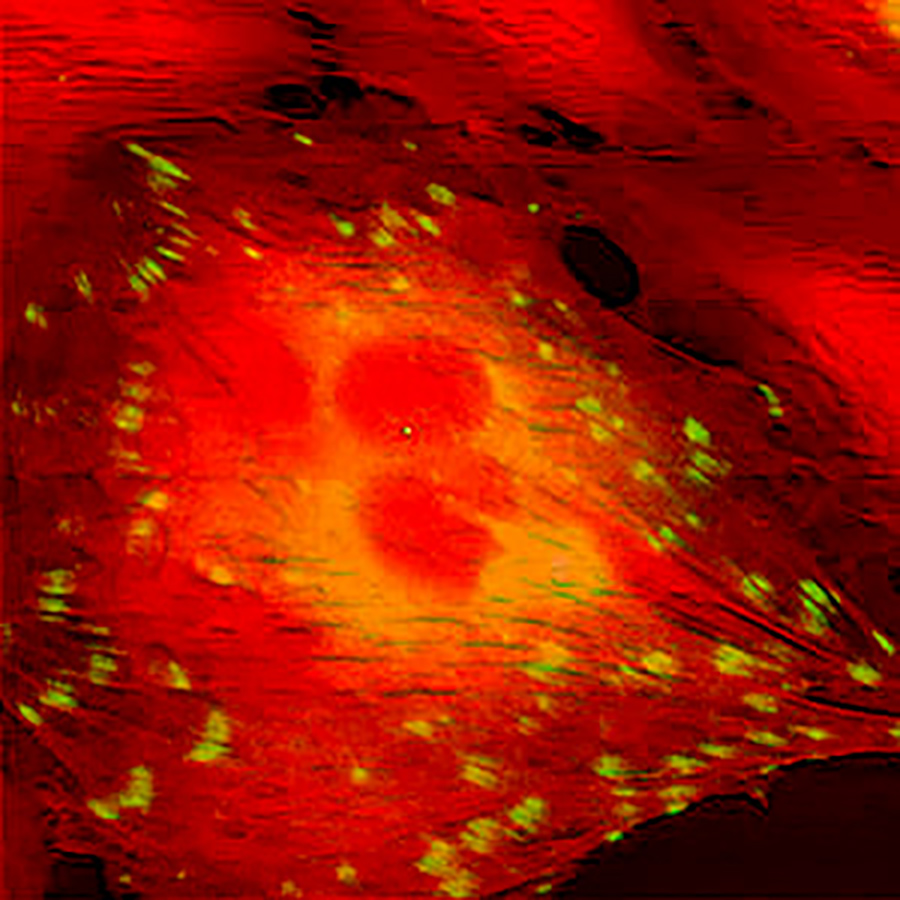
REF52 Cells – AFM with Fluorescence
An overlay of a 3D contact mode AFM image (in red) with the corresponding, calibrated optical image (yellow-green fluorescence) using the DirectOverlay™ feature of a NanoWizard BioScience AFM. Living REF52 fibroblasts expressing YFP-paxillin. Fluorescent imaging with 63x oil immersion lens. Scan field: 100 µm x 100 µm; z-range: 3 µm.
Microtubules – AFM with Fluorescence
AFM height and fluorescence image of microtubules, imaged in buffer with the NanoWizard Sense+ AFM. For perfect optical integration, DirectOverlay™ was used.
- Left: Fluorescence image (dimensions: 22.5 µm x 22.5 µm)
- Right: Height image (scan size: 5 µm x 5 µm; Z-range: 43 nm)
Video – Fluorescent Microtubule Manipulation
This video playfully demonstrates the versatile manipulation of single microtubules using the NanoTracker™ optical tweezers instrument in conjunction with simultaneous sensitive fluorescence microscopy. The microtubules are fluorescently tagged using a chemical dye. Two optical traps are used to hold and manipulate the microtubule from both ends. Such constructs are key in biochemical / biophysics assays that probe the mechanics of microtubules, or of so-called motor proteins that bind to microtubules and walk along them by converting chemical energy into mechanical energy.
Many such experiments have revealed the intricate function of such motor proteins, allowing researchers to both understand such motor proteins as they operate in their cellular environment, and how chemical drugs can affect their functionality, opening the path towards more biomedical applications.
Phase Contrast and DIC

Living Vero Cells
Living Vero cells in cell culture medium at 37°C in PetriDishHeater™ with a NanoWizard BioScience AFM. Optical tiling with 5 × 6 phase contrast images covering a 630 µm × 450 µm region.
2-5: Zoom into region scanned with AFM showing 100 μm×100 μm scan (height range 5 μm) and inset 15μm×15μm (height range 2 μm) scan topography images using PeakForce Tapping. The feedback correction signal images highlight the surface membrane features, particularly in the zoomed image. Microvilli dominate the center of the cell, with membrane ruffles at the cell boundary.
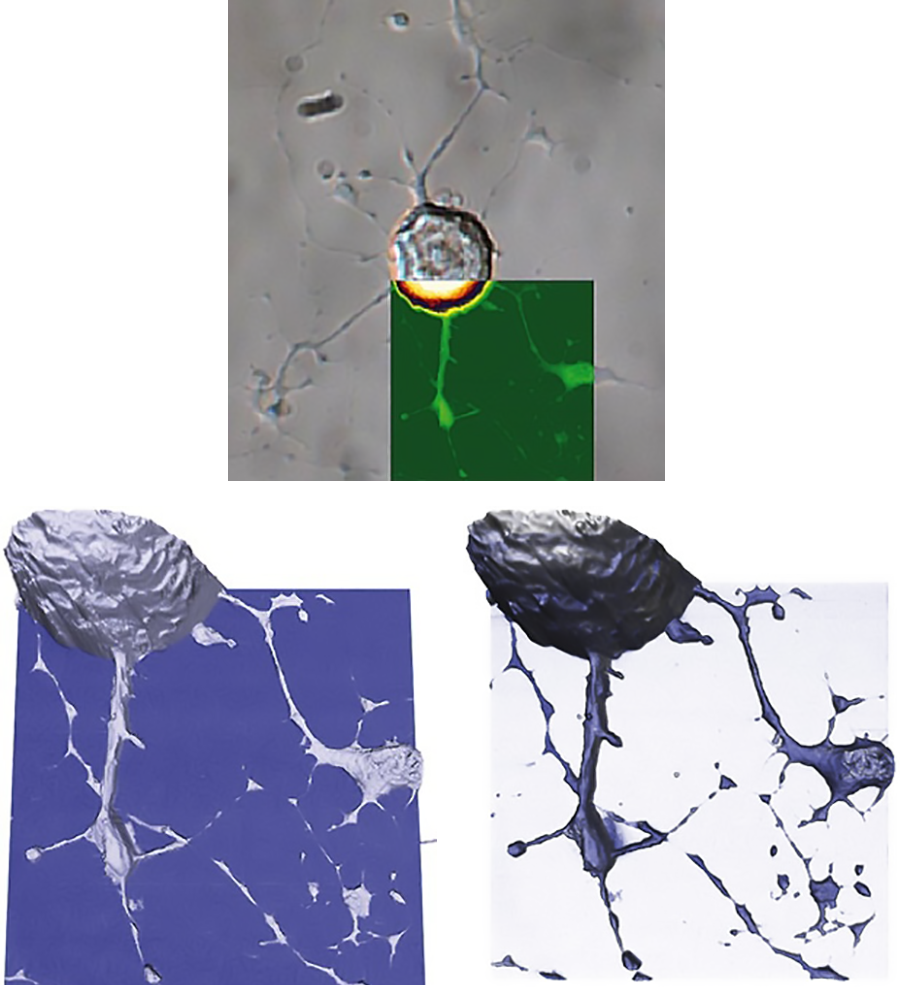
Living Dorsal Root Ganglion Cells - AFM with DIC
AFM topography, adhesion, elasticity, and DIC images of living dorsal root ganglion cells, imaged with a NanoWIzard BioScience AFM in QI™ mode. For perfect optical integration, DirectOverlay™ was used.
- Top: DIC image with overlaid AFM height image (scan size: 40 × 40 µm; z-range: 10 µm)
- Bottom left: 3D topography image overlaid with elasticity image (scan size: 40 × 40 µm; z-range: 10 µm; elasticity range: 100 kPa)
- Bottom right: 3D topography image overlaid with adhesion image (scan size: 40 × 40 µm; z-range: 10 µm; adhesion range: 600 pN)
Upright Microscopy
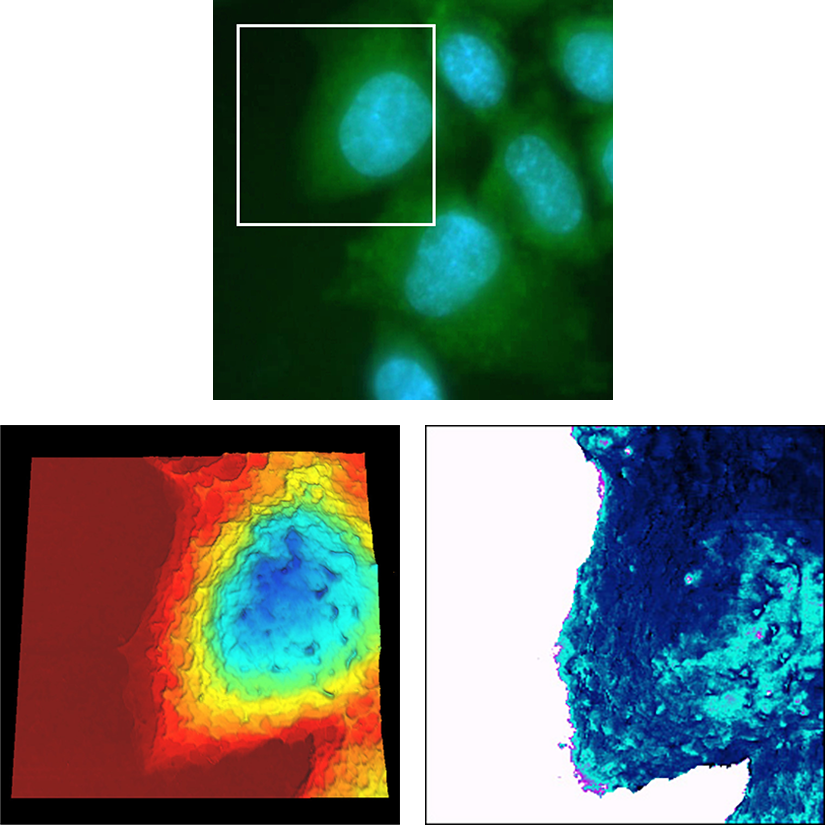
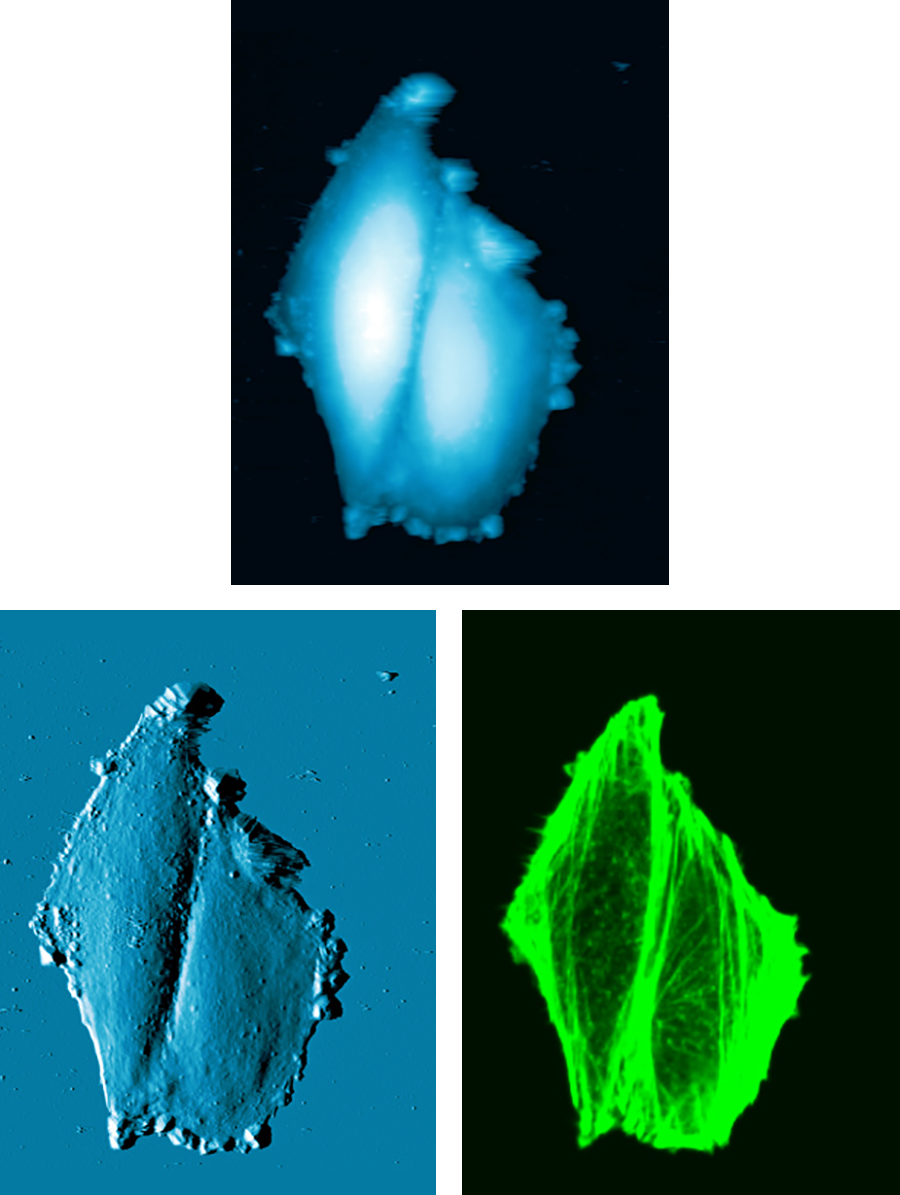
Living CHO on Gold Electrode
Living CHO on gold electrode measured in PetriDishHeater™ for BioMAT™ at 37 °C. Cells were fluorescently labeled with Hoechst (blue nuclei) and fluorescein diacetate (green cytoplasm) and imaged with 40x dipping objective and AFM QI™ mode.
- Top: Fluorescence image
- Bottom left: 3D height image of the marked region (scan size: 30 µm x 30 µm; z-range: 6 µm)
- Bottom right: Young´s modulus image (scan size: 30 µm x 30 µm; range: 10 kPa)
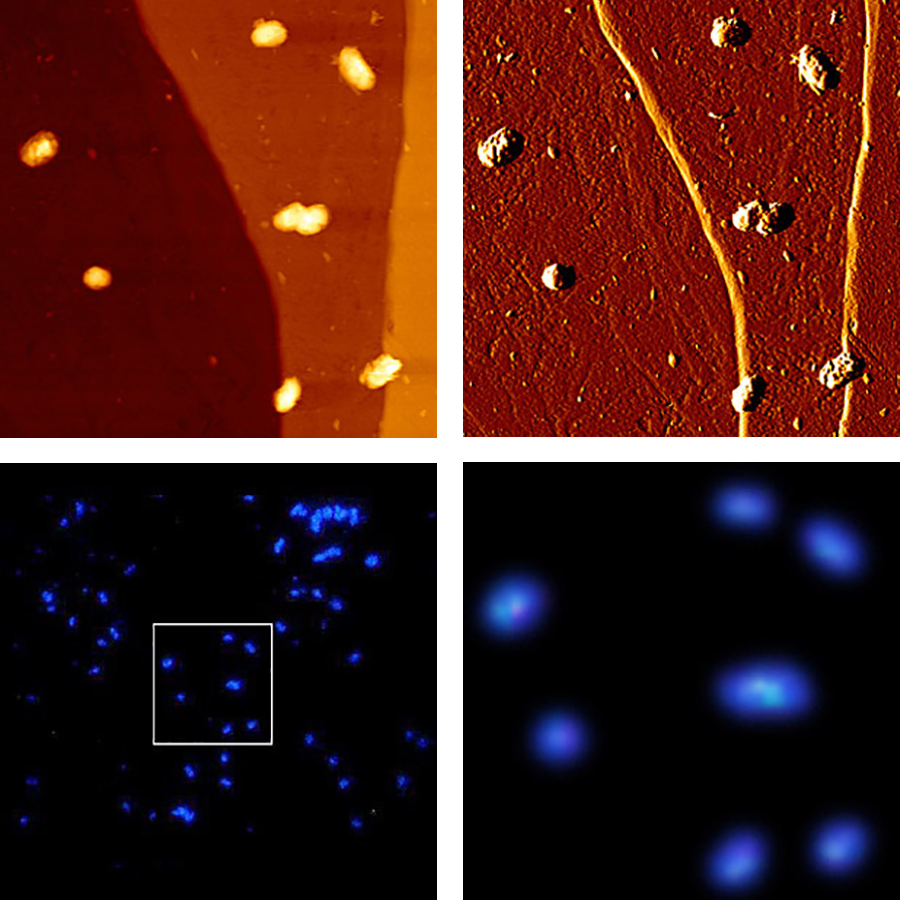
Bacteria on Pyrite Surface - AFM with Upright Fluorescence Microscopy
Images of isolated acidithiobacillus bacteria grown on the surface of pyrite (an iron sulphide mineral). The mineral substrate is opaque, so optical images were taken using an upright microscope with the BioMAT™ stage to allow fluorescence imaging in the same location as the AFM images. Scan region: 13 µm * 13 µm; Z-range: 410 nm.
- Top left: Height image
- Top right: Deflection image
- Bottom left: DAPI fluorescence image
- Bottom right: Fluorescence image zoomed
Images courtesy of:
S. Mangold, group of W. Sand
University of Duisburg

Mouse Cerebellum Tissue - AFM with Upright Fluorescence Microscopy
Force mapping height and Young´s modulus image of fixed mouse cerebellum tissue. The BioMAT™ Workstation was used to overlay a 63× upright fluorescent microscopy image of DAPI stained nucleus and AFM force mapping height. Newly developed automatic height compensation was used to overcome the typical large height differences of the tissue sample.
- Top: Fluorescent microscopy image
- Bottom left: Height image (scan size: 50 µm x 50 µm; z-range: 30 µm)
- Bottom right: Young´s modulus image (scan size: 50 µm x 50 µm; range: 5 kPa)
Sample courtesy of:
AG Prof. Jochen Guck
Dr. Elke Ulbricht
TU Dresden, Germany