Microstructural Analysis of Copper Charge Collectors in Lithium-Ion Batteries
Copper foil is widely utilized as a current collector for lithium-ion battery electrodes. It provides a stable substrate onto which the active material is coated, ensuring structural integrity during charge/discharge cycles. To reduce material cost, thinner copper foils are being developed but require advanced manufacturing to maintain uniformity and strength. The foil’s electrical conductivity and mechanical resilience is directly influenced by the microstructure and crystallographic texture. Hence foils are carefully engineered during electrodeposition or rolling/annealing to get the desired performance. Electron Backscatter Diffraction (EBSD) is a proven analytical solution for high resolution microstructural analysis delivering quantitative insights into grain metrics, crystallographic texture and boundary characteristics.
Depending on the manufacturing process (electrolytic or rolled), <111> or <110> textures are expected to form perpendicular to the surface.1 <111> texture is often preferred because it enhances electrochemical stability, while <110> orientations tend to reduce the foil ductility and facilitate failure during cycling. The distribution of twin boundaries also affects the foil strength and durability.2
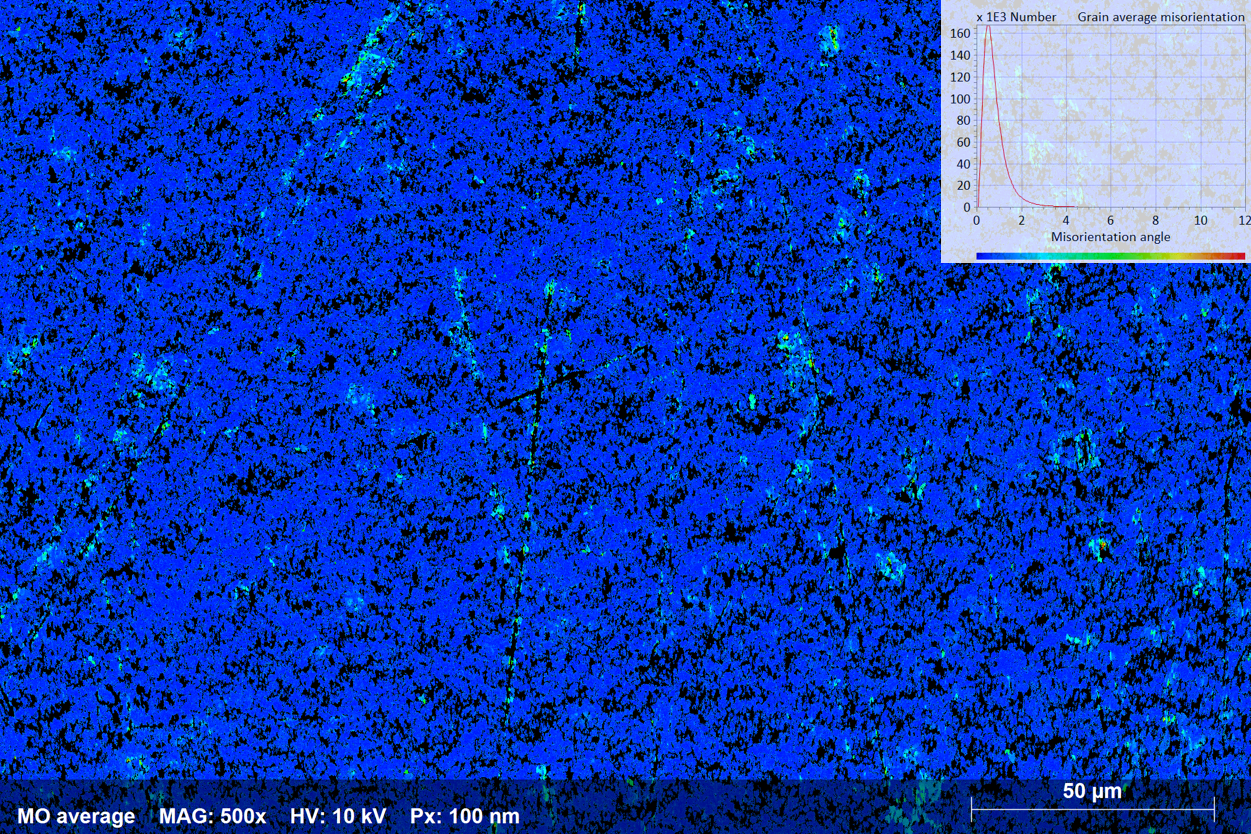
In this example, a VSP (Very Smooth Profile) copper foil was analyzed with an eWARP EBSD detector. A gentle chemical polishing was applied on the surface using colloidal silica solution and a soft cloth, without inducing mechanical deformation (see Figure 1). In only 18 minutes more than 3 million pixels were measured at a speed of approximately 2800 point per seconds. The microstructure was analyzed using only 10 kV acceleration voltage and 12 nA beam current.
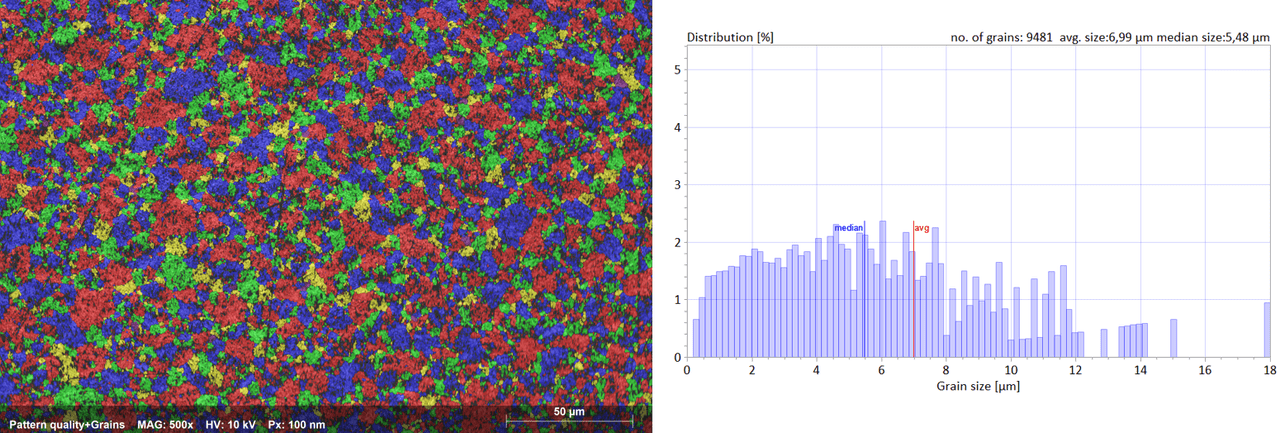
The grain size distribution was measured over a large area of 250 x180 µm2, with 9481 grains with an average size of 7 µm and a maximum size of 18 µm (Figure 2). A more detailed analysis was conducted using a 30 nm step size to investigate the fine twin domains. ESPRIT software identifies the intergranular twin boundaries as <111> 60° (Σ3) and <110> 40° (Σ9) misorientations, they represent eight times the total length of the detected grain boundaries. The Inverse Pole Figure (IPF) map in Figure 4 highlights the twinned structure and show no predominant preferential crystallographic orientation. The texture analysis (Figure 5) reveals that the <111>//Z fiber texture accounts for 14.6% and the <110>//Z fiber texture for 17.4%.
These results indicate that the strength of the analyzed VPS copper foil is predominantly controlled by the twin boundaries.


References & Further Information
- Eric Bogatin, “The Quest for Smoother Copper May Have Reached Its Limit”, SIJ January 2020 Print Issue, Design Tips: Page 44.
- Zhu et al., “Mechanical properties of commercial copper current-collector foils”, RSC Adv., 2014, 4, 57671