Life Science Research
Nucleic Acids

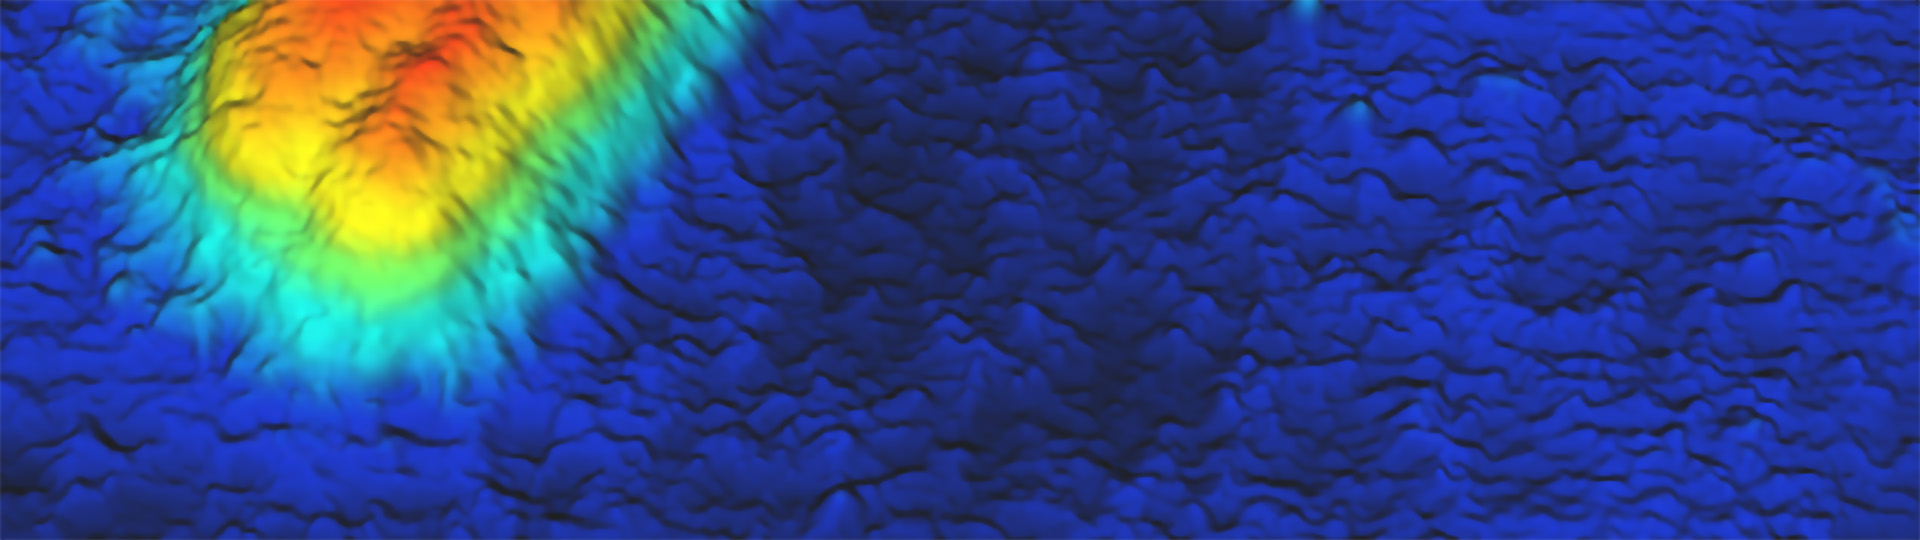
DNA Origami at 150 Lines/Sec
Tailored DNA origami frames imaged in TAE 10 mM MgCl2 buffer on mica with the JPK NanoWIzard BioScience 4 XP AFM. Scan field: 125 nm; height range: 4.4 nm; scan speed: 150 lines/sec.
Courtesy of:
R. Willaert, VUB
Brussels (BE)
DNA Origami – Faceman
Vector DNA on a poly-lornithine covered mica substrate measured in liquid and cross-section of the marked region. Major and minor grooves are clearly visible. Imaged with QI™ mode. Scan size: 90 nm × 90 nm; z-range: 2 nm. Imaged with NanoWizard BioScience AFM.
DNA at -25 °C
NanoWizard BioScience AFM imaging of DNA at -25 °C in inert gas atmosphere performed with the Heating Cooling Module - HCM™. Scan size: 750 nm x 750 nm, z-range: 3 nm.
Human Lymphocyte Chromosomes
3D topography of a group of 3 metaphase chromosomes. Scan field 10 µm x 10 µm; z-range: 0-200 nm. Imaged with NanoWizard BioScience AFM.
Proteins and Molecules
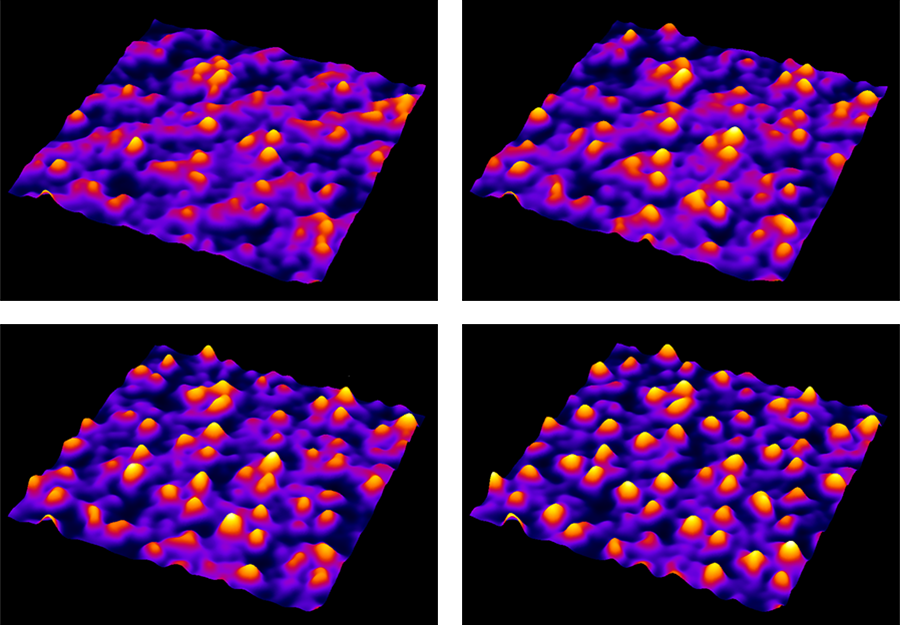
Bacteriorhodopsin Membrane – QI™ Mode
NanoWizard BioScience AFM images of bacteriorhodopsin membrane proteins measured in buffer solution with QI™ mode. Scan size: 30 nm × 30 nm, z-range: 600 pm. Height images were calculated at different interaction forces to demonstrate the potential of topography reconstruction and tomography images.
- Top left: Interacton force 580 pN
- Top right: Interaction force 427 pN
- Bottom left: Interaction force 244 pN
- Bottom right: Interaction force 122 pN
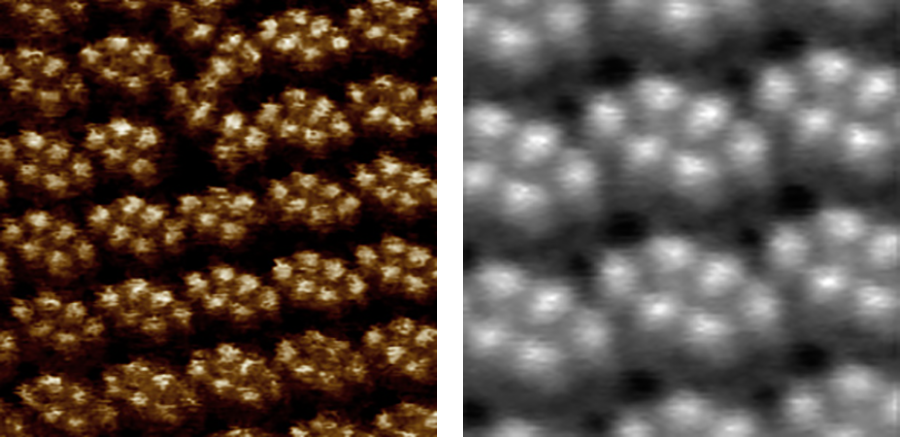
OmpF Protein Crystal
Protein crystal of OmpF (outer membrane porin F), with correlation average image. The defects in the crystal structure confirm the single monomer resolution. Imaged with NanoWizard BioScience AFM.
The correlation image was calculated with IPLT (http://www.iplt.org, Philippsen et. al. 2007, JSB 157: 28-37), using an unpublished correlation average processing scheme.
- Left: Height image (scan field: 70 nm x 70 nm; Z-range: 1 nm)
- Right: Correlation average image (scan field: 35 nm x 35 nm)
Courtesy of:
Dr. P. Frederix
BIOTEC Center
University of Basel
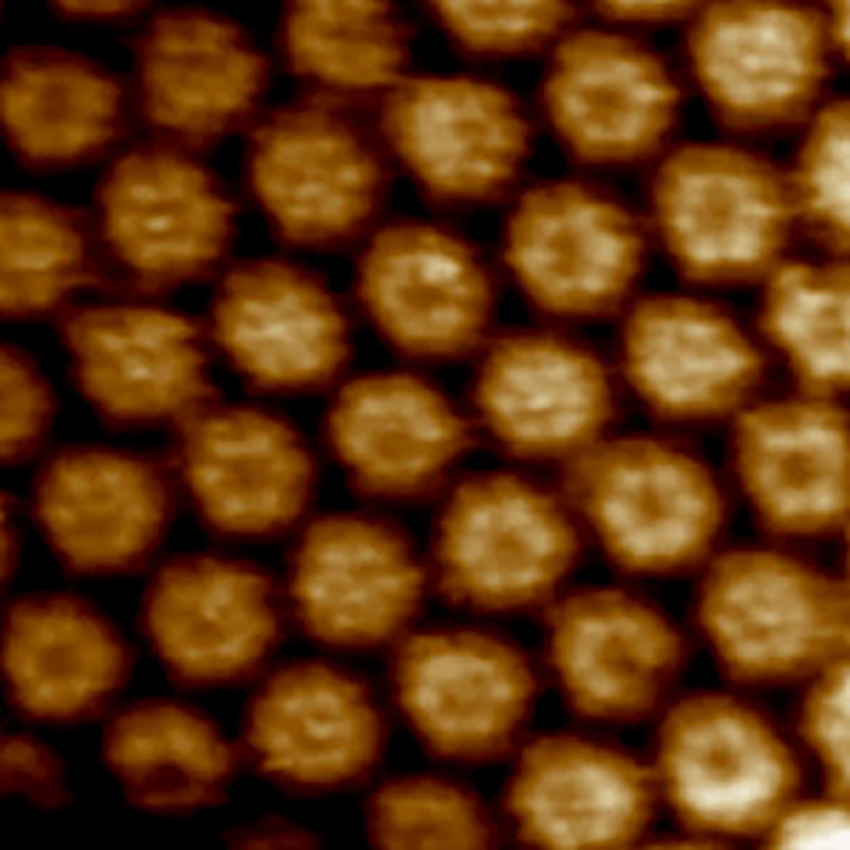
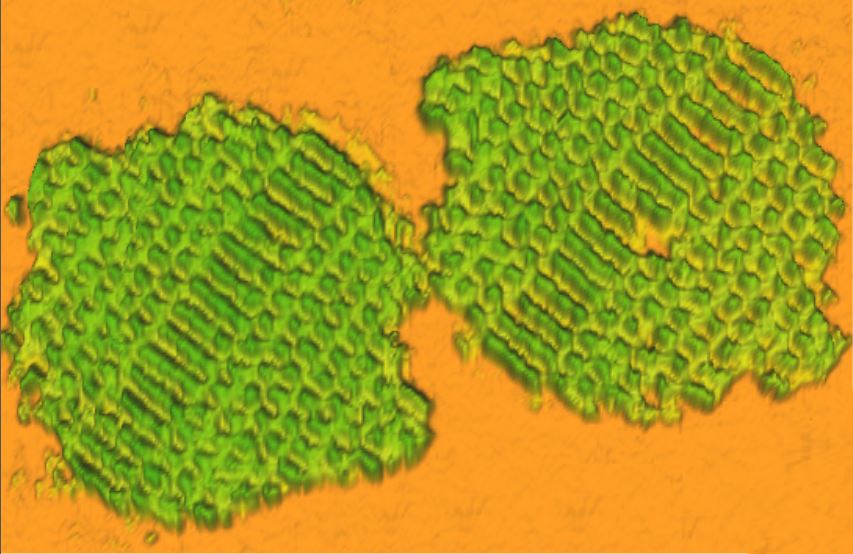
High-Resolution Image of HPI Layer
Height image (closed-loop) of the hexagonally packed intermediate (HPI) layer of D. radiodurans. Scan field: 100 nm x 100 nm; z-range: 4.5 nm. maged with NanoWizard BioScience AFM.
Courtesy of:
Dr. Patrick Frederix
Engel group
University of Basel
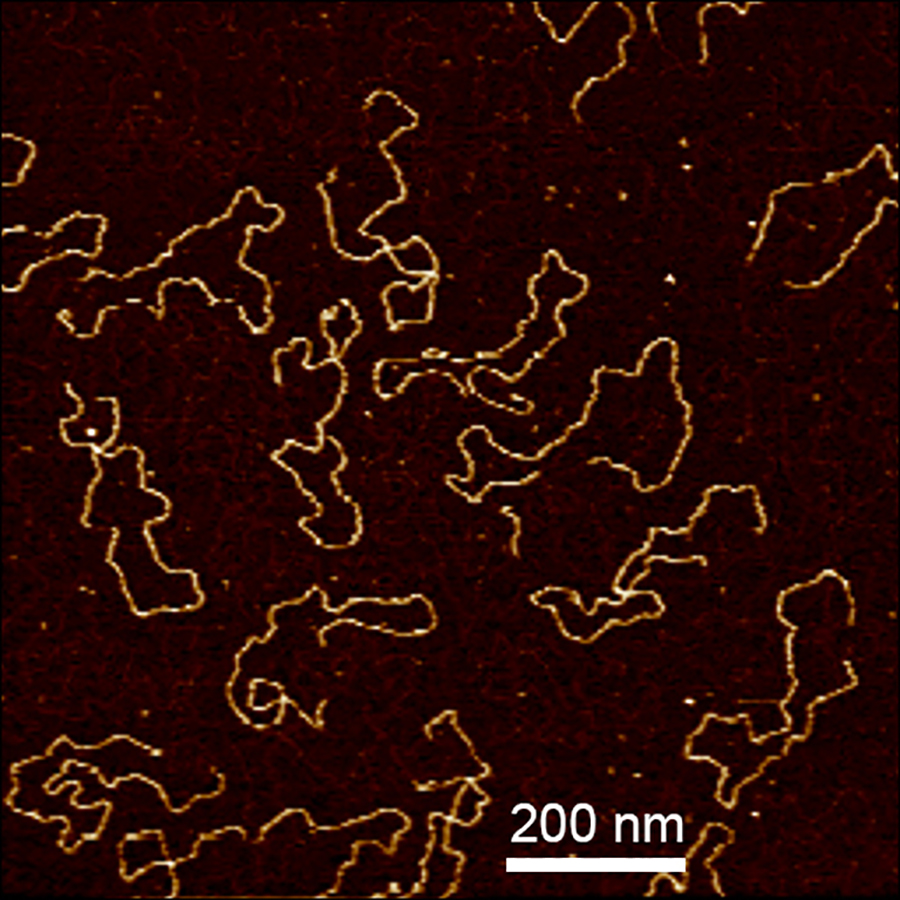
DNA Imaged with PeakForce Tapping Mode
DNA molecules in liquid on a polycationic covered mica substrate – imaged using NanoWizard Sense AFM in PeakForce Tapping mode, height range 3 nm.
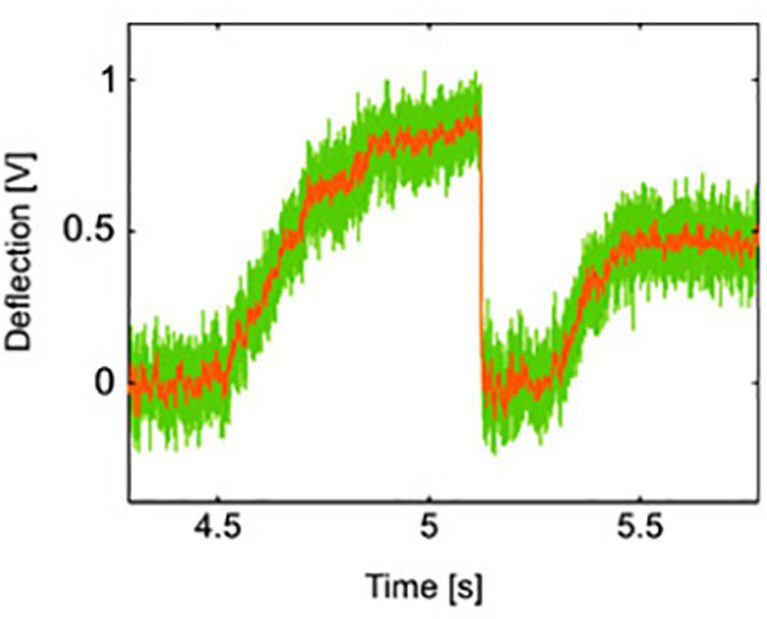
Kinesin Motility
Original quadrant photodiode deflection signal due to kinesin stepping on a microtubule filament, captured with the NanoTracker optical tweezers platform. There are multiple kinesins bound to the 1 µm silica microspheres, resulting in a continuous walking. The orange line results from filtering of the raw data (green).
Fibrils and Fibers
Twisted Insulin Fibrils
Twisted insulin fibrils images with NanoWizard BioScience AFM in QI™ mode. Scan size: 3 μm × 3 μm.
- Left: Height image (z-range:10 nm)
- Right: 3D height image overlaid with elasticity information (color texture range: 2 N/m)
Sample courtesy of:
Dr. Claudio Canale
Nanophysics dept., Istituto Italiano di Tecnologia
Genoa, Italy
Bundled Collagen Fibers
Phase and topography images of bundled collagen fibers. Imaged with NanoWizard BioScience AFM.
- Top left: Height image zoomed (scan field: 1 µm x 1 µm; z-range: 55 nm)
- Top right: Phase image zoomed (scan field: 1 µm x 1 µm; z-range: 40 deg)
- Bottom left: Height image (scan field: 3 µm x 3 µm; z-range: 120 nm)
- Bottom right: Phase image (scan field: 3 µm x 3 µm; z-range: 40 deg)
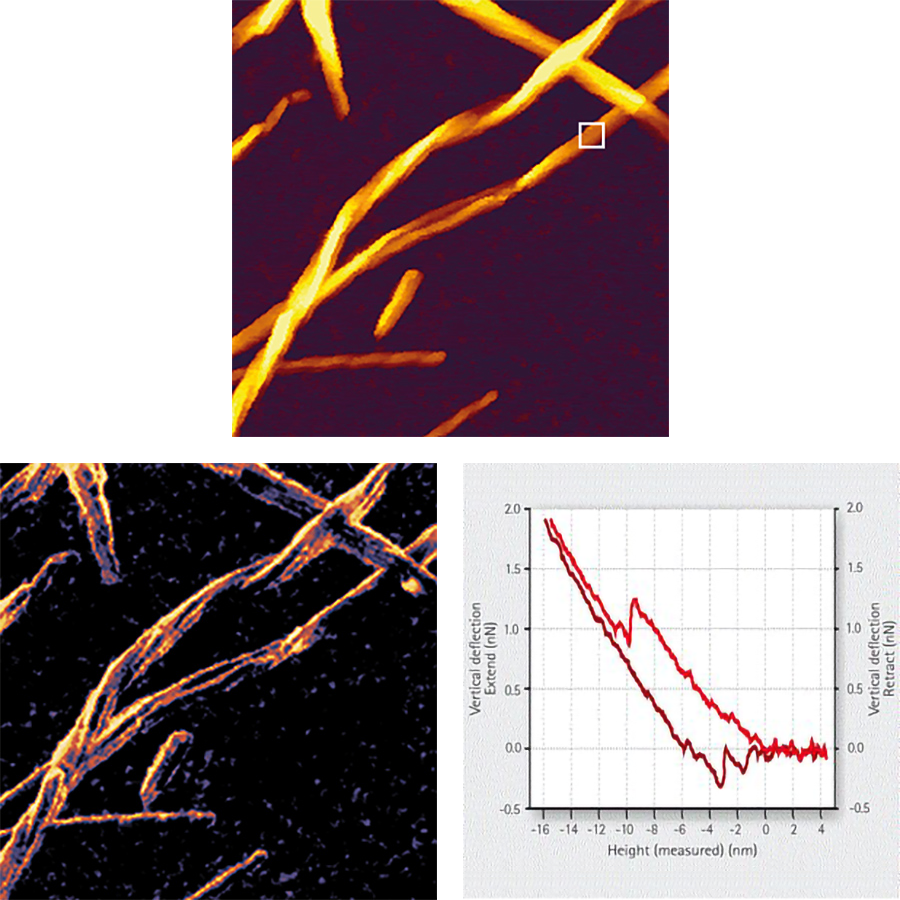
Twisted Amyloid Fibrils
Topography, Young's Modulus, and force-distance curve of twisted amyloid fibrils, imaged in buffer solution with NanoWizard BioScience AFM in QI™ mode.
- Top: Height image (scan size: 500 nm x 500 nm; z-range: 10 nm)
- Bottom left: Young's Modulus image (scan size: 500 nm × 500 nm; elasticity range: 125 MPa)
- Bottom right: Force-distance curve at the marked point
Sample courtesy of:
Dr. Claudio Canale
Nanophysics dept., Istituto Italiano di Tecnologia
Genoa, Italy
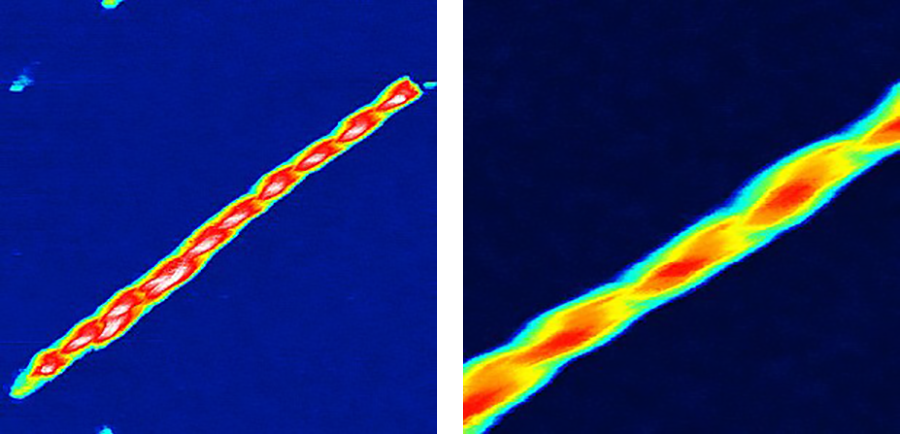
Glucagon Fibre
Height images of Glucagon fibre imaged in buffer. Imaged with NanoWizard BioScience AFM.
- Left: Height image (scan field: 812 nm x 812 nm; z-range: 15.4 nm)
- Right: Height image zoomed (scan field: 330 nm x 330 nm; z-range: 15.4 nm)
Sample courtesy of:
Dr. M. Dong and Dr. R. Meyer
Group of Prof. Besenbacher
Aarhus
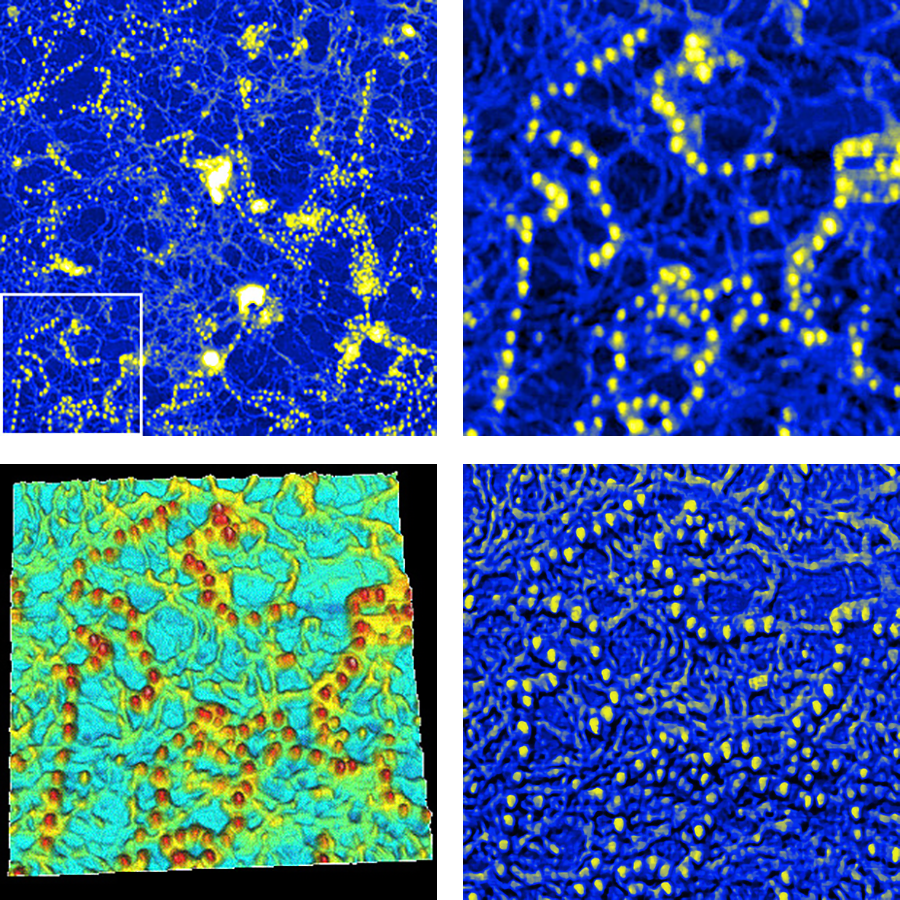
Fibrillin Microfibrils
Height image and zoom step (height, phase and 3D image) of fibrillin microfibrils. Imaged with NanoWizard BioScience AFM.
- Top left: Height image (scan field: 3 µm xx 3 µm; z-range: 18.7 nm)
- Top right: Height image zoomed (scan field: 1 µm x 1 µm; z-range: 11.9 nm)
- Bottom left: 3D topography image zoomed (scan field: 1 µm x 1 µm; z-range: 11.9 nm)
- Bottom right: Phase image zoomed (scan field: 1 µm x 1 µm; z-range: 17 deg)
Sample courtesy of:
K. van de Werf
Group of Prof. Subramaniam
University of Twente
Lipids
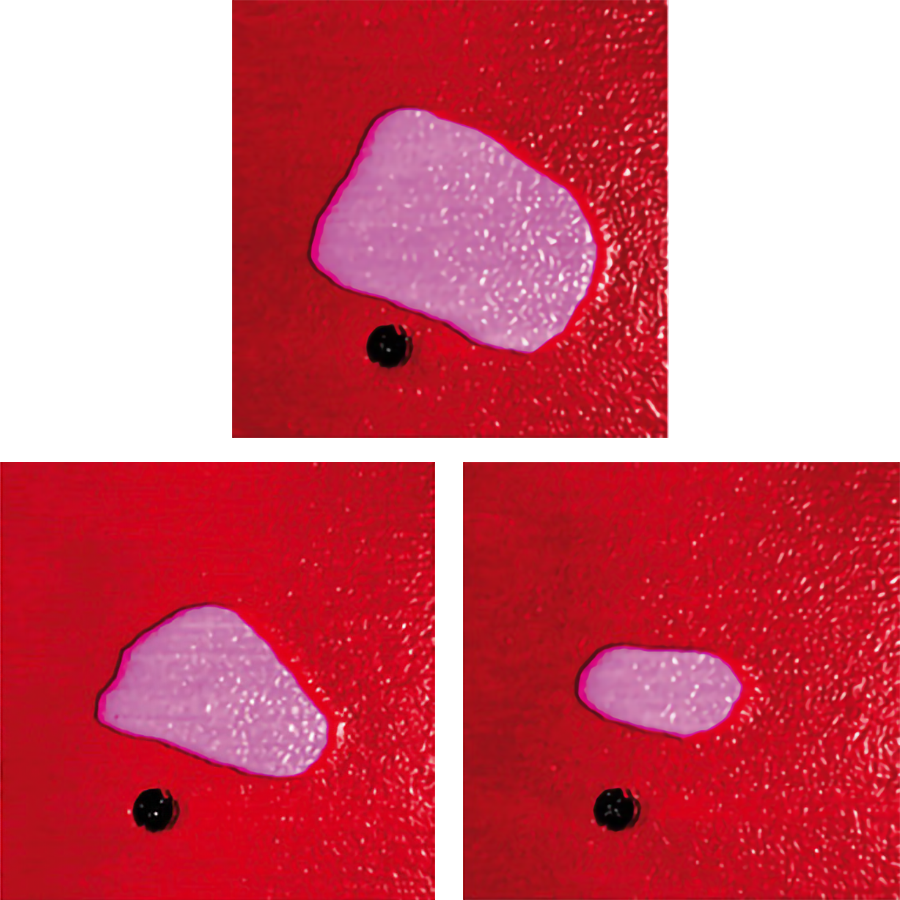
Melting of Lipid Domains in Buffer
Melting of domains in a binary mixture of DPPC/DOPC supported bilayer under increasing temperature (left: 40°C to right: 45°C) in buffer solution. Scan range: 2 μm x 2 μm, 70 Hz line rate, time per frame 3.6 s. Imaged with NanoWizard BioScience AFM.
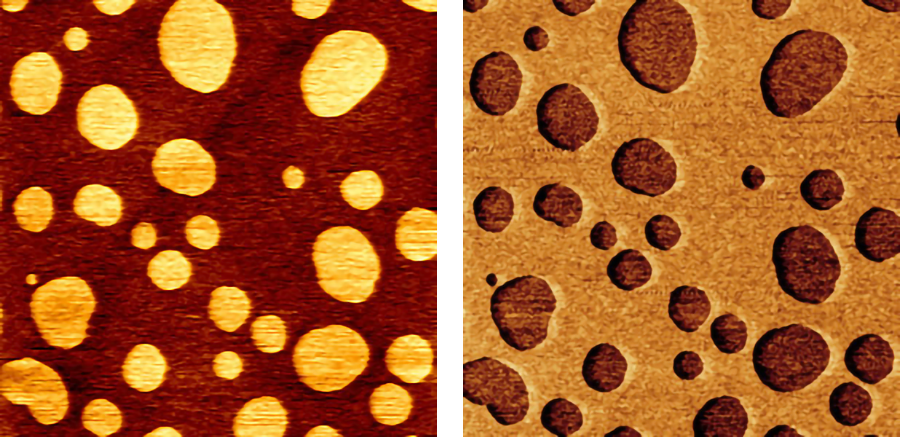
Fe-Pt Nanoparticles in Lipid Bilayer
NanoWizard BioScience AFM height, 3D view, and phase image of Fe-Pt nanoparticles (6 nm diameter) embedded in SLPC lipid bilayers. The main contrast comes from the stacked lipid layers, the texture from the embedded nanoparticles. Scan field: 5 µm x 5 µm; z-range: 0-35 nm.
- Top: Height image
- Bottom left: 3D topography
- Bottom right: Phase image
Sample courtesy of:
Prof. Meyer and A. Terheiden
University of Duisburg
Phase-Separated Lipid Bilayer
Height/phase image of phase-separated lipid bilayer (DOPC/SM/cholesterol). AC mode in liquid. Scan field: 20 µm x 20 µm; z-range: 1.5 nm. Imaged with NanoWizard Sense.
- Left: Height image
- Right: Phase image
Sample courtesy of:
S. Chiantia, Prof. Schwille Biophysics Group,
TU Dresden
Cells

Living Vero Cells
Living Vero cells in cell culture medium at 37°C in PetriDishHeater™ . Imaged with NanoWizard BioScience AFM. Optical tiling with 5 × 6 phase contrast images covering a 630 µm × 450 µm region.
2-5: Zoom into region scanned with AFM showing 100 μm × 100 μm scan (height range 5 μm) and inset 15 μm × 15 μm (height range 2 μm) scan topography images using PeakForce Tapping. The feedback correction signal images highlight the surface membrane features, particularly in the zoomed image. Microvilli dominate the center of the cell, with membrane ruffles at the cell boundary.
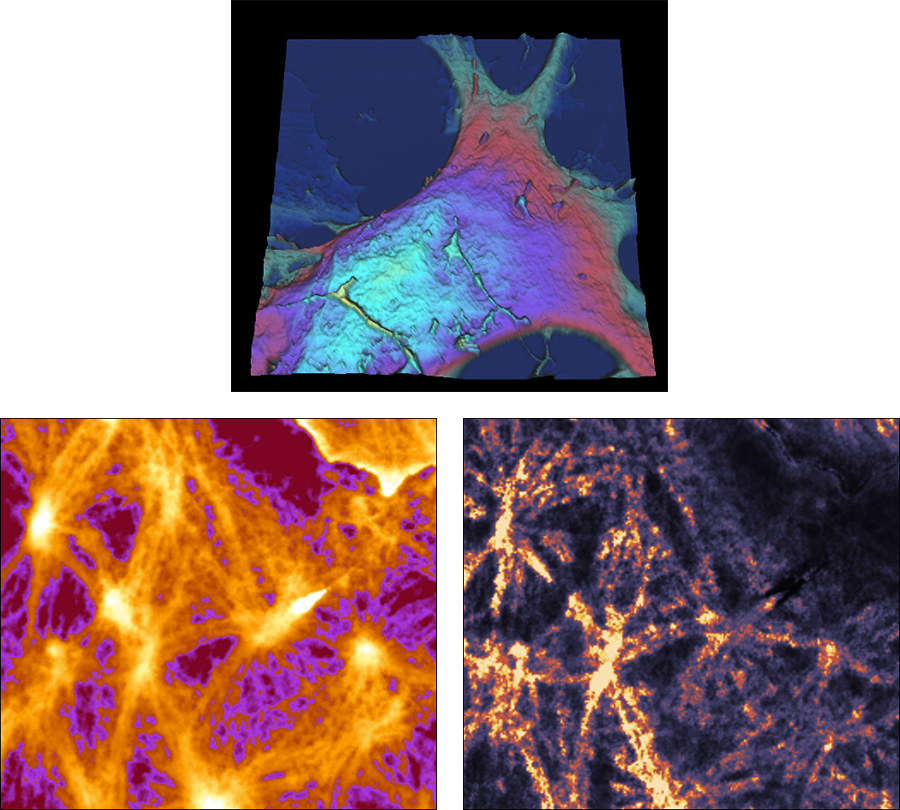
Astrocytes
Fixed astroytes derived from P2 mouse cortex. Imaged in PBS. Imaged with NanoWizard BioScience AFM in QI mode™.
- Top: Overview scan (scan size: 50 µm x 50 µm; z-range: 2.5 µm)
- Bottom left: Zoomed height image (scan size: 5 µm x 5 µm; z-range: 400 nm)
- Bottom right: Zoomed height image (scan size: 5 µm x 5 µm; z-range: 400 nm)
Sample courtesy of:
Dr. Anne Thyssen
TU Kaiserslautern
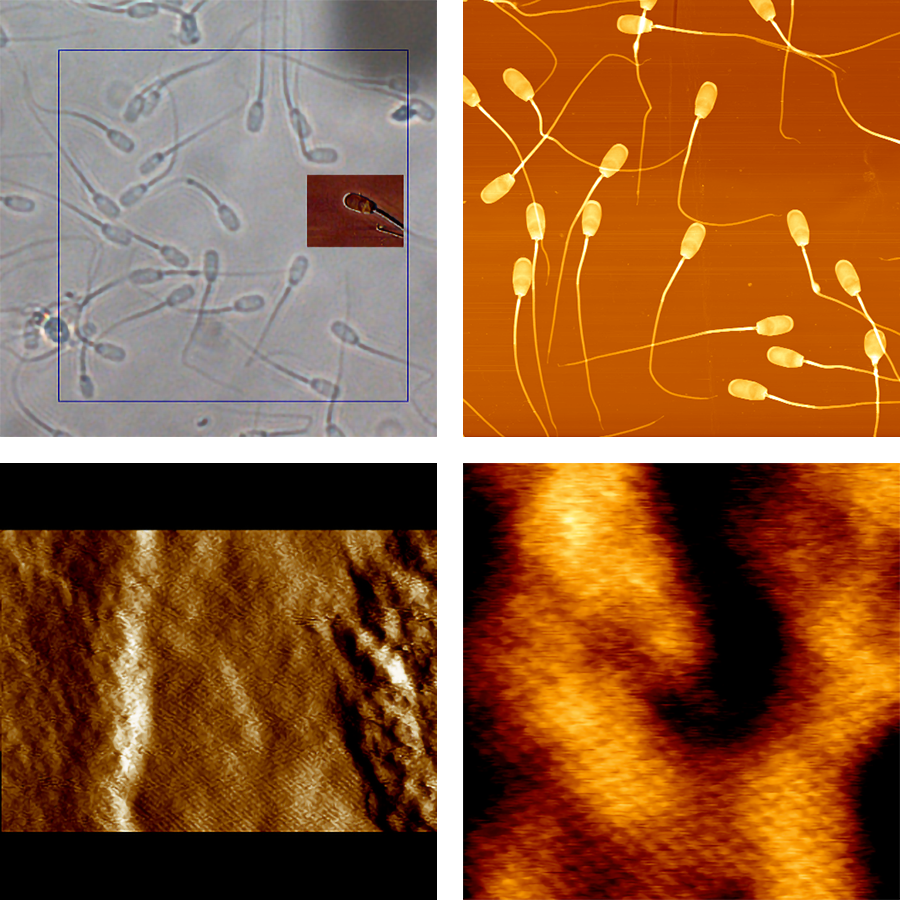
High-Resolution Imaging on Sperm
High-resolution imaging on sperms. Frame in the optical image indicates the 100 µm x 100 µm scan size of the NanoWizard BioScience AFM. High-resolution image in fluid shows protein lattice on top of sperm.
- Top left: Optical image
- Top right: Overview height image (scan size 100 µm x 100 µm; z-range: 750 nm)
- Bottom left: Deflection image (scan size: 1.5 µm x 1 µm)
- Bottom right: Height image (scan size: 0.5 µm x 0.5 µm; z-range: 5 nm)
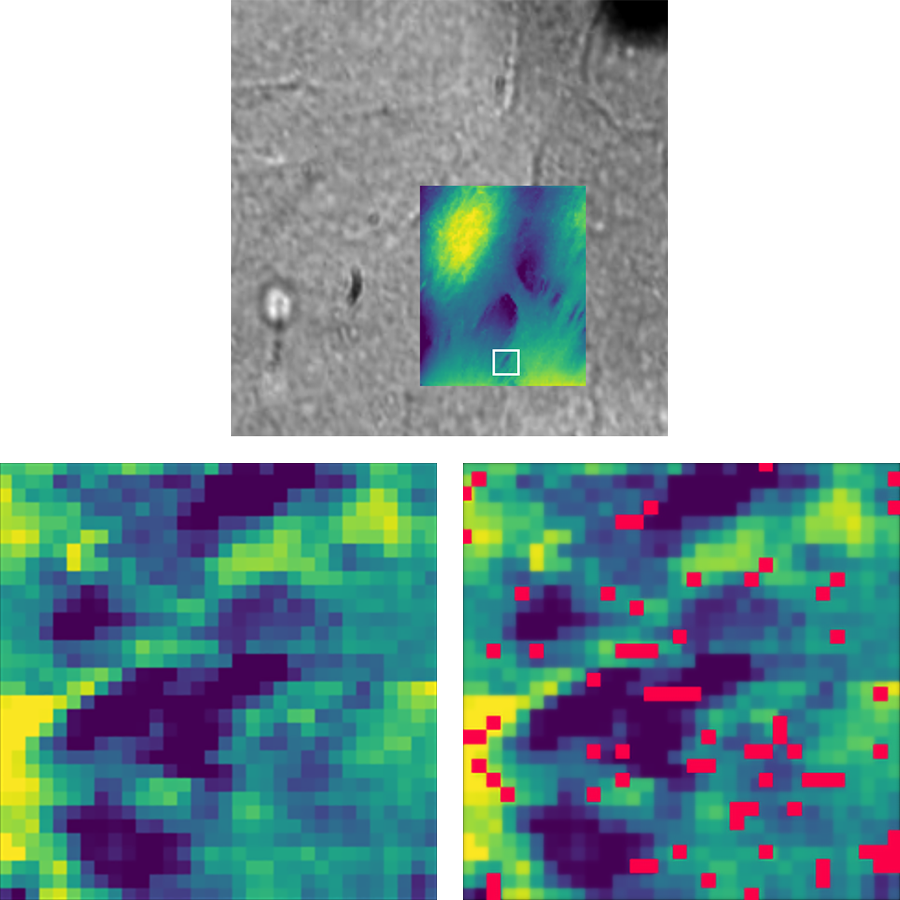
Recognition on Living Keratinocyte Cells
Recognition measurement to investigate distribution and the adhesive properties of binding events between desmosomal cadherins on living keratinocyte cells. Desmosomal cadherines are parts of desmosomes, which provide strong cell-cell adhesion to facilitate the integrity of tissues, but can also found extradesmosodal. The cantilevers were functionalized with recombinant Desmoglein 3 (Dsg3-Fc) using a PEG-linker. Imaged with NanoWizard BioScience AFM; DirectOverlay™ feature was used.
- Top: Optical image (63x brightfield) overlaid with topography image. (scan size: 25 μm × 30 μm; Z-range: 2.5 μm
- Bottom left: Recognition data of cell border region: Height image (scan size: 2.5 μm × 2.5 μm; z-range: 0.4 μm)
- Bottom right: Overlay of height and recognition data (scan size: 2.5 μm x 2.5 μm)
Data courtesy of:
Dr. Franziska Vielmuth, Prof. Volker Spindler
Institute of Anatomy and Cell Biology
Ludwig-Maximilians Universität Munich
Germany
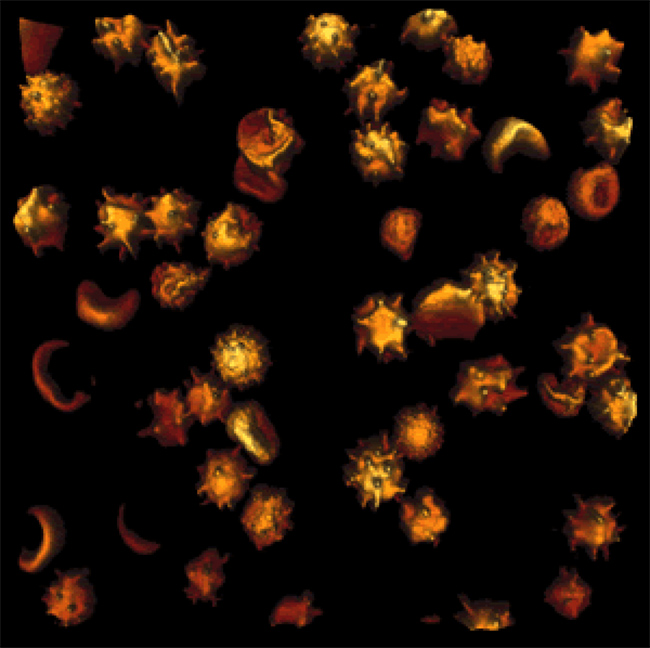
Malaria Infected Red Blood Cells
3D image of malaria-infected red blood cells captured with NanoWizard BioScience AFM.
Image courtesy of:
Prof. Amrein
University of Calgary, Canada
Microbiology
Imaging of Bacteria S-layer with QI™
Bacteria were immobilized by using CellTak and imaged with NanoWizard BioScience AFM in QI™ mode in air. S-layer is clearly visible. Using Fourier analysis, the periodicity of the hexagonal s-lattice was found to be around 18 nm.
- Left: QI height image (scan size 3 μm x 3 μm; z-range: 60 nm)
- Right: Overlay of high pass filtered image (greyscale) and 3D topography of the height channel. (scan size 1.5 μm x 1.5 μm; z-range: 60 nm)
Sample courtesy of:
Assoc. Prof Michal Koblížek and Dr. David Kaftan
Institute of Microbiology ASCR
Trebon, Czech Republic
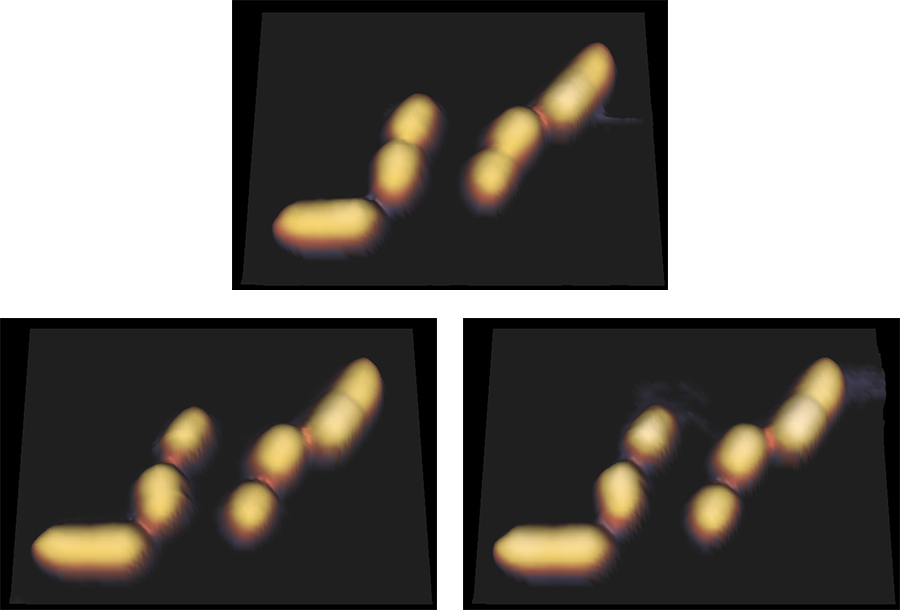
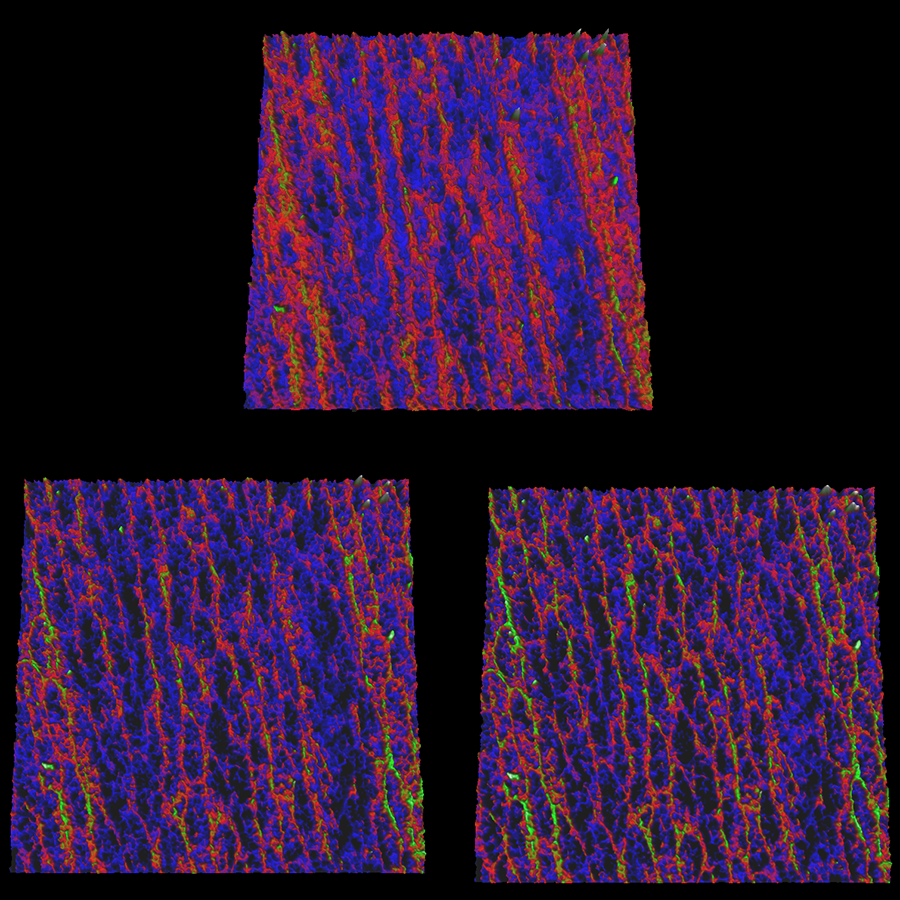
Cell Division E-Coli Bacteria
Living E-coli bacteria during cell division process. Four individual bacteria were analyzed over 1h during division process in QI™ mode using Biocell™ at 30°C. Three representative height images are shown . Scan size 5 μm × 7 μm, z-range: 1.5 μm. maged with NanoWizard BioScience AFM.
- Top: Time frame 1
- Bottom left: Time frame 2
- Bottom right: Time frame 3
Sample courtesy of:
Supriya Bhat and Prof. Tanya Dahms
University of Regina
Canada
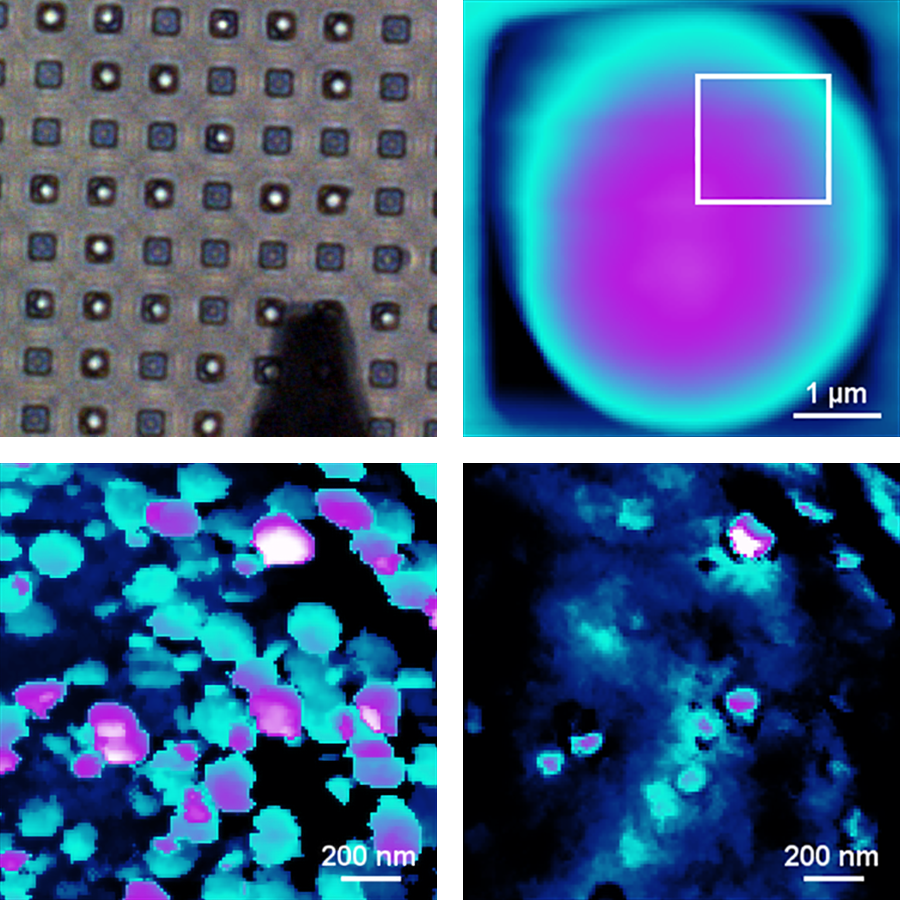
Living Candida Albicans - AFM with Phase Contrast
Height, adhesion and slope image of living Candida albicans embedded in PDMS matrix, imaged with NanoWizard BioScience AFM in QI™ mode. Adhesive nanodomains clearly correspond to stiffer cell regions.
- Top left: Optical phase image 40×
- Top right: Height image of single cell (z-range 2.5 μm)
- Bottom left: Adhesion image of marked region (z-range: 3.25 nN)
- Bottom right: Slope image of marked region (z-range: 9.5-12.5 nN/μm)
Data courtesy of:
Dr. Cécile Formosa, UCL, Belgium
Dr. Etienne Dague, LAAS, France
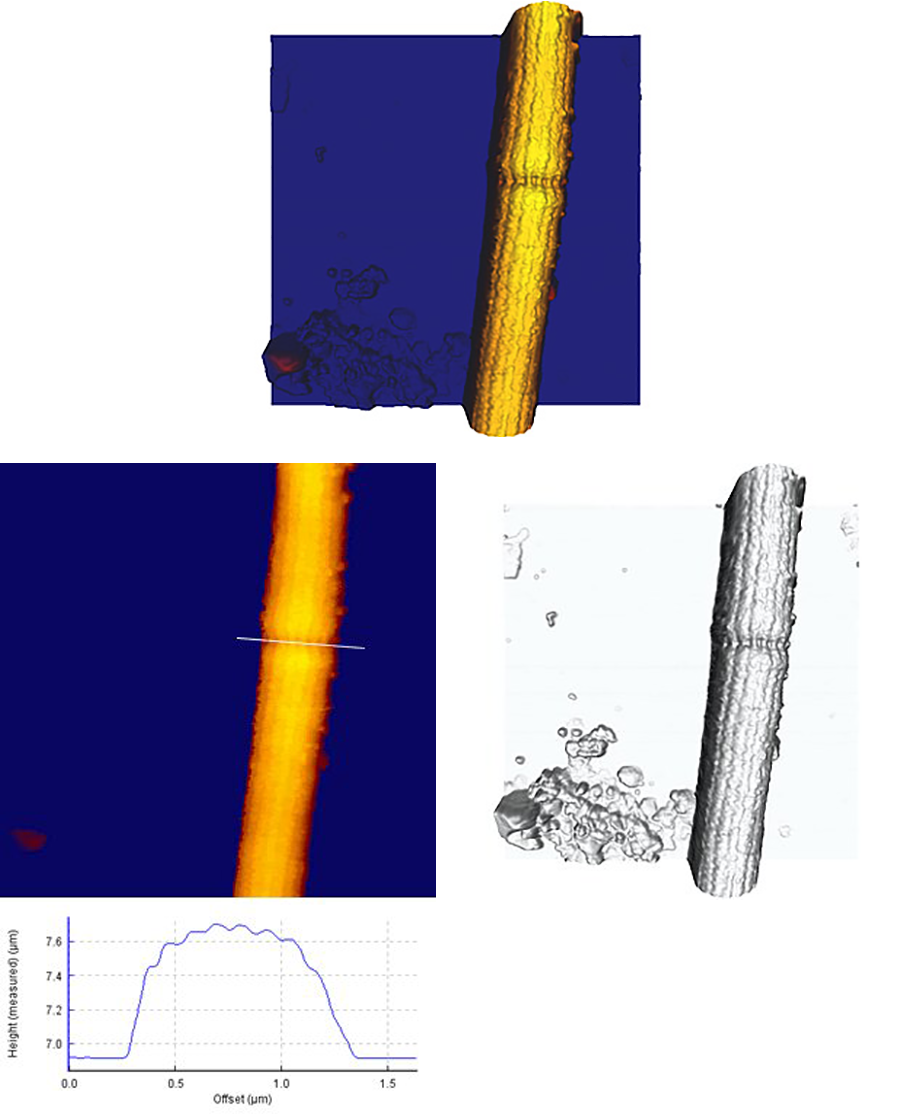
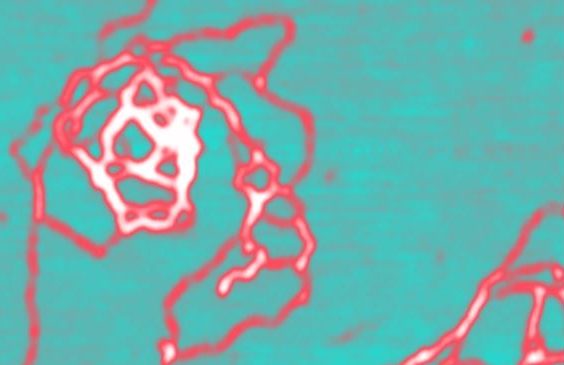
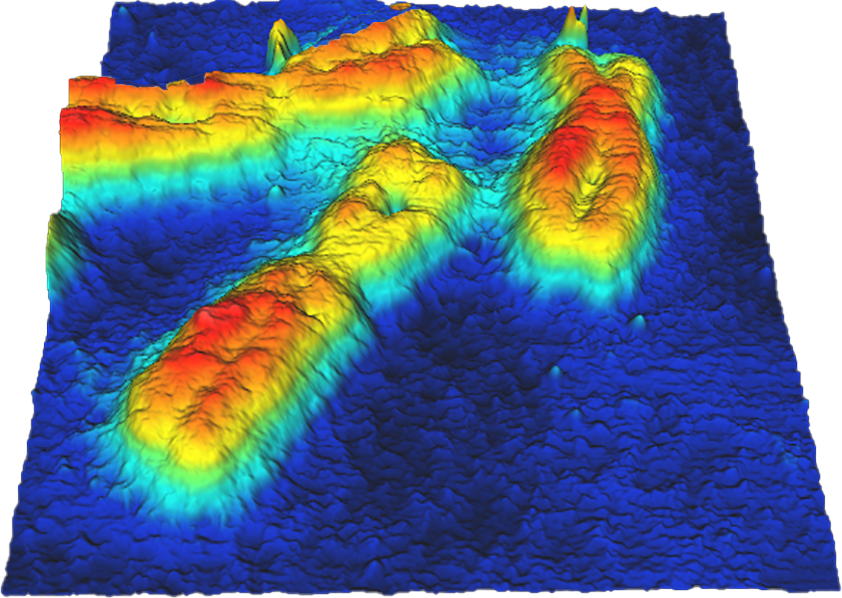
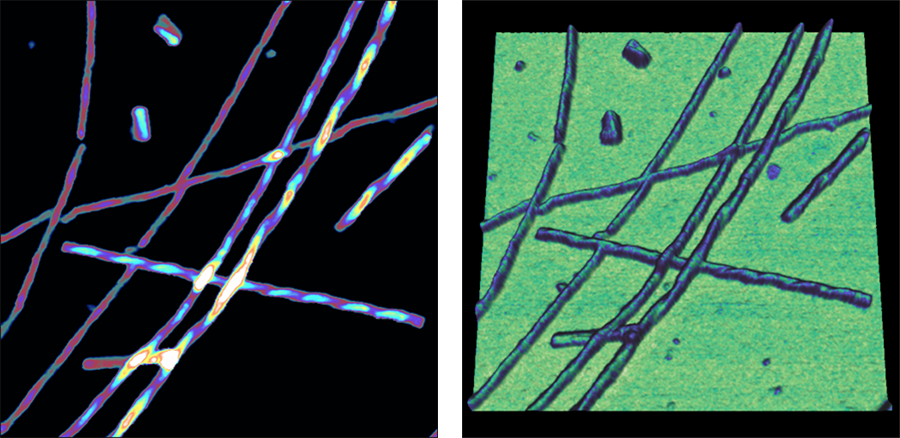
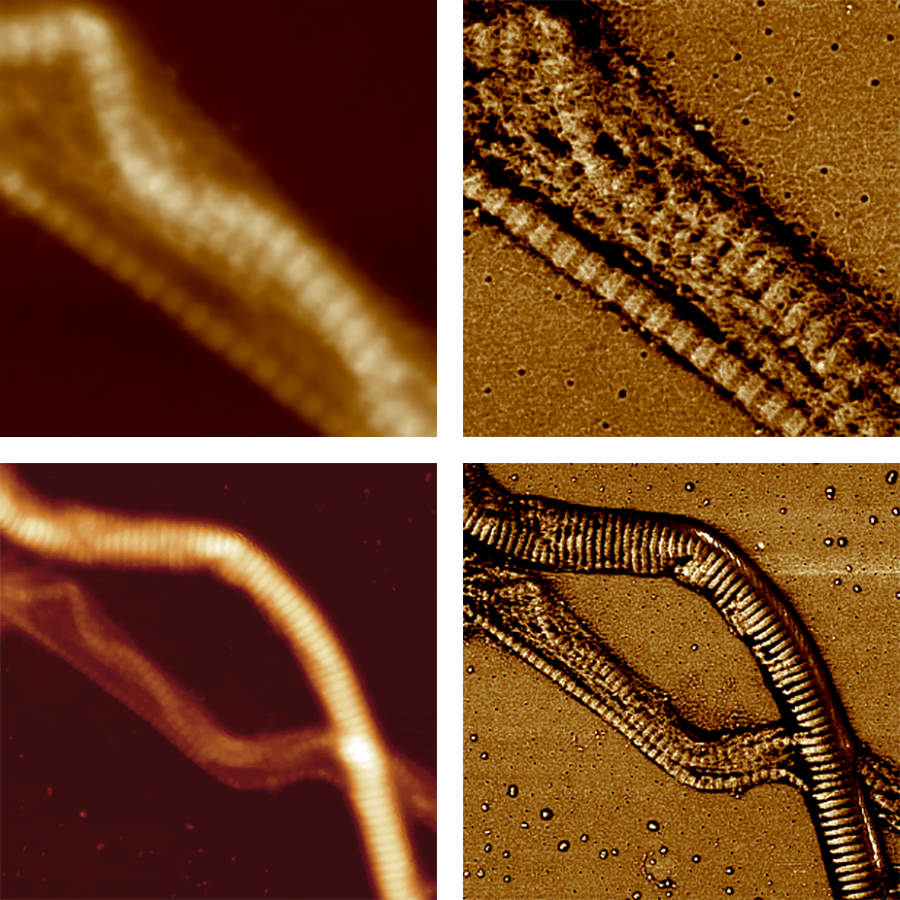
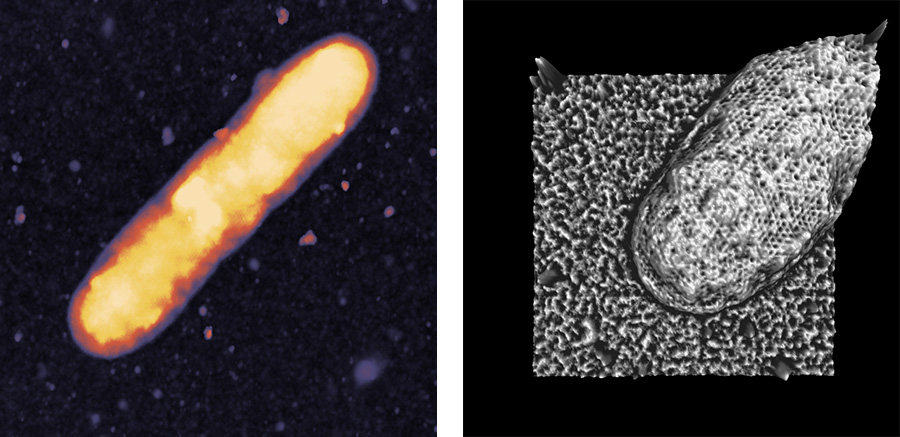
Desulfobulbus Bacterial Cells
Filamentous bacteria (Desulfobulbaceae) conduct electricity in sediments. The cells show cable-like structures along their length axis that continue across the gaps between adjacent cells in the filament. Scan size: 5 µm × 5 µm; z-range: 700 nm. Imaged with NanoWizard BioScience AFM.
- Top: 3D topography image
- Bottom left: Height image with cross-section
- Bottom right: 3D topography overlaid with amplitude image
Image courtesy of:
Dr. Rikke Louise Meyer
Aarhus University
Denmark
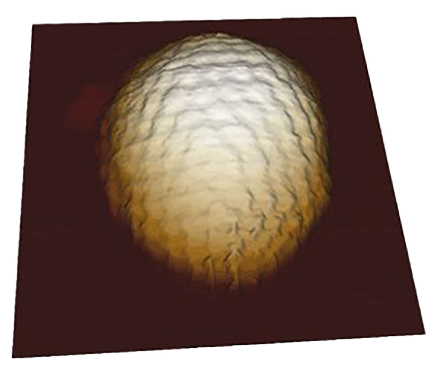
Herpes Simplex Virus
AFM topography of Herpes Simplex Virus imaged with NanoWizard BioScience AFM in QI™ mode. Herpes Simplex Virus adsorbed onto silanized glass slide measured in buffer solution; virus substructure can be easily resolved. Scan field: 300 × 300 nm; z-range: 150 nm.
Sample courtesy of:
Dr Wouter Roos
Vrije Universiteit Amsterdam
The Netherlands
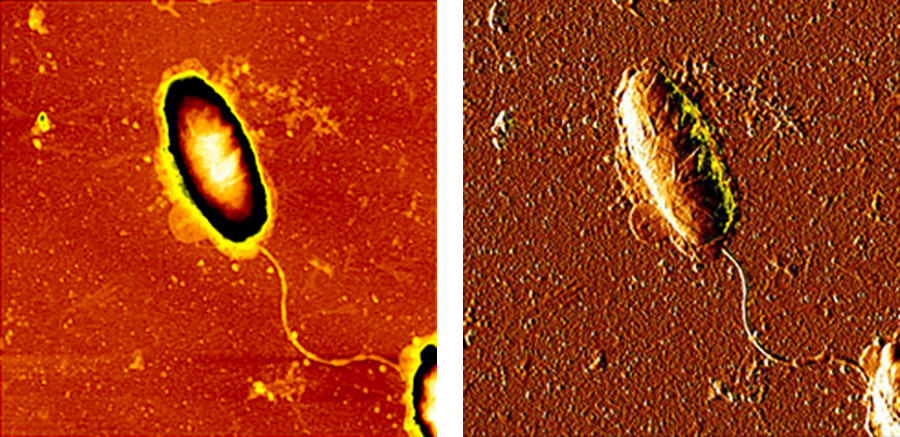
H. Pylori Bacterium
NanoWizard Sense AFM images of a bacterial cell (H. pylori) in air.
- Left: Height image
- Right: Deflection image
Sample courtesy of:
Dr. J. Gebel
University of Bonn
Tissues and Biomaterials
Human Dental Enamel
Dynamic morphology changes of human dental enamel through acid interaction (10 mM HCl). The vanishing enamel prisms and the remaining dentin framework can be seen. Z-range: 250 nm, scan size 50 μm × 50 μm, line rate 6 Hz. Imaged with NanoWizard BioScience AFM.
- Top: Height image - Time frame 1
- Bottom left: Height image - Time frame 2
- Bottom right: Height image - Time frame 3
Sample courtesy of:
Dr. Christine Müller-Renno, TU Kaiserslautern
Prof. Dr. Matthias Hannig, Uniklinikum des Saarlandes
Germany
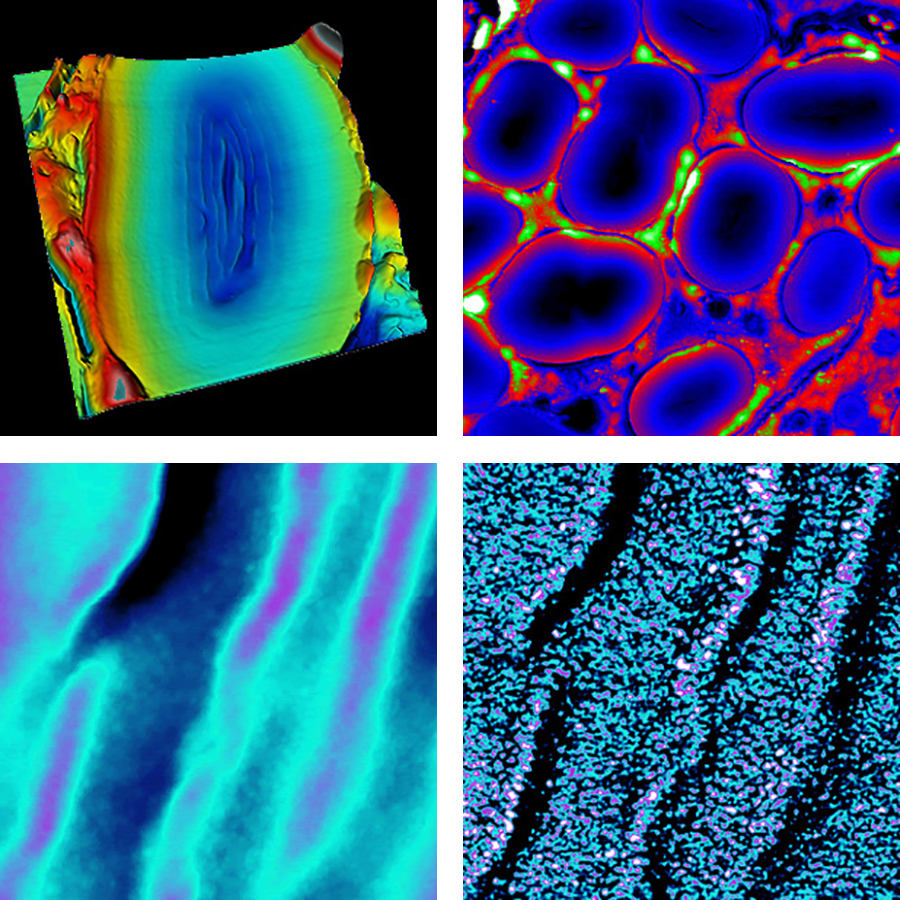
Pea Starch Granules
NanoWizard BioScience AFM topography/phase images and zoom steps of pea starch granules. The surface of a section through a pea sample, showing the starch granules.
- Top Left: 3D topography image (zoom 1) (scan field: 20 µm x 20 µm; z-range: 950.7 nm)
- Top right: Height image (scan field: 70 µm x 70 µm; z-range: 1.3 µm)
- Bottom left: Height image (zoom 2) (scan field: 2 µm x 2 µm; z-range: 63 nm)
- Bottom right: Phase image (zoom 2) (scan field: 2 µm x 2 µm; z-range: 9 deg)
Sample courtesy of:
Institute for Food Research
Norwich, UK
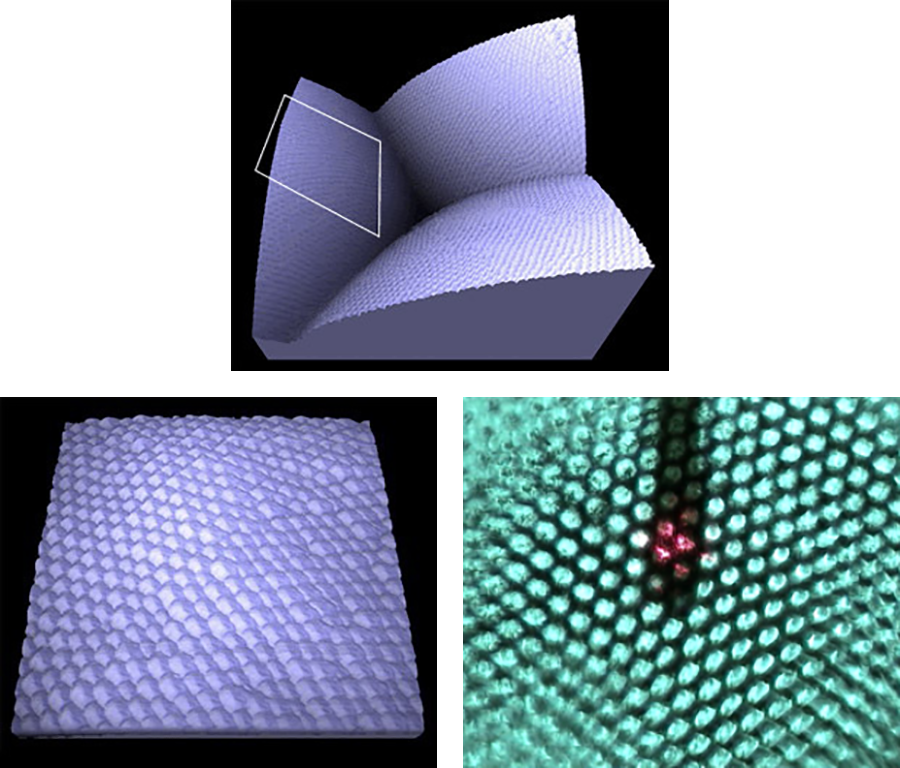
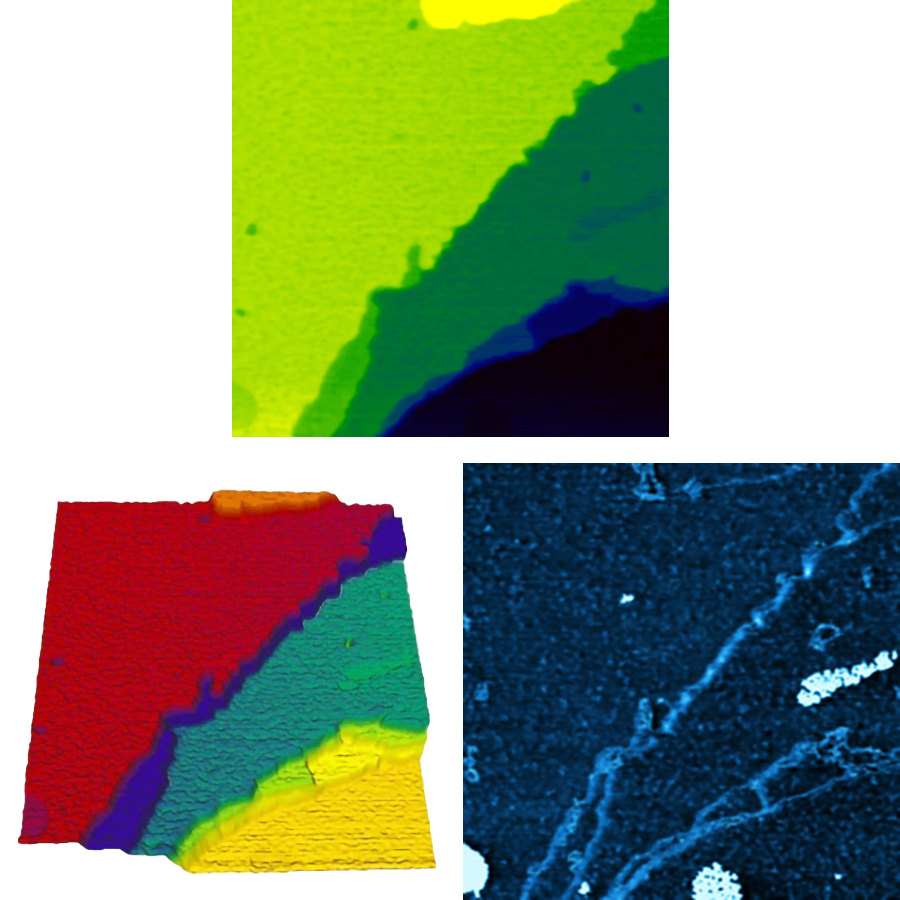
Moth's Eye
Height image (3D plot, region of three adjacent facets), zoom step, and corresponding optical microscope image of a moth's eye. Imaged with NanoWizard BioScience AFM.
The surface structure reduces light reflexion through an interference effect. This effect can be imitated for industrial use with structured PMMA surfaces.
- Top: Height image (scan field: 10 µm x 10 µm; z-range: 6.0 µm)
- Bottom left: Height image zoomed (scan field: 4 µm x 4 µm; z-range: 0-750 nm)
- Bottom right: Phase Contrast Image