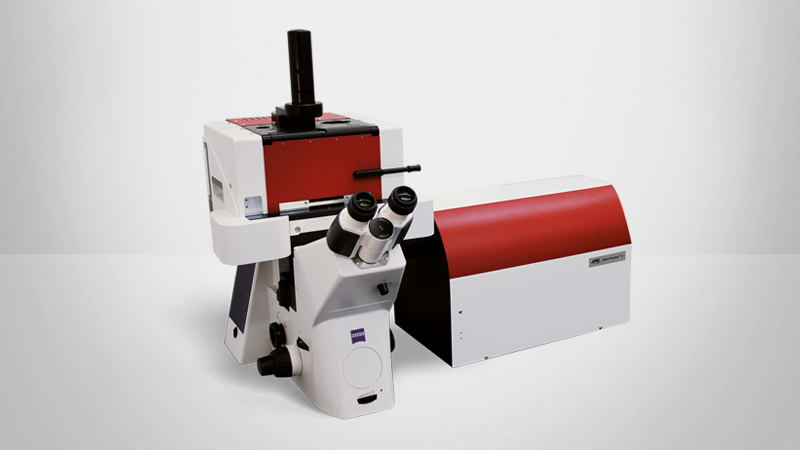
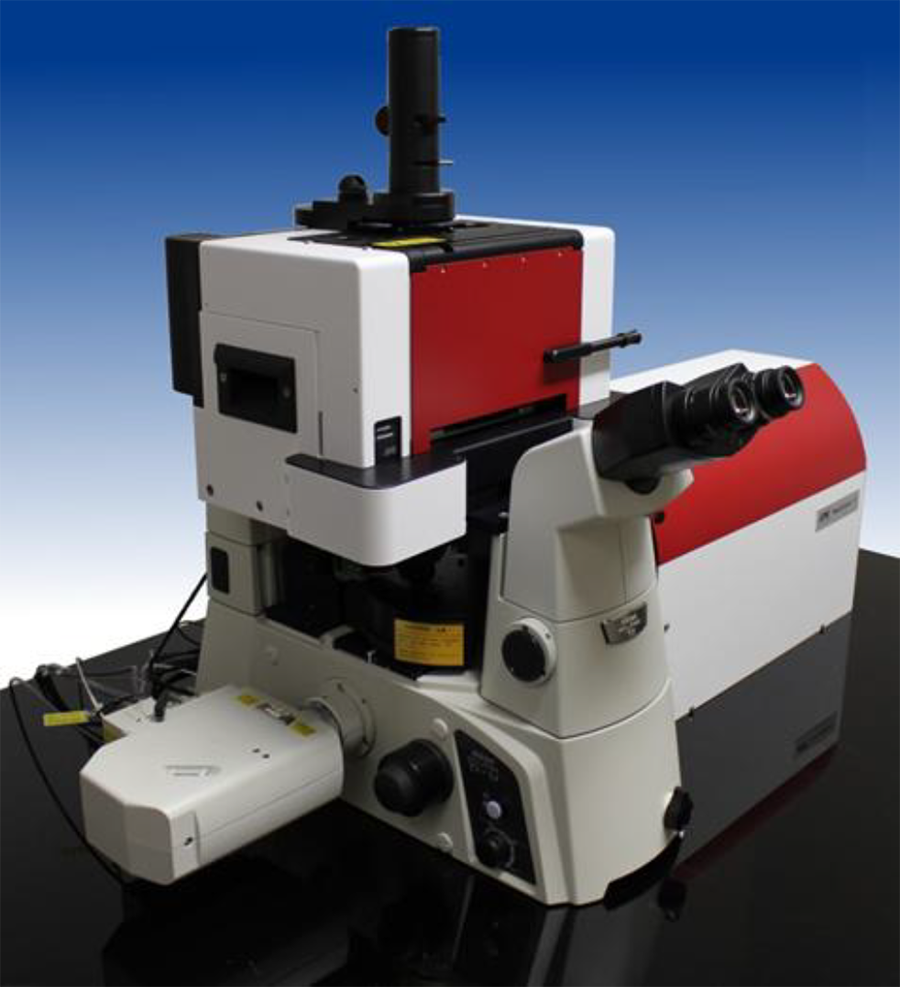
Tech Note: Integration of Confocal Laser Scanning Microscopy (CLSM) with the JPK NanoTracker 2
In integration of imaging techniques, such as optical tweezers and fluorescence microscopy, is gaining popularity and utility across disciplines in the life sciences.
This technical note describes the combination of optical manipulation and measurements with Bruker’s JPK NanoTracker and simultaneous confocal imaging. As discussed in this note, the unique optical design of the NanoTracker 2 allows for undisturbed, high-quality confocal imaging and eliminated unwanted interactions between the trapping and scanning lasers.
Readers can expect to learn about:
- The integration of the NanoTracker Optical Tweezers system with inverted optical microscopes;
- How to work with the NanoTracker and the optimized camera, scanning and positioning options; and
- The full compatibility of the NanoTracker with CSLM and any other advanced optical microscopy technique
KEYWORDS: Optical Tweezers; NanoTracker; Confocal Scanning Laser Microscopy; CSLM; Optical Imaging; Optical Integration; Force Measurements; Optical trap
Introduction
Optical manipulation as well as the related measurement of forces and displacements has become a frequently used tool in a broad range of disciplines from material sciences to biophysics and biology. Dielectric objects (typically spherical polystyrene or silica beads in the micrometer range) are optically trapped in a tightly focused laser beam and serve as handles for precise manipulations on the nanometer scale down to the single molecule level. With the NanoTracker™ 2, the simultaneous high-resolution measurement of piconewton forces and nanometer displacements within the trap becomes available.
Many biological applications require the combination of optical manipulation with advanced imaging techniques like differential interference contrast (DIC) and fluorescence microscopy. In particular, the investigation of interactions between microscopic objects and live cells or cellular organelles demands the integration of state-of-the-art fluorescence microscopy techniques with optical trapping. The ability to fluorescently label or transfect and image live cells has led to important insights into fundamental cellular processes including division 1, 2, motility 3, 4 and signaling 5.
Confocal laser scanning microscopy (CLSM) is a fluorescence imaging technique that is particularly suitable for (semi-)transparent biological samples as it allows in-focus imaging at selected depths in the sample (optical sectioning). This is achieved by scanning the sample with a focused excitation laser in the focal xy-plane. The fluorescence emission light originating from that plane is selectively collected by photodetectors. Light emitted from other sample layers than the focal plane is screened using an adjustable pinhole. As a result, only light coming from a small (confocal) volume is analyzed while background signals from other parts of the sample are largely reduced. Besides the ability to image different planes in the sample, this approach results in a high signal-to-noise ratio and superior spatial resolution compared to conventional fluorescence microscopy. For more detailed information on confocal imaging techniques and their biological applications, we recommend the book by James Pawley 6.
Optical integration
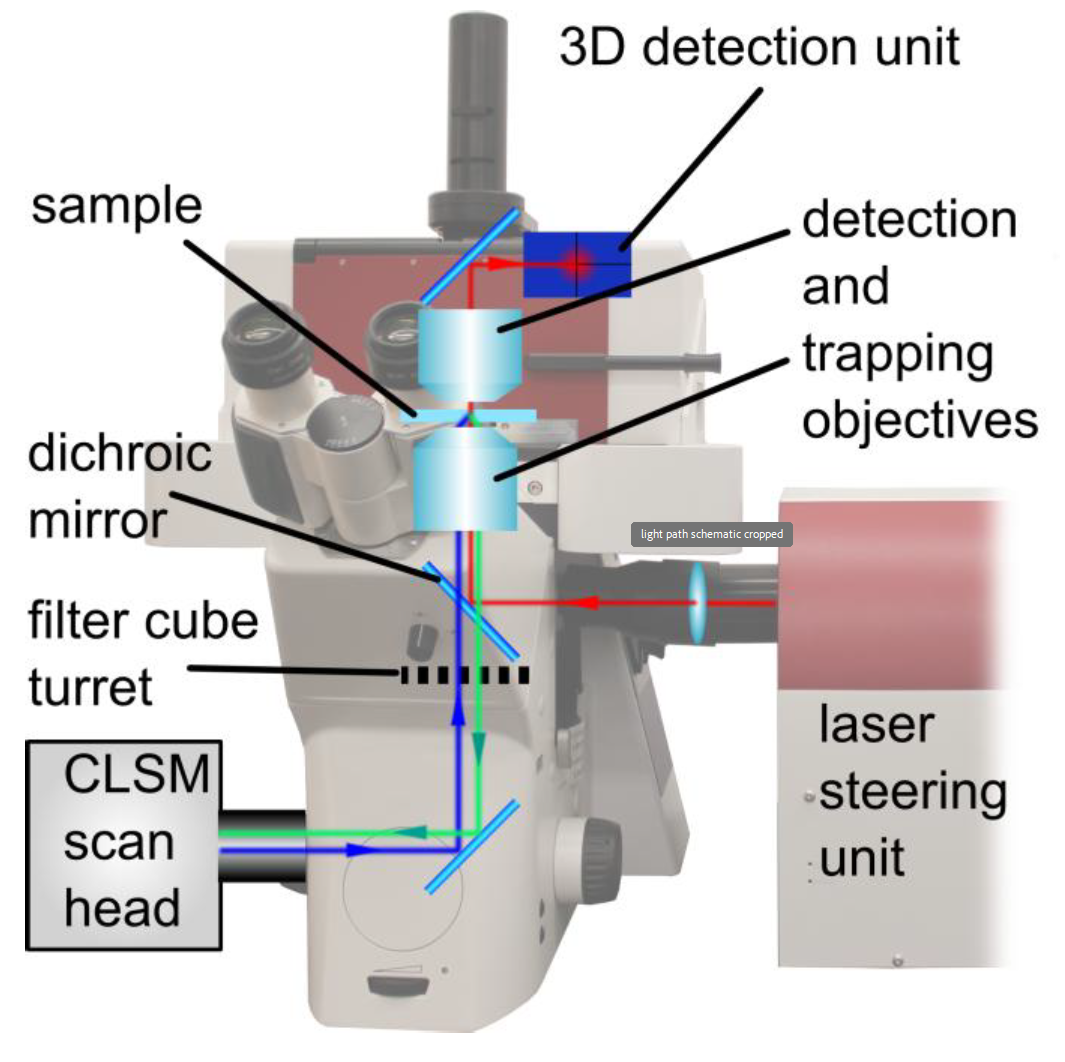
As shown in Figure 2, the original light path of the inverted optical microscope remains predominantly unchanged. The trapping laser is coupled in using an additional custom made port between the filter cube wheel and the imaging/trapping objective. This has several advantages:
- All standard microscope ports are available for feeding in additional light sources (epi-fluorescence, CLSM laser) or to attach cameras and other detectors.
- The trapping laser is not interrupted when switching between ports or changing the filter cube in the filter wheel. Thus, the unrestricted parallel use of both techniques is possible.
The 1064nm (near-infrared) laser employed in the NanoTracker™ 2 is not only suitable for delicate biological samples due to low absorption but also minimizes interference effects with fluorescence excitation lasers that are typically in the visible range (380...740nm). As an additional benefit, it is easily possible to separate the light paths of the infrared trapping laser from that of the excitation lasers and detection units using a dichroic mirror with a transmission range from 400 to 900nm.
Working with fluorescent probes: static camera image feature
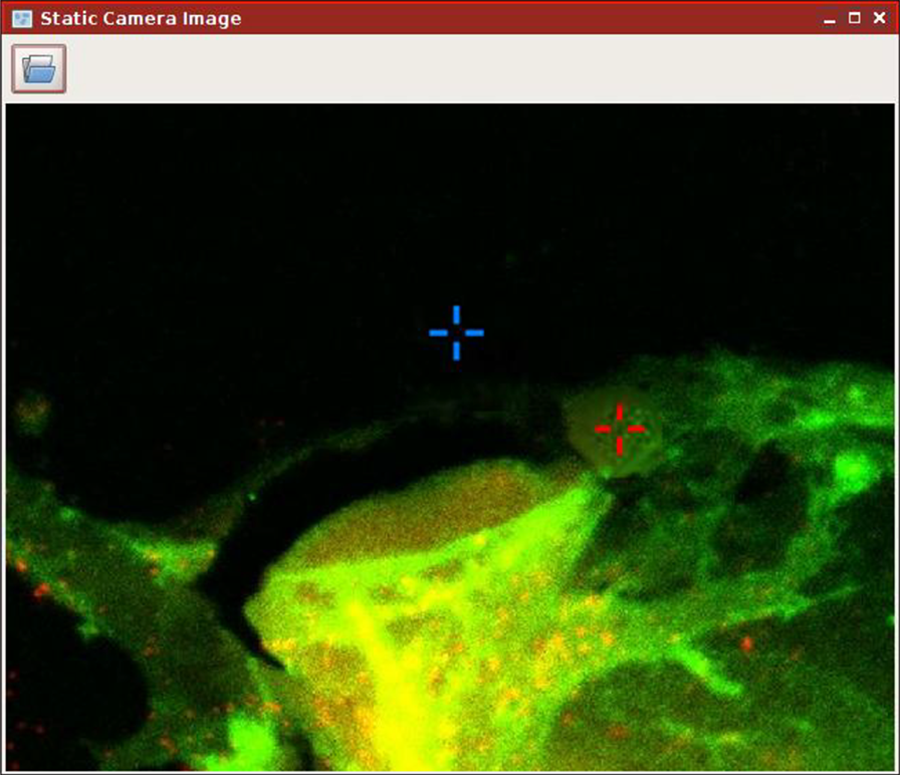
One difficulty in fluorescence imaging and, in particular, confocal imaging is the bleaching of fluorescent dyes when they are exposed to high-intensity illumination. Thus, continuous scanning of the sample, e.g., during the proper relative positioning of the optical trap with respect to the sample, should be avoided. This complicates the handling of trapped particles during confocal imaging. The problem can be overcome by the use of the static camera image function implemented in the NanoTracker™ 2 control software.
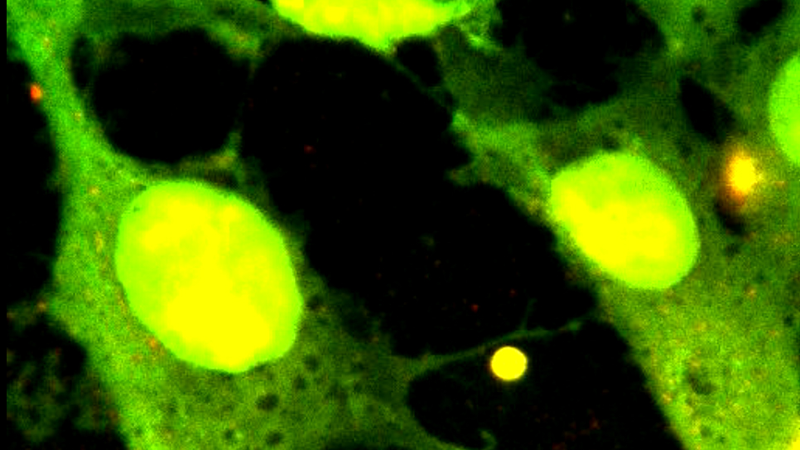
As shown in Figure 3, it allows the use of a previously recorded (fluorescence) image as background for the trap manipulation window. After the image has been loaded, the traps can be easily positioned relative to the fluorescent sample without the risk of bleaching before the actual measurement has even started. Naturally, dynamic samples like motile cells require regular updating of the image.
Sample and trap scanning
As mentioned above, the great advantage of CLSM is the ability to image different sections of the sample. These can be subsequently combined to compile 3D reconstructions of the imaged object yielding topographical or structural information. Precise positioning of the sample and, in the present case, of the optical trap is a prerequisite for high-resolution measurements with confocal setups. Equipped with a motorized stage, an X/Y/Z-piezo sample scanner and several options for three-dimensional trap positioning, The NanoTracker™ 2 system offers numerous degrees of freedom in sample and trap scanning and positioning (see box on this page). Depending on the experimental setup and goal, different scanning modes can be employed.
LEARN MORE:
Example 1:
Stationary sample, moving trap
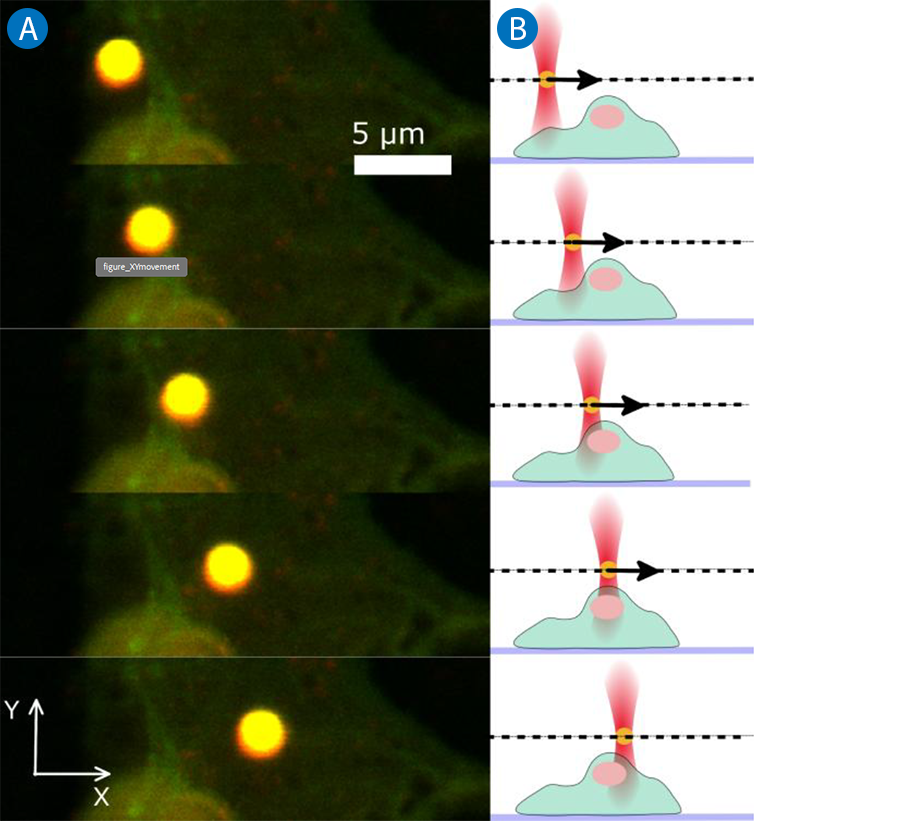
In a situation where the fluorescent sample should not be moved to achieve the highest possible imaging quality and stability, the trap scanner can be used to move the trap (i.e. the trapped particle). Piezo-electric mirrors or acousto-optic deflectors (AODs) allow the precise x/y-positioning of the traps within the field of view.
Additionally, software-controlled motorized lenses can move the trap focus in z without changing the objective position. These methods of beam steering do not affect the confocal scanning process and result in high resolution image time series of the sample under the influence of optical manipulation.
In Figure 4A, five subsequent scans of such a time series are displayed. As shown in the side view schematic in Figure 4B, the laser trap and thus the trapped bead is moved in the x/y-plane while the cell sample remains stationary.
Scanning and positioning options of the NanoTracker™ 2
Sample
Motorized stage:
- coarse positioning of the sample in X/Y
- range: 15x15 mm
- moves sample with respect to objective
X/Y/Z piezo sample scanner
- ultra-precise (~1nm) closed loop positioning of the sample in 3D
- range: up to 100x100x100 µm
- moves sample with respect to objective
Traps
AOD/piezo mirror
- X/Y positioning of the optical trap in the field of view
- moves trap position relative to objective and sample
Z-lens
- Z positioning of the optical trap
- moves trap position relative to objective focus (and sample)
Example 2:
Moving sample, stationary trap
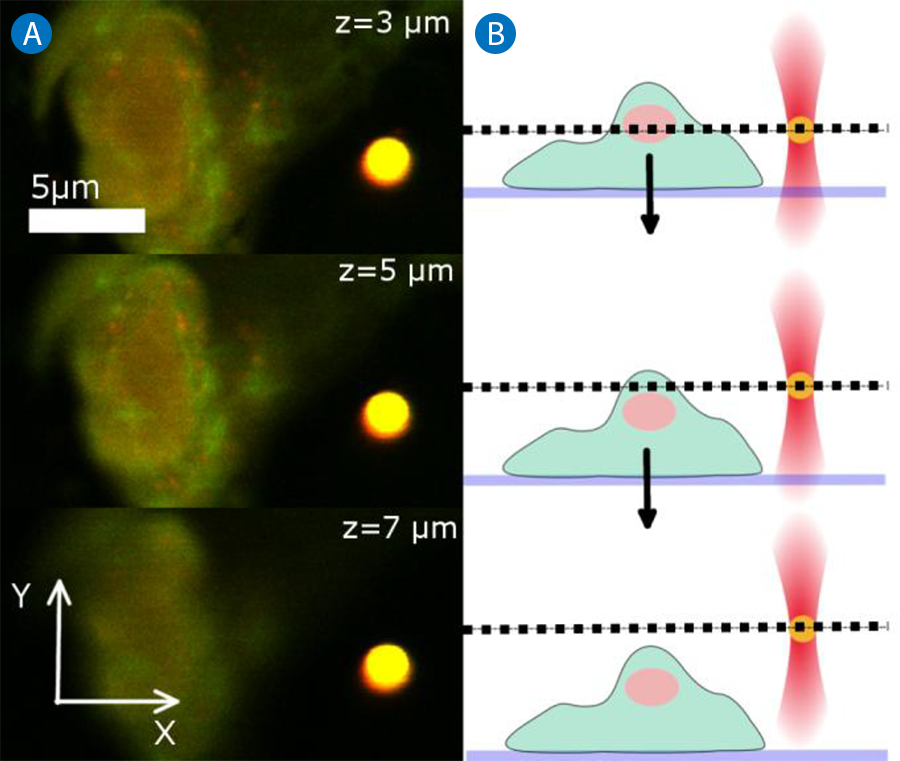
For imaging and manipulation of the sample in different planes perpendicular to the z-axis, the piezo sample scanner can be used. In this case, the trap position relative to the objective remains stable and the sample chamber is moved in the z-direction between subsequent scans. The result is a series of scans at different sample layers, so called slices or sections. Three sections acquired at different Z-positions are displayed in Figure 5A. The respective side view schematic can be found in Figure 5B. It is important to note that in this scanning mode, the trapped particle remains in the focal plane and is always imaged at its central cross-section while the scanning plane in the sample changes.
Force measurements
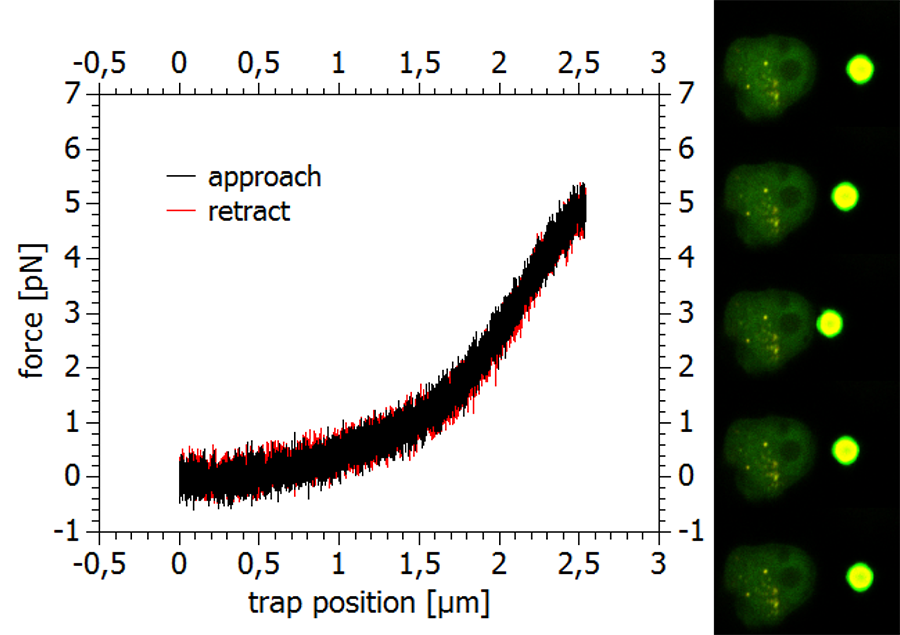
The optical separation of the trapping and scanning laser beams allows recording high-resolution measurements of the trapped particle's position and (with calibrated traps) forces. A typical experimental scheme would be the indentation of a cell with a trapped particle and the recording of a force curve to collect information about the cell's mechanical properties, Since high-resolution confocal imaging requires a stationary sample, these measurements are usually performed with a moveable trap driving the bead probe into the cell surface. The high precision detection unit of the NanoTracker™ 2, featuring fast and sensitive quadrant photo diodes (QPDs) collects positional information of the trapped particle with sampling rates of up to several hundred kHz. Here again, it is vital that the two systems trapping and force measurements on the one side and laser scanning and fluorescence detection on the other side are completely independent. Otherwise, the relatively slow (~one scan per second) rate of the confocal imaging would preclude high-speed force measurements.
A force curve recorded during the indentation of the membrane of a fixed and fluorescently labeled cell is shown in Figure 6, together with some representative confocal scan images taken during the measurement.
Z-stacks
The previously mentioned 3D reconstruction of fluorescent samples is based on stacks of X/Y-scans that are generated by scanning in multiple planes at well-defined Z-positions in the sample. Between two scans, the sample chamber is moved up or down a specified distance (e.g. 200 nm) resulting in equidistant cross-sectional images. These can be subsequently combined using image analysis software (e.g. ImageJ, a public domain, Java-based image processing program developed at the National Institutes of Health) with optional interpolation of the fluorescence signal in between layers for smooth data representation. When Z-stacks are recorded with trapped objects in the imaging volume, two different approaches need to be distinguished.
LEARN MORE:
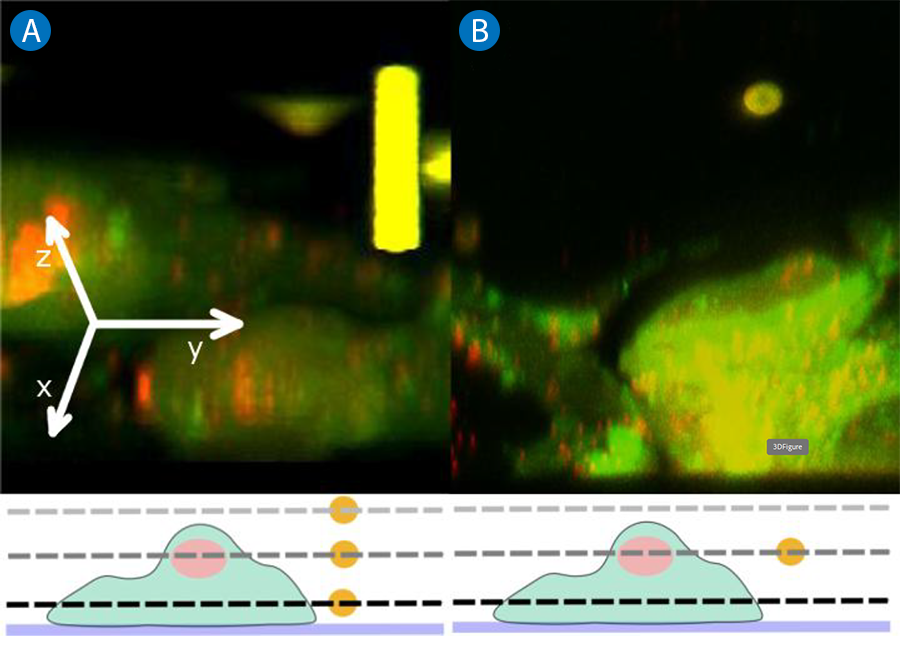
In the first case, only the sample scanner is used and the sample moves relative to the trapped particle (bead). The bead remains in the imaging plane at a fixed distance (focal distance) from the objective. In other words, the imaging and trapping plane coincide for each scan. Schematically, this situation is depicted in the lower panel of Figure 7A. The dashed lines correspond to selected imaging planes of the stack. Since the bead is not moving in Z relative to the objective, it is always imaged at its central cross-section. In the 3D reconstruction shown in the top panel of Figure 7A, it appears as a cylindrical structure composed of multiple spherical cross sections.
If the bead is to be imaged in its true shape (and the bead-sample distance should be maintained), it is necessary to move it in parallel with the sample, relative to the objective. This can be accomplished by means of the motorized Z-lens in the NanoTracker™ 2 laser steering unit. With the respective software controls, it is possible to move the trap focus with the bead exactly the same amount as the sample chamber. As a result, the bead maintains a fixed position with respect to the sample and is scanned at different cross sections. In the 3D reconstruction, it now appears in its real spherical shape (Figure 7B). With this unique feature of the NanoTracker™ 2, the interactions of trapped particles with fluorescent samples can be recorded in 3D while the relative Z-position of bead and sample remain stable. At the same time, force and displacement data of the trapped particle can be recorded in order to establish a comprehensive picture of the ongoing processes.
Conclusion
The sophisticated design and optical layout of the JPK NanoTracker™ 2 allows perfect integration of confocal imaging systems without sacrificing image quality since the coupling in of the trapping laser does not interfere with the confocal excitation and detection pathway. The trapping wavelength of 1064nm is outside the spectral range of common fluorescent dyes and does not cause unwanted fluorophore excitation.
Elaborate beam steering and stabilization mechanisms offer multiple degrees of freedom for the relative positioning of the sample, optical trap, and confocal imaging plane. This enables the NanoTracker ™ 2 users to implement a large variety of possible experimental setups and to perform precise optical sample manipulation and force measurements while capturing the events with state-of-the-art high-resolution confocal microscopy.
References
- E. D. Salmon, R. J. Leslie, W. M. Saxton, M. L. Karow, and J. R. Mcintosh, "Spindle microtubule dynamics in sea urchin embryos: analysis using a fluorescein-labeled tubulin and measurements of fluorescence redistribution after laser photobleaching." J. Cell Biol., vol. 99, no. 6, pp. 2165 - 2174, Jan. 1984.
- D. Zhang, P. Wadsworth, and P. K. Hepler, "Microtubule dynamics in living dividing plant cells: confocal imaging of microinjected fluorescent brain tubulin." Proc. Natl. Acad. Sci., vol. 87, no. 22, pp. 8820 - 8824, Jan. 1990.
- R. DeBiasio, G. R. Bright, L. A. Ernst, A. S. Waggoner, and D. L. Taylor, "Five-parameter fluorescence imaging: wound healing of living Swiss 3T3 cells." J. Cell Biol., vol. 105, no. 4, pp. 1613 - 1622, Jan. 1987.
- T. M. Svitkina, A. B. Verkhovsky, K. M. McQuade, and G. G. Borisy, "Analysis of the Actin-Myosin II System in Fish Epidermal Keratocytes: Mechanism of Cell Body Translocation." J. Cell Biol., vol. 139, no. 2, pp. 397 - 415, Oct. 1997.
- P. I. H. Bastiaens and A. Squire, "Fluorescence lifetime imaging microscopy: spatial resolution of biochemical processes in the cell." Trends Cell Biol., vol. 9, no. 2, pp. 48 - 52, Feb. 1999.
- J. Pawley, Handbook Of Biological Confocal Microscopy. Springer, 2006.