Tech Note: QI mode - Quantitative Imaging with the NanoWizard® 3 AFM
Atomic force microscopy (AFM) is well known as a multipurpose tool for investigating a wide range of different samples with nanometer scale resolution under controlled environmental conditions. AFM technology offers a closer look into the nanometer world and can be used as a force sensor to measure interaction forces and to obtain mechanical properties of different kinds of samples. Nevertheless, the traditional imaging modes demonstrated well known drawbacks for challenging samples that have steep edges, are soft, sticky, or loosely attached to the surface. The most common modes have to deal with undesired forces that might damage or compress the investigated objects. High lateral forces that can be applied in contact mode are able to damage or stretch soft biological objects and loosely attached objects can be moved as a result of these forces.
Bruker has now developed a brand-new mode which works without applying any lateral force at and which allows the user to control the vertical force at each pixel. This offers new perspectives in AFM measuring. In this app note, the benefits and principles of QI mode are detailed and exemplified.
Readers can expect to learn about:
- How the new force curve based QI Advanced mode enables to obtain properties of biological samples such as adhesion, stiffness and dissipation simultaneously;
- Comprehensive application examples showcasing the potential and easy operation of this AFM imaging mode; and
- The powerful capabilities of Bruker's QI mode in combination with dedicated software modules and accessories for the non-destructive investigation of challenging soft biological samples
KEYWORDS: Atomic Force Microscopy; AFM; NanoWizard; Quantitative Imaging; QI; QI Mode; Force Curves; Life Science
Introduction
Atomic Force Microscopy (AFM) is well known as a multipurpose tool for investigating a wide range of different samples with nanometer scale resolution under controlled environmental conditions. AFM technology offers a closer look into the nanometer world and can be used as a force sensor to measure interaction forces and to obtain mechanical properties of different kinds of samples. Nevertheless, the traditional imaging modes demonstrated well known drawbacks for challenging samples that have steep edges, as well as those that are soft, sticky, or loosely attached to the surface 1, 2. The most common modes like contact mode or traditional AC mode have to deal with undesired forces that might damage or compress the investigated objects. High lateral forces that can be applied in contact mode are able to damage or stretch e.g. soft biological objects. Loosely attached objects can be moved as a result of lateral forces. Also, in AC mode it is not possible to control the absolute vertical force, which can lead to compression of soft samples and complications on sticky samples 3.
JPK instruments have now developed a brand new mode which works without applying any lateral force and which allows the user to control the vertical force at each pixel. This offers new perspectives in AFM measuring.
Learn from Bruker's AFM Experts:

QI™: challenging samples, simple imaging
QI™ , the new quantitative imaging mode from JPK, has been developed to make AFM imaging easier than ever before. The user has the full control over the tip-sample force at every pixel of the image. The novel QI™ tip movement algorithm prevents lateral forces and controls vertical forces, which makes nondestructive imaging straightforward. TipSaver™ technology helps untrained users to apply reasonable forces at each pixel, protecting both cantilever tips and fragile samples. QI™ is a force curve based imaging mode, which offers the benefit that there is no need for setpoint or gain adjustment while scanning. Applying JPK's ForceWatch™ technology, QI™ delivers outstanding results in high-resolution mapping on challenging samples. Problems with soft materials (hydrogels or biomolecules), sticky samples (polymers or bacteria), loosely attached samples (nanotubes or virus particles in fluid) or samples with steep edges (powders, MEMS structures) do not occur anymore. QI™ can be used without limitation in sample geometry (e.g. high or flat, soft or hard) in any environment.
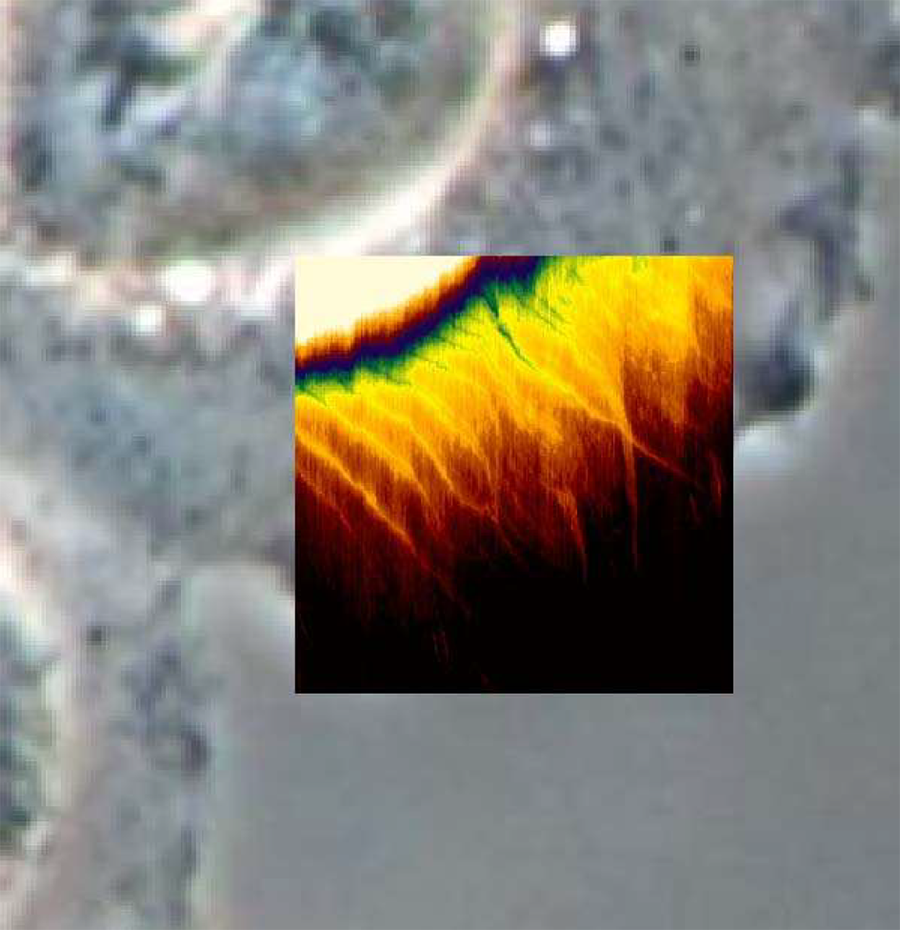
All standard cantilevers can be used and can be freely chosen depending on the sample properties. For measuring very sensitive samples and detecting small interaction forces it is possible to use a cantilever that is soft, with a low spring constant (<0.01 N/m). This can be used to investigate biological samples like living cells (Figure 1) or bacteria. In the opposite situation, cantilevers with a high spring constant (>40 N/m) could be used to measure mechanical properties on hard substrates like glassy polymers or composites.
Imaging can be automated by user programmable patterns for multiple scans at different positions using the JPK ExperimentPlanner™ . This is efficient because the imaging force stability of the new QI™ mode means that the setpoint does not need correcting over longer measurements. The QI™ and Ql ™ -Advanced modes make the NanoWizard® AFM the most versatile instrument for both high-end research and routine use:
- Any kind of samples can be imaged: steep edges, loosely attached, soft, sticky or brittle samples
- Works under ambient conditions or in fluid
- Quick to learn and easy to operate
- No cantilever tuning needed
- No special cantilever holder or shaking mechanism
- No force setpoint adjustment while scanning due to JPK's ForceWatch ™ technology

QI™ Quantitative Imaging- an entire force curve behind every pixel
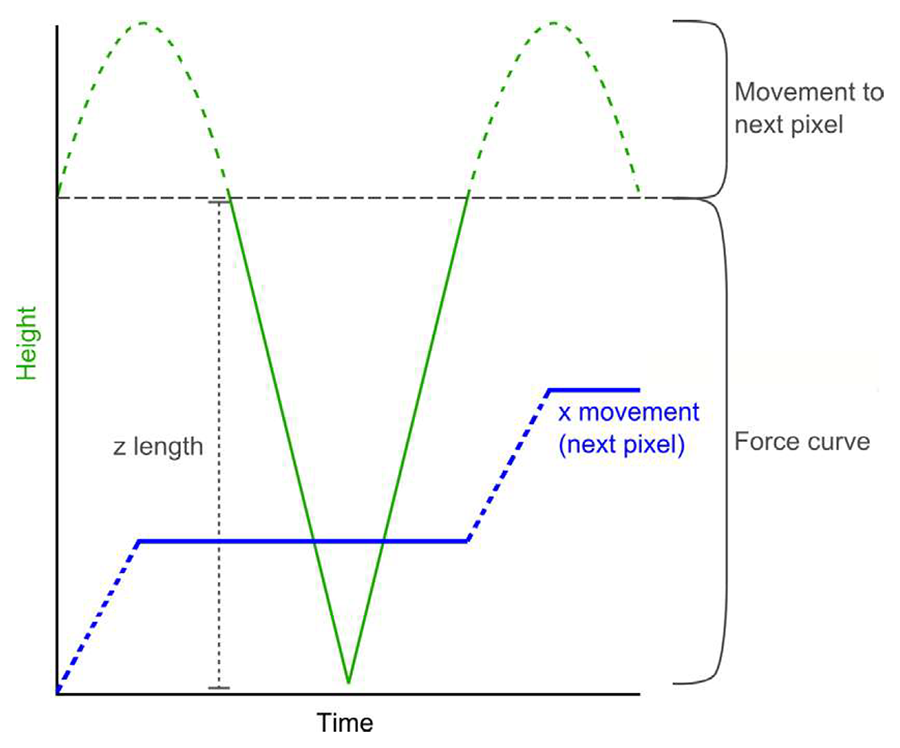
QI™ uses a novel tip movement algorithm that measures a real and complete force-distance curve at every pixel of the image and gives all information about the local tip-sample interaction with high spatial resolution. A simplified representation of the tip movement is shown in Figure 2.
LEARN MORE:
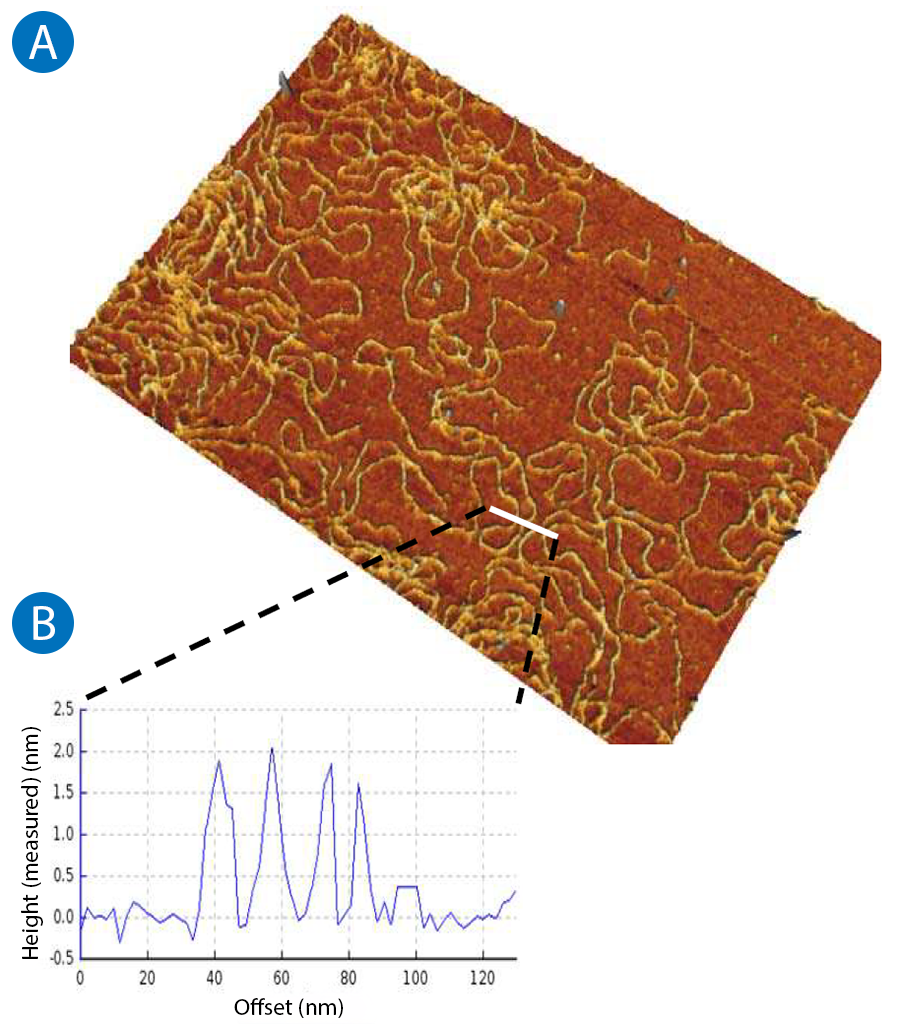
The interaction force can be controlled and minimized down to picometer force scale (< 50 pN). Therefore, it is possible for example to measure lambda phage DNA without compression. The DNA can be measured at the native height of 2 nm in buffer solution (shown in Figure 3).
In QI™ measuring it is also possible to set the separation distance between sample and tip. This offers the possibility for investigations on soft and sticky samples like cells and bacteria without any limitation. In addition to controlling the force-distance curve itself it is also important to control the xy movement during the recording of data for meaningful force distance curves. High-end closed loop control offers a perfect xy positioning at every pixel and makes sure that no continuous xy movement takes place. During a force distance curve there is no xy movement to ensure that the force distance curve was measured under constant velocity. This is especially important for accurate adhesion data, due to the fact that there is a dependence of the measured adhesion value and the velocity during a force distance curve 4. After the set separation length is reached, the tip is moved by a defined motion to the next pixel to prevent ringing. At the beginning of the next force distance curve the xy position is stable again.
Due to the new QI™ movement algorithm it is possible to collect high resolution images and mechanical properties up to 512 x 512 pixels at the same speed as normal imaging, but with the possibility of having much more data and information. The novel cantilever movement from one pixel to the next pixel after the regular force distance curves makes this fast scanning possible. The users have the full freedom of controlling the cantilever movement and are able to adjust it in a simple way to their own needs and sample specifications. This freedom of controlling the cantilever movement is one reason for the extensive variety of different samples that can be measured and investigated with QI™ .
An automatic testing method at the beginning of each image checks the measurement parameters and assists the user. This helps inexperienced users to measure challenging samples without extensive training or knowledge about the sample structures. Multiple forcedistance curves are collected and automatically checked by the SPM software to ensure that appropriate trigger forces and separation lengths are chosen. For measuring under fluid conditions, the hydrodynamic effect can be taken into account by a dynamic baseline adjustment during imaging. The dynamic baseline adjustment and the parameter checking tool offer ease of use and lead to better results in fluids and for challenging samples.
- Minimal, yet precisely controlled vertical force while imaging (<50 pN)
- No lateral forces applied to the sample - no pushing away or moving around of sample features
- No separation distance limit for a force curve, therefore perfect for sticky samples
- Dynamic baseline determination for taking into account hydrodynamic effects in fluid
- Automated parameter checking at the beginning of measuring
QI™- Fastest control electronics for data capture with lowest noise level
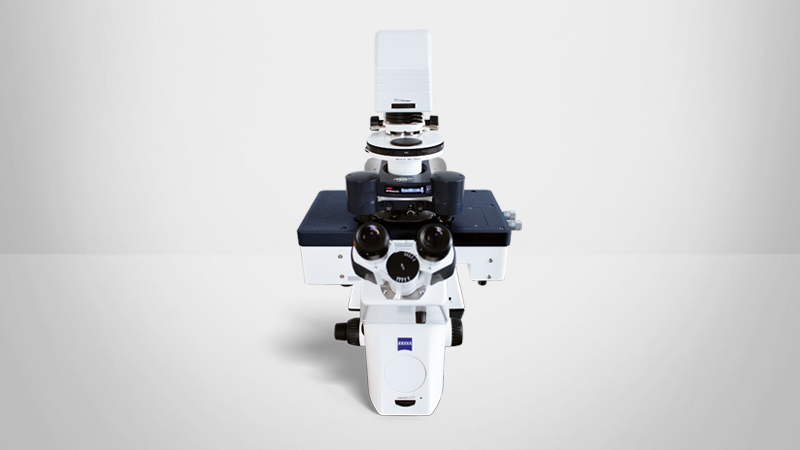
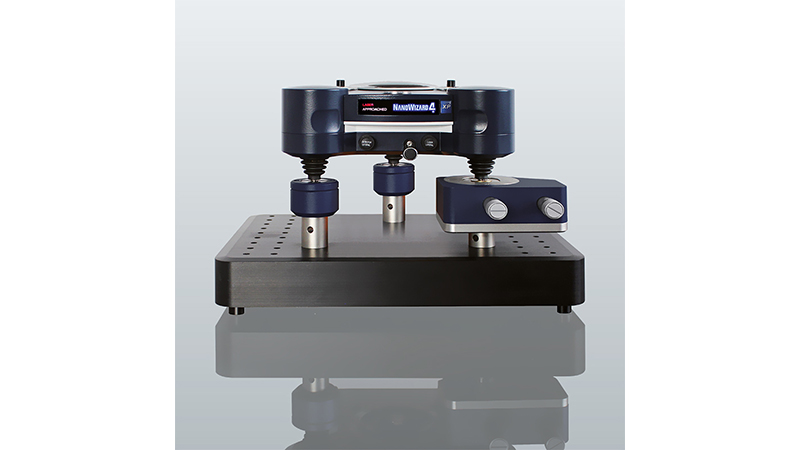
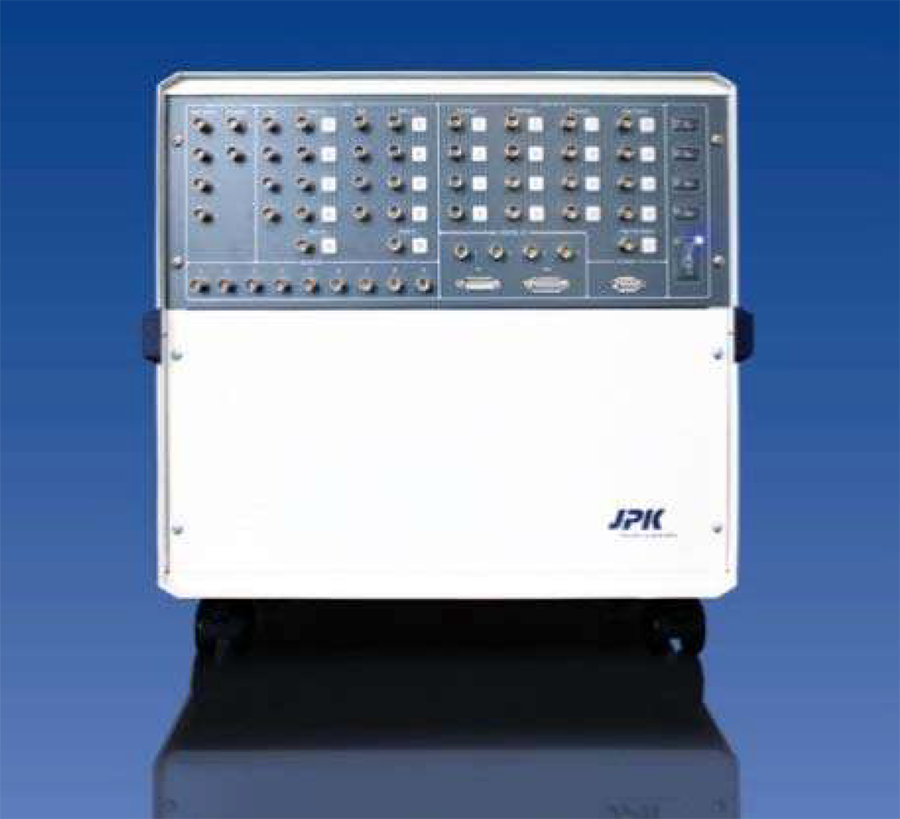
The new QI™ mode uses the full potential of the NanoWizard® 3* AFM family. All the AFM heads of the NanoWizard® 3 series (BioScience, NanoScience, and NanoOptics) come with the lowest possible noise level in the cantilever detection system. This and the optimized closed loop control ensure high data quality in imaging and force spectroscopy.
The NanoWizard® 3 head is driven by the Vertis™ SPM control station. The fully digital controller has the capability for a high data capture rate. It is possible to use sample rates up to 800 kHz which offer new perspectives in the field of fast force-distance measurements. This high speed data acquisition system allows for faster scanning and enables a reasonable number of data points to be collected per force distance curve even for high extend and retract velocities (>50 µm/s).
*The latest generation systems in this product line are the NanoWizard PURE, NanoWizard V BioScience and the NanoWizard 4 XP BioScience.
The Ql™-Advanced option delivers surface properties like adhesion, stiffness, dissi-pation
Besides the standard QI™ mode, the optional Ql ™Advanced software package is also available. This is an extension that enables quantitative measurement of nanoscale material properties such as stiffness, adhesion, and dissipation. Due to the high speed data acquisition system, all force-distance curves can be used for full analysis. In Ql ™ -Advanced a preliminary view of stiffness and adhesion are available online, and all the data from the whole image are saved for post processing with custom settings.
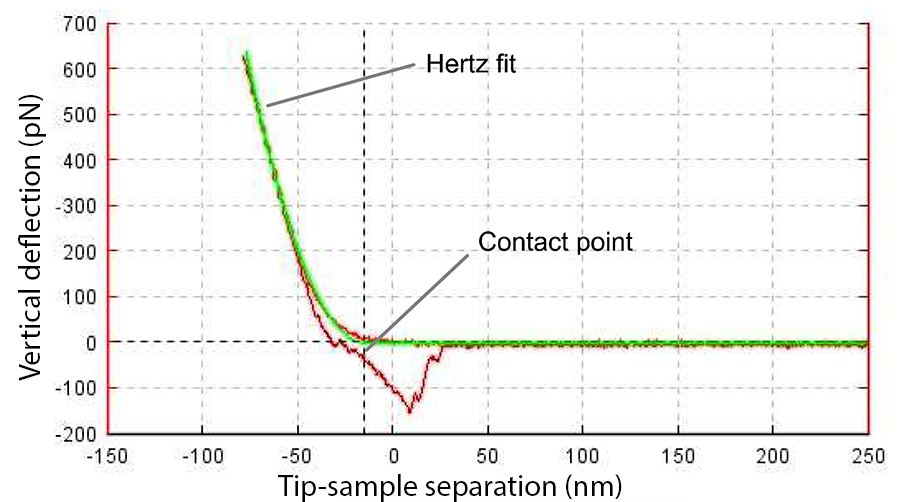
In every image it is possible to save up to 260000 forcedistance curves in a data file. JPK has developed a new file format and improved the automated analyzing options to optimize handling of this huge amount of data. During the measurement it is possible to use the online data analysis. This allows the user to get a first impression about the height at the chosen trigger force, the slope and the adhesion. The schematic view in Figure 5 illustrates which parameters can be extracted during online analysis of an example force-distance curve.
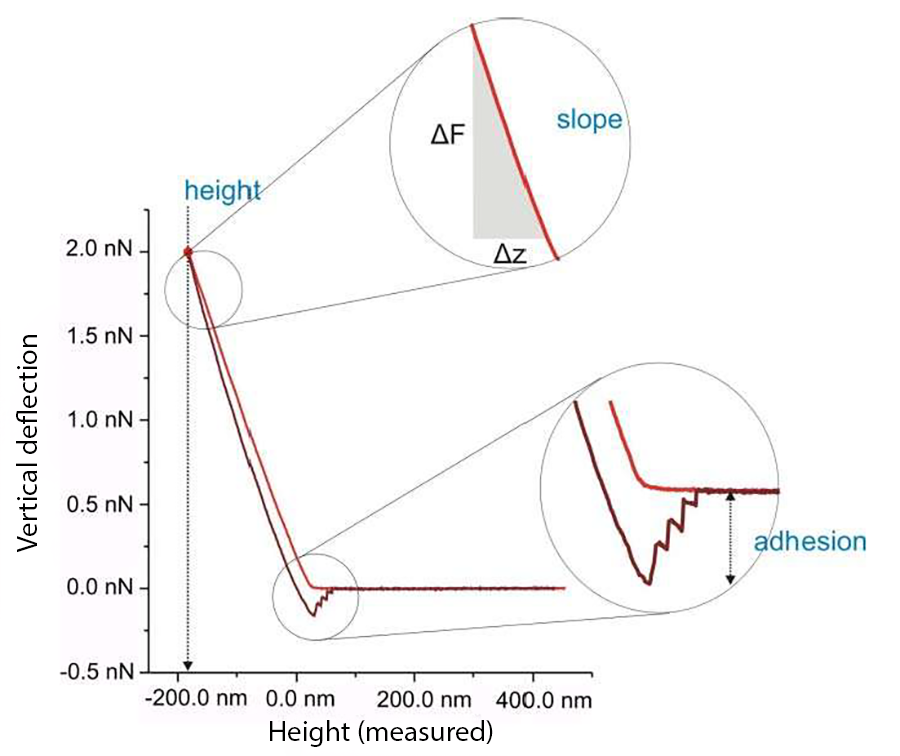
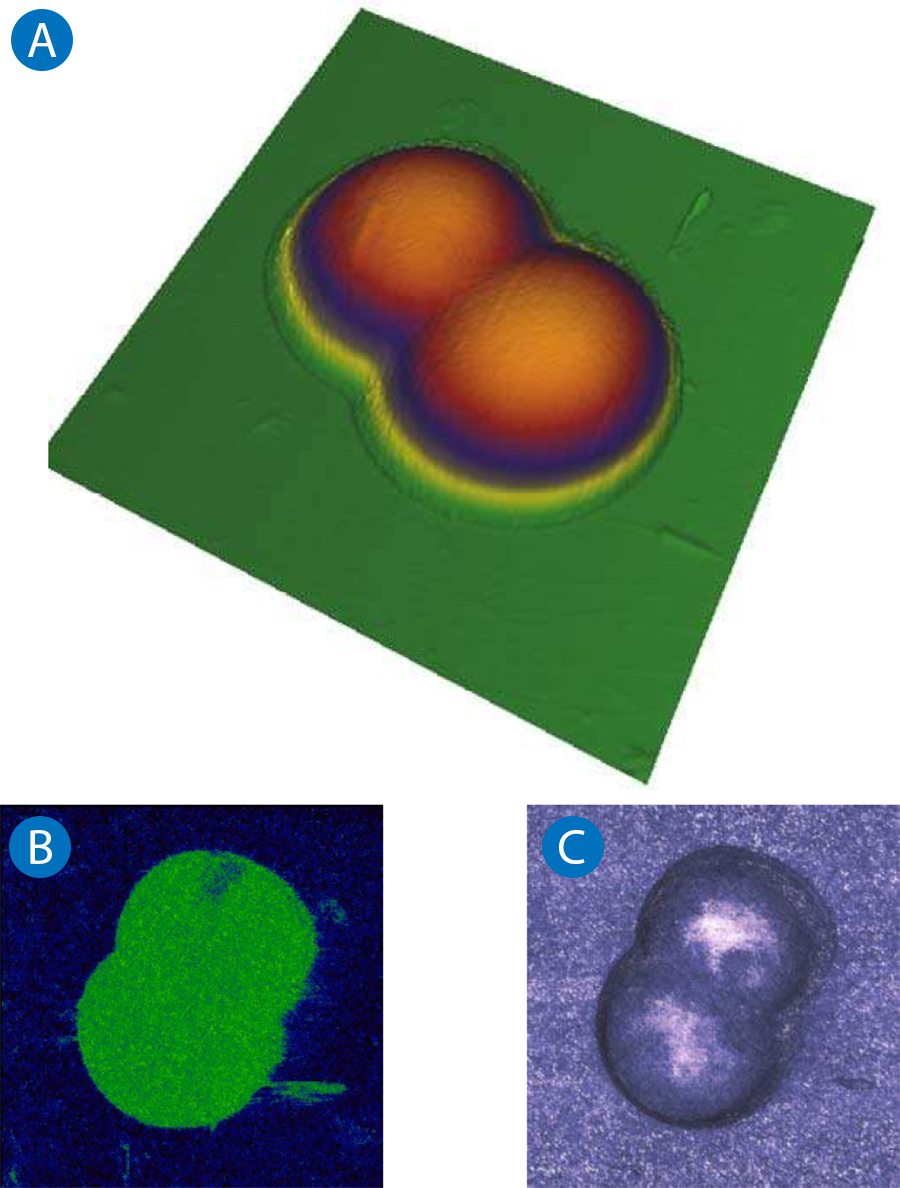
Figure 6 displays measurements of living Cyanobacteria. Besides the height information it is also possible to obtain additional information about the elasticity of the bacteria and about the tip-sample adhesion force. Living bacteria are a well-known sample for AFM investigations. The imaging of living bacteria was always tricky and relied on different surface modification steps to attach bacteria 5. Even with these extra preparation steps, the imaging of living bacteria in contact or AC mode had some drawbacks 6. QI™ offers the ability to precisely control the vertical force and to image the bacteria without any lateral force. Due to the unlimited separation distance and the controlled interaction force it is possible to measure the 4 µm high Cyanobacteria in their native state.
Height
The height information is extracted out of every forcedistance curve, the standard value is the sensor height at the trigger point. The trigger setpoint can be set to very small values to minimize the interaction force between cantilever and sample. In the JPK Data Processing software or with user-defined analysis programs it is possible to calculate height images at zero force (at the contact point) or at specific force values and indentation depths. This can be used to investigate the influence of external forces and for AFM tomography measurements.
LEARN MORE:
Elasticity
The slope image is a first indication for the sample elasticity, generated by making a linear fit to the extend part of the force-distance curve at every image pixel. For absolute values it is necessary to calculate the Young's Modulus from the force-distance curves 7. The most common and widely-used fit for AFM measurements is the Hertz fit 8 (for more information about the Hertz fit see the JPK Application Report: "Determining the elastic modulus of biological samples using atomic force microscopy"). The DMT and JKR Models are well known extensions from the classical Hertz model and based on this model 9. Like the Hertz model, both these models are also only valid under specific assumptions in a defined regime. The DMT model, e.g., takes into accounts the adhesion and is dedicated for stiff samples that show a small adhesion. For softer samples the Hertz model shows advantages.
The fitting equation for the Hertz model is implemented in the JPK Data Processing Software. Here it is possible to automatically fit the contact point and correct the height information from the cantilever bending in order to fit only the response which comes from the sample itself (tipsample-separation ). There are options to set a different indenter geometry as well as controlling the fit parameters for the Hertz fit (either partially constrained fits with fixed contact point for instance, or free fitting of baseline and contact point in addition to Young's modulus) 10. The calculation of the Young's Modulus can be done in a batch process for all force distance curves and the results can be displayed in an image or can be analyzed in a histogram to show the distribution of Young's modulus values.
The batch processing feature allows processing of thousands of force curves quickly and conveniently. Furthermore it is possible to use pre-defined operation routines or create and save new routines. For post processing data analysis also user-written software can be used. This offers more flexibility and there is no limitation in fitting models or fitting routines so that also new models and fits can be tested. Next to the Young's Modulus also the deformation can be calculated in a post processing data analysis.
Adhesion
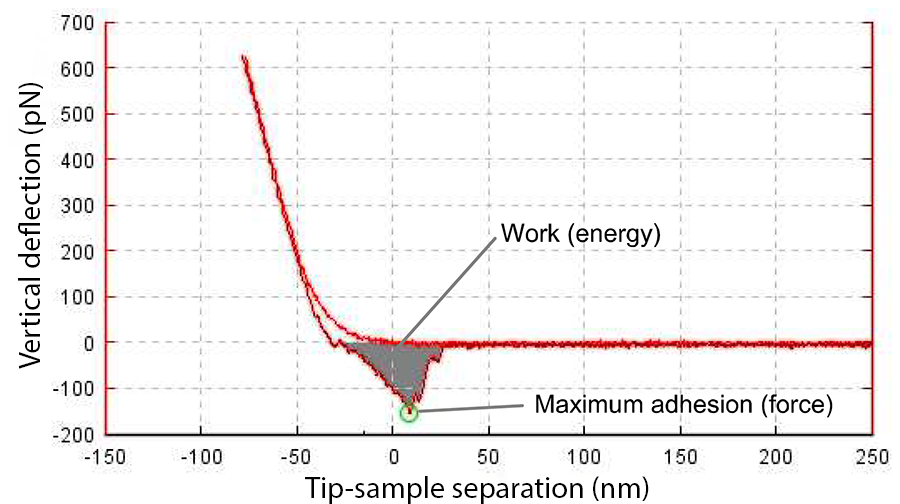
The maximum unbinding force is calculated online during measuring and is displayed in the adhesion image. For this purpose the highest adhesion values is identified out of the retracted part of the force distance curve 11. Later on it is also possible to have a closer look at the single force distance curves to distinguish between specific and unspecific interaction events.
In a batch process it is possible to hone the adhesion fitting routine and define specific parameters like the values for minimum/ maximum expected adhesion force and range of the rupture event position for identifying specific interactions. For meaningful data it is important to record a force distance curve under constant velocity to take into account the dependency between adhesion and retract velocity and to measure accurate adhesion data 4. Furthermore it is possible to calculate the work of adhesion that is needed to separate the cantilever from the surface.
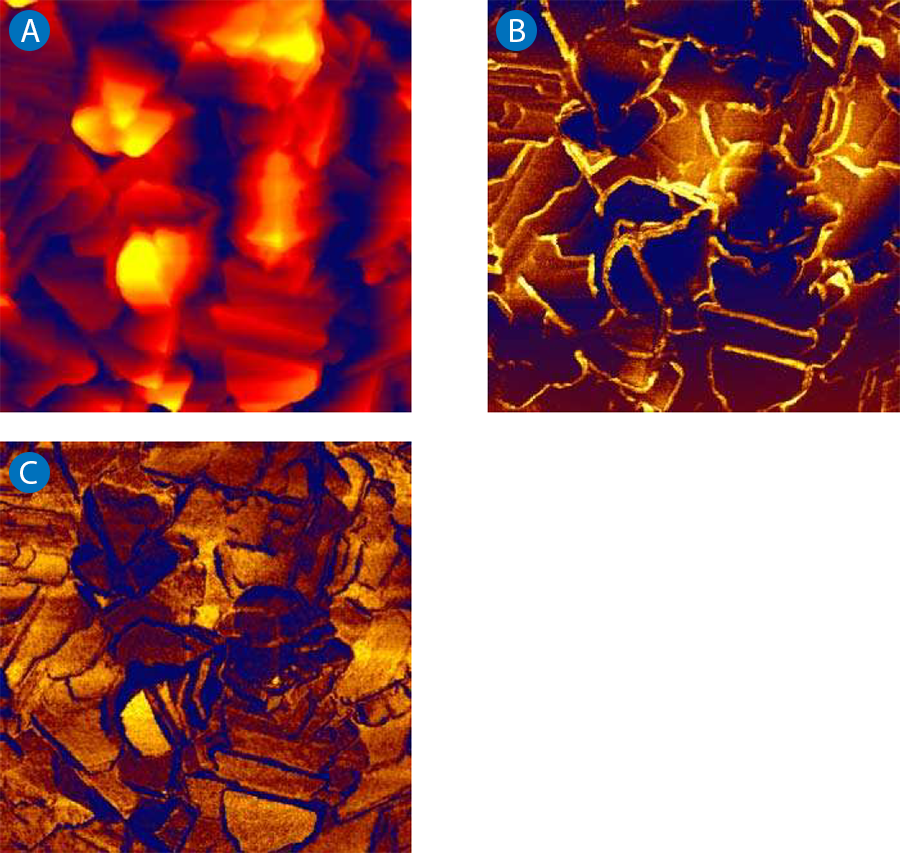
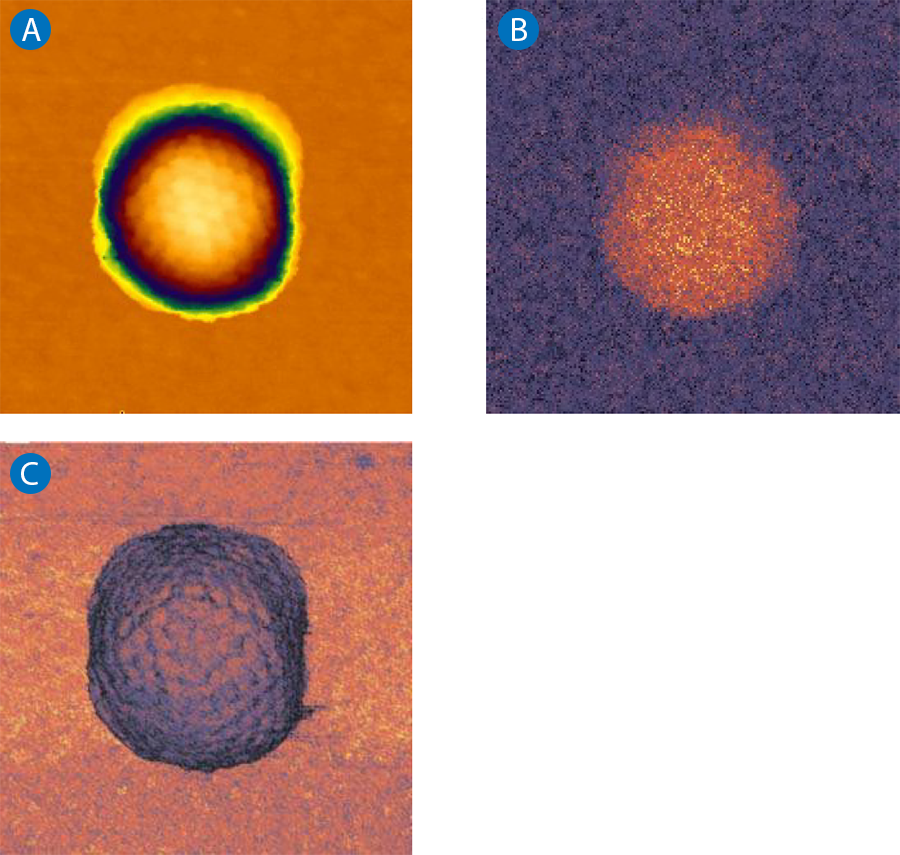
The image examples in Figures 9 and 10 demonstrate the flexibility of the technique to measure very different samples. The Tipcheck sample shown in Figure 9 is imaged in air and has a very rough texture with steep edges. The herpes simplex virus capsid shown in Figure 10 is a fragile structure imaged in buffer. The herpes virus has a diameter of 120 nm and the virus capsid appears rather like a golf ball due to the protein building blocks that can be seen in the height image (Figure 10a) 12. The subunits are also visible in the elasticity image (Figure 10c). This gives more information about the virus itself as well as the elasticity of the single subunits. Structures like virus or microtubules are very fragile and can only be measured with a minimum interaction force, which can be controlled during QI™ measurements 13.
QI ™ Advanced analysis summary:
- Extracting data out of significant and meaningful force curves
- Constant pulling velocity for accurate adhesion data, due to the stable x/y positioning during every force distance curve
- All force curve data are saved, ideal for post processing also with user written software
- Data analysis can be performed either with JPK's DP software or with user-written software for more flexibility, for example with models for adhesion and Young's modulus
- Height image at zero force can be calculated
- High resolution imaging with mechanical properties in a reasonable time
References
- Gadegaard N.: Atomic force microscopy in biology: technology and techniques, Biotechnic & Histochemistry 81:87- 97, 2006
- [2] Braga P.C., Ricci, D.: Atomic Force Microscopy: Biomedical Methods and Applications, Hamana Press Inc., Totowa, 2004
- Kasas, S., Thomson, N. H., Smith, B. L., Hansma, P. K., Miklossy, J., Hansma, H. G.: Biological applications of the AFM: From single molecules to organs, International Journal of Imaging Systems and Technology 8:151-161, 1997
- Butt, H.-J., Capella, B., Kappl, M.: Force measurements with the atomic force microscope: Technique, interpretation and applications, Surface Science Reports 59: 1-152, 2005
- Meyer R.L., Zhou X., Tang L., Arpanaei A., Kingshott P., Besenbacher F.: Immobilisation of living bacteria for AFM imaging under physiological conditions, Ultramicroscopy 110: 1349-1357, 2010
- Bolshakovaa A.V., Kiselyovaa 0.1., Filonova A.S., Frolovab O. Yu., Lyubchenkoc Y.L., Yaminsky I.V.: Comparative studies of bacteria with an atomic force microscopy operating in different modes, Ultramicroscopy 86: 121-128, 2001
- Sweers K., van der Werf K., Bennink M. Subramaniam V.: Nanomechanical properties of a-synuclein amyloid fibrils: a comparative study by nanoindentation, harmonic force microscopy, and Peakforce QNM, Nanoscale Research Letters 6:1-10, 2011
- Hertz H.: Ober die Beruhrung fester elastischer Karper, Journal fur die reine und angewandte Mathematik 92:156-171, 1881
- Carpick R. W., Ogletree D. F., Salmeron M: A General Equation for Fitting Contact Area and Friction vs Loan Measurements, Journal of Colloid and Interface Science 211:395-400, 1999
- Sneddon 1.N.: The relation between load and penetration in the axisymmetric Boussinesq problem for a punch of arbitrary profile, International Journal of Engineering Science 3:47-57, 1965
- Bushan B.: Adhesion and stiction: Mechanisms, measurement techniques, and methods for reduction, J. Vac. Sci. Technol. B 21: 2262-2297, 2003
- Roos W. H., Radtke K., Kniesmeijer E., Geertsema H., Sodeik B., Wuite G. J. L.: Scaffold expulsion and genome packaging trigger stabilization of herpes simplex virus capsids, PNAS106: 9673-9678, 2009
- de Pablo, P. J., Schaap, I. A. T., MacKintosh, F. C., Schmidt C. F.: Deformation and Collapse of Microtubules on the Nanometer Scale, PhysRevLett. 91 : 0981041-0981044, 2003