Emulsions in the Petrochemical Industry
Emulsions play an important role in petrochemical industry. The addition of water can greatly reduce the viscosity of crude oil or Bitumen. However, emulsions have to be stable and creaming should be avoided in order to increase the yield. The right amount and type of emulsifier needs to be determined and formulations need to be optimized for each oilfield. Moreover, the process of demulsification during which oil is recovered from the emulsion can be optimized in order to increase yield and to leave an unpolluted water phase.
Bruker’s versatile and easy-to-use bench-top TD-NMR analyzer is a turn-key solution to measure unimodal droplet size distributions of crude oil emulsions, both, water droplets in oil and oil droplets in water can be measured, irrespective of the color or opacity of the sample.
The minispec instrument obtains signal from the hydrogen atoms present in the entire sample in few minutes. The NMR signal is then analyzed to calculate the restricted diffusion of molecules (oil or water) present inside the droplets, and the software provides the droplet size distribution (DSD), both volume fraction and number fraction, as the final output. Hence, it is a direct measure of DSD at molecular level, and is unaffected by flocculation, unlike optical methods.
Droplets and particles
Distinguishing between droplets and particles would be easy if they looked different, however often droplets and particles in crude oil emulsions appear similar in tests using visual or optical methods. It is especially challenging to distinguish sand and agglomerated droplets by visual methods. TD-NMR will only detect signal from the fluid inside the droplets and solid particles like little rocks or sand are disregarded. Requirements for the measurement of droplet size distributions by the minispec are fairly viscous materials with fairly stationary droplet phase, unimodal distributions and at least 10 % droplet phase.
How does it work?
The Time Domain (TD) NMR method is based on the physical laws of restricted diffusion of oil and water molecules in droplet particles. By means of special gradient sequences, the oil and water signals are discriminated. Thus, the droplets phase can be investigated selectively and a series of gradient experiments is performed under variation of certain pulse sequence parameters. The resulting datasets include the information of the droplet size distribution. Parameters of distribution functions are automatically determined by the software; in this case by the parameters of a log-Gaussian distribution.
Instrument configuration
- Minispec mq series with 25 or 33mm magnet gap
- Broad band transmitter
- Digital RF pulse attenuation
- Minispec pulsed gradient unit (gradients up to 4 T/m).
- 20 MHz Probe Assembly H20-10-25RVGX2 for mq20 (for 25mm magnet gap) or 20 MHz Probe Assembly H20-10-33RVGX2 (for 33mm magnet gap)
- Thermostat bath (230 V/50 Hz), RT to +100 °C for the tempering of the samples (outside the magnet)
- Thermostat bath (230 V/50 Hz), RT to +100 °C for the tempering of the probehead
- Sample preparation aluminium block with condensation avoidance for 20 tubes of 10 mm
- Minispec tube filling tool
- Digital anti-ferromagnetic thermometer
- Minispec ExpSpel experiment editor
- Minispec mq series, oil and water droplet size software
Data analysis and results
Assuming spherical droplets and a unimodal log-Gaussian distribution, Marquardt or Simplex conforming methods are used for the fit of the diffusion decay curve. The resulting volume weighted mean droplet diameter D3.3 and the corresponding standard deviation σ of the Gaussian distribution are automatically mathematically determined. Thus, the full information about the droplet size distribution of the emulsion is presented.
Example data from petrochemical crude oil emulsions
Water droplets in oil
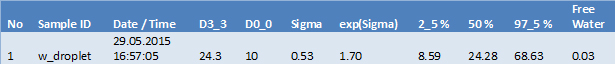
Typical results for water droplets in crude oil are given in Table 1 and the distribution curves are plotted in Figure 1.
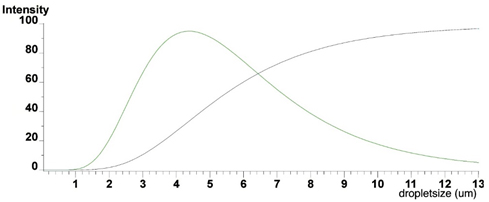
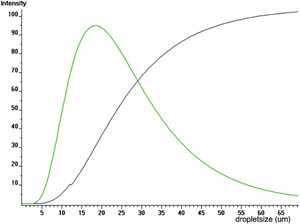
In Figure 1 the droplet diameter d is plotted on the x-axis and the relative frequency of a droplet q(d) with a specific diameter is shown on the y-axis (frequency distribution curve). Integration of frequency distribution leads to the sum distribution Q(d) that gives the fraction of droplets being smaller than or equal to the diameter d.
The values of Q(d) are between 0 for the smallest droplet diameter dmin and 100 for the largest diameter dmax in the above example.
The results from Table 1 for the water droplet distribution in crude oil indicate the following emulsion characteristics:
D3_3: Number distribution. This number indicates that 50 % of droplets have a diameter smaller and larger than 24.3 μm.
D0_0: Volume distribution. This number indicates, that 50 % of the volume is in droplets smaller and larger than 10 μm
The quite different numbers for volume and size distribution are explained by considering the following facts: Small droplets are present in very large numbers, but they do not contribute a lot to the total volume of water. Droplets with high diameters do not occur in a great quantity, but they contain the largest part of the volume.
Here an example: One droplet with d = 10 μm occupies the same volume as thousand droplets with d = 1 μm. Expressed by distribution parameters the geometric mean diameter of number distribution (d50,0) is smaller than that of volume distribution (d50,3).
σ and eσ: σ is related to the gauss distribution of the droplet size distribution. 1*σ right and left from the center represents 84.1 % and 2*σ from the center represents 97.7 % of droplet diameters present in the emulsion. Please note that this is in logarithmic scale. In the example above σ is 0.53 and in normal scale this is e0.53 which is equal to 1.70 μm.
The parameter σ is an important parameter to assess the heterogeneity of the emulsion. As larger sigma as more heterogeneous the droplet sizes (larger spread). eσ is the conversion of the logarithmic σ into normal scale.
The boundaries of the distribution are given in Table 1. In the above example 2.5 %, 50 % and 97.5 % of droplets have a smaller diameter than the values printed in this field. In the example above this would be 8.59 μm, 24.28 μm and 68.63 μm, respectively.
Finally, the free water is plotted. This option is only available in the water droplet application and calculates the ratio of water that diffuses free, i.e. which is not “caught” in droplets.
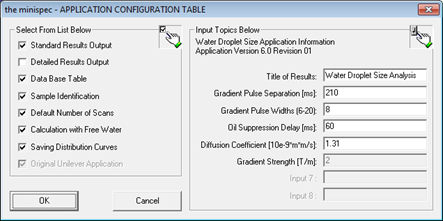
The water droplet application requires oil suppression. For this reason, it is important to determine the T1 relaxation of the pure oil used to prepare the emulsion. This can be measured with a T1 inversion recovery experiment included in the instrument. The time at which the curve crosses zero has to be entered in the respective field of the application configuration table (Oil Suppression Delay).
In the example presented here the oil suppression delay is 60 ms. A typical example is shown below in Figure 2:
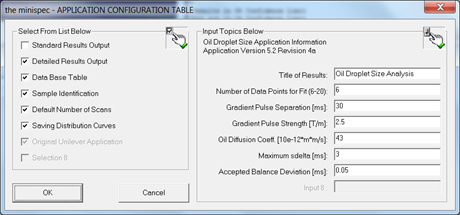
Oil droplets in water
For oil droplets the analysis is the same as for the water droplets, however, without the option to calculate the free fluid. In addition, the oil diffusion coefficient of the crude oil is used to calculate the droplet size distribution. For this purpose an application is included for the measurement of the diffusion coefficient of the pure oil sample.
An example result output for crude oil droplets in water is given in Table 2 and the distribution curves are plotted in Figure 3.
The results from Table 2 for the crude oil droplet distribution in water indicate the following emulsion characteristics:
D3_3: Number distribution. This number indicates that 50 % of droplets have a diameter smaller and larger than 5.36 μm.
D0_0: Volume distribution. This number indicates, that 50 % of the volume is in droplets smaller and larger than 2.9 μm.
σ and es : These parameters describe the Gauss distribution, as already pointed out for water droplets. In the example above s is 0.45 and in normal scale this is e0.53 which is equal to 1.57 μm.
Finally, the boundaries of the distribution are plotted which are 2.22 μm, 5.36 μm and 12.93 μm, respectively, as defined in the section for water droplets.
A typical example for the application configuration table for oil droplets in water applied to emulsions with crude oil is shown below in Figure 4.
When comparing the examples for oil in water and water in oil emulsions it is clear, that both emulsions have a similar distribution in terms of heterogeneity since the values for * are similar. However, the size range for the oil droplets is significantly smaller as compared to the water droplets.
This application can be employed to study emulsion stability over time, creaming and other time dependent processes or simply be used to optimize the amount of emulsifier for emulsification and surfactant for demulsification.