MGA Control Software
Gas Analysis as Easy as can be.
SIMPLE USER-INTERFACE AND FULL CONTROL.
The MGA Control software provides users with all necessary functions and controls to perform highest precision and accuracy gas mixing ratio measurements with MIRO’s MGAs. It offers an easy-to-use touch screen interface that gets new users up and running in no time thanks to a high degree of automation, while experienced users have full insight and control over the spectral fitting of the measured gas absorptions.
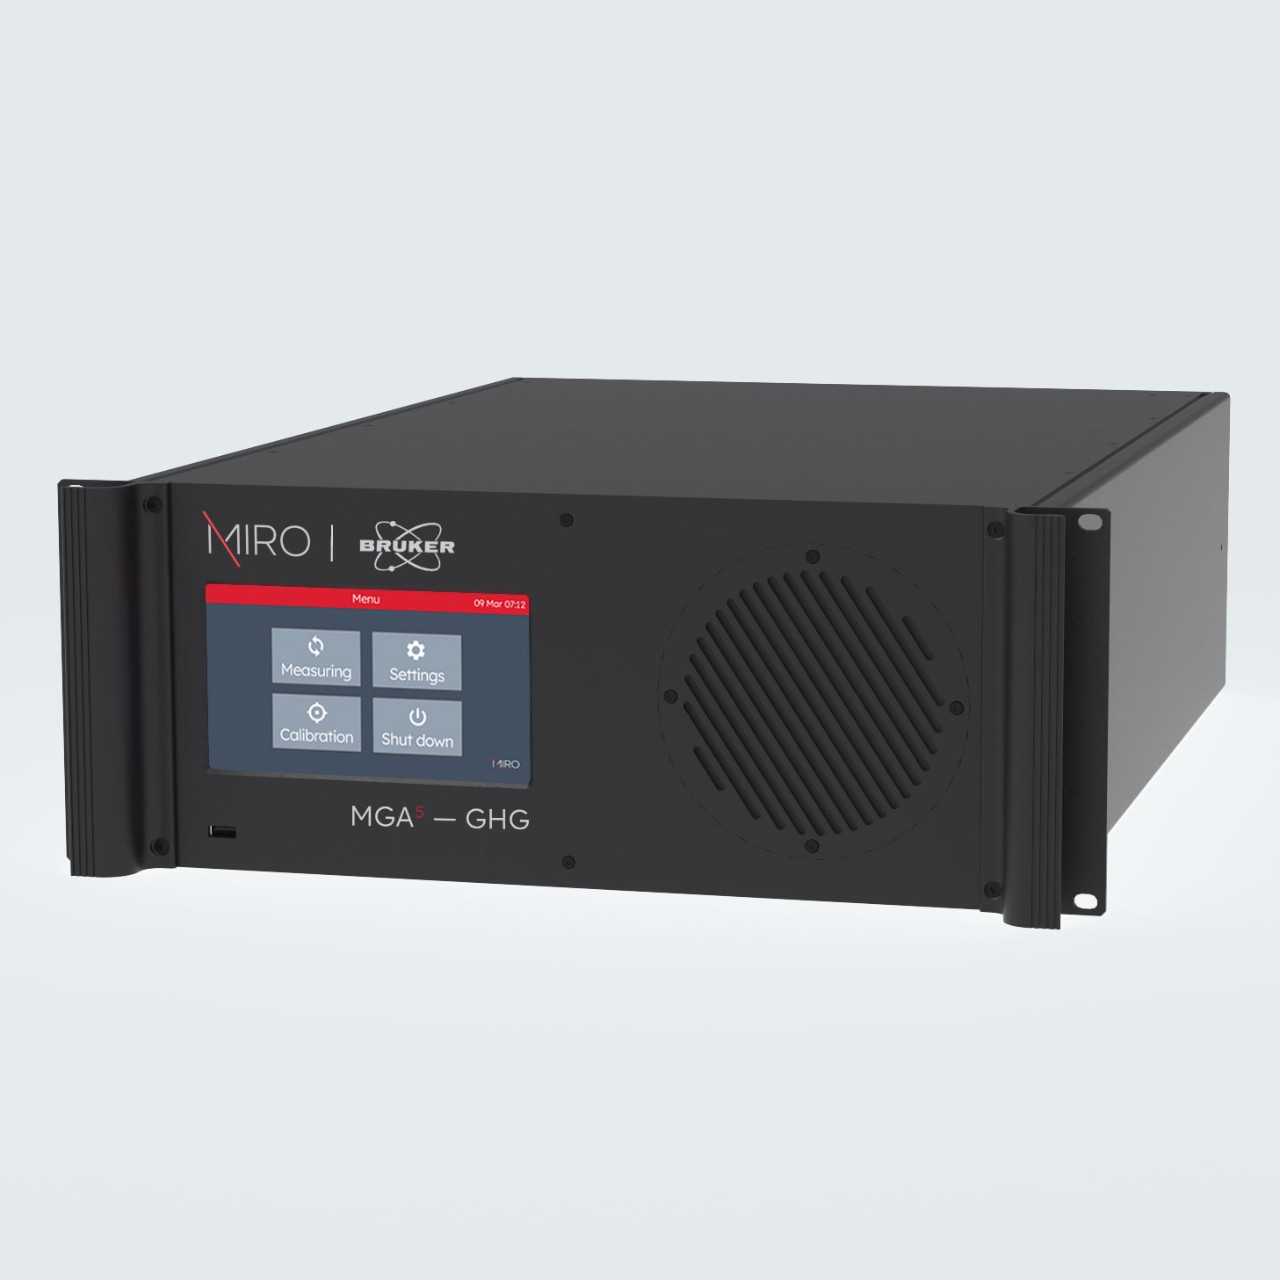
INTUITIVE TOUCH SCREEN.
The touch screen at the front panel of every MGA provides easy access to all important results. Gas mixing ratios of all measured compounds are displayed live or their time-evolution can be visualized on different time scales. Automatic zero-air-correction (offset correction), calibration and a valve-sequencer controlling external sampling valves can easily be setup through the intuitive interface.
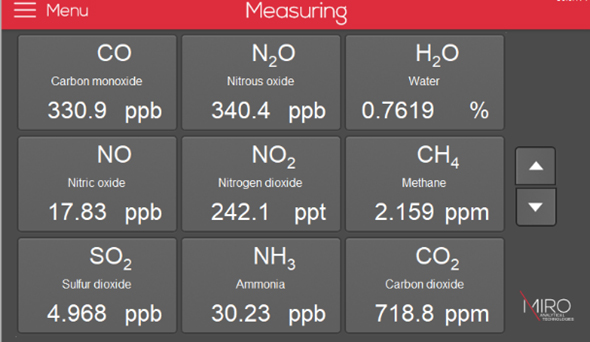
The MGA Control touch screen showing a real-time overview of the measured gas mixing ratios.
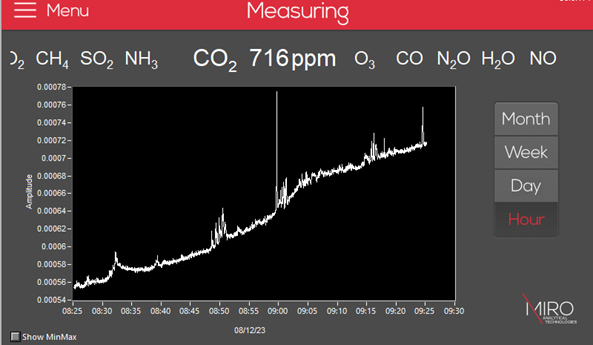
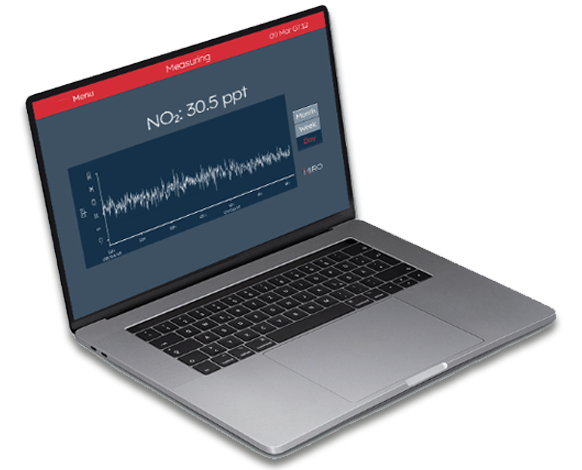
The time evolution of CO2 on a one-hour time scale displayed on the touch screen. The buttons on the right allow to quickly change the time base of the displayed data.
REMOTE ACCESS AND NETWORK INTEGRATION.
There is no need to be next to the instrument as all essential functions of the MGA are controlled by the MGA control software. The instrument can be operated remotely from the distance. Data can be streamed directly into a network or are stored internally.
FULL INSIGHT.
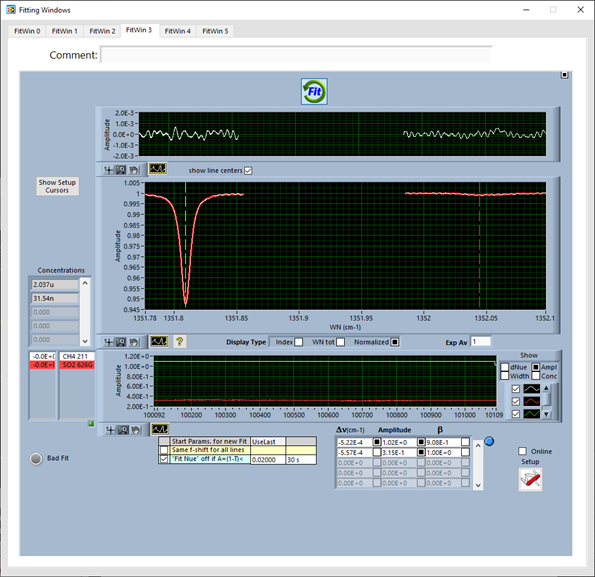
Users can view raw laser spectra, instrument parameters - such as temperatures, pressure, and measurement conditions - and the analytical fitting windows, deriving the gas mixing ratios. In this “white box” approach the user follows the measurement process from data acquisition through processing till the fitting result is obtained.
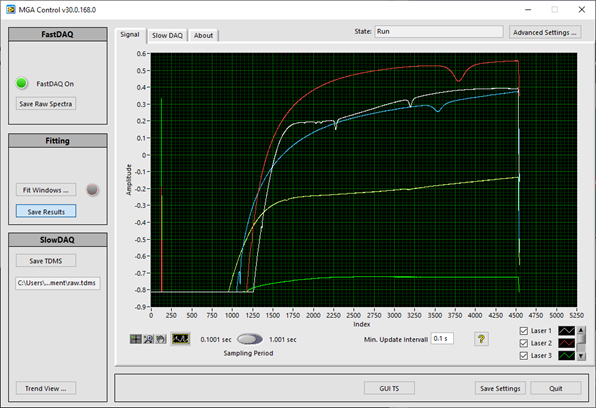
The MGA Control main window shows raw spectral data and instrument parameters and serves as the hub to access additional software functions, such as the spectral fitting.