Tech Note: Microrheological Measurements on Soft Materials with Atomic Force Microscopy
Investigating viscoelastic properties of hydrogels and tissues
A number of studies in recent years have emphasized the importance of viscoelasticity in various research fields, such as materials science and biophysics. Various techniques have been employed to measure the viscoelastic properties of biological and soft matter, including micropipette aspiration, optical stretching, and atomic force microscopy (AFM). Among these techniques, AFM is widely used due to its versatility in measuring materials with different geometries and at different scales.
This technical note presents a summary of microrheological measurements on hydrogels and biological tissues. It briefly details the theory behind evaluating the viscoelastic properties of materials and provides practical steps for calibrating an AFM system before conducting measurements. It describes the process of measuring polyacrylamide hydrogels with varying stiffness and evaluating their viscoelastic properties at different frequencies. The method is applied to assess the spatial variation in viscoelastic properties of a condyle tissue sample from a patient with osteoarthritis.
Readers can expect to learn about:
- Microrheological measurements on hydrogels and biological tissues, providing insights into the viscoelastic properties of these materials;
- The theory behind evaluating viscoelastic properties, along with practical steps for calibrating an AFM system to ensure accurate measurements; and
- A simple-to-apply method for performing and analyzing microrheological measurements on soft materials showcasing the benefits and potential of AFM for measuring viscoelasticity.
KEYWORDS: AFM; NanoWizard; Biomaterial; Hydrogels; Tissues; Viscoelasticity; Microrheology; Life Science;
The viscoelastic properties of materials have been investigated extensively in recent years owing to their relevance in various research fields, such as material science and biophysics. Several techniques have been used to quantify the viscoelastic properties of biological and soft matter, such as micropipette aspiration,1 optical stretching,2 and atomic force microscopy (AFM).3-7 However, AFM is one of the most extensively used techniques in view of its applicability in a wide range of fields and its ability to measure materials of different geometries and at various scales.
AFM can be used to evaluate viscoelastic properties in two ways: either by observing a material’s behavior over a defined period of time, or by probing it at different oscillation frequencies. The latter, generally referred to as a microrheological measurement, is often preferred by users as it is a straightforward analysis method that does not require predefinition and fitting of a mechanical model (such as Kelvin-Voigt, Maxwell, or power law models). However, certain considerations and calibration steps are required prior to performing a microrheological measurement on a sample using AFM.
This technical note provides an overview of the performance of microrheological measurements on hydrogels and biological tissues. The theory of evaluating the viscoelastic properties of materials is briefly outlined and practical steps for calibrating an AFM system prior to conducting measurements are detailed. This is followed by a description of how to measure polyacrylamide hydrogels with different stiffnesses and evaluate their viscoelastic properties at different frequencies. To conclude, the method is applied to evaluate the spatial difference of the viscoelastic properties of a condyle tissue sample from a patient with osteoarthritis.
Complex Modulus Calculations
In an AFM microrheological measurement, the piezoactuator is set to oscillate in a sinusoidal manner at a specific frequency and the deflection signal of the cantilever indentation is recorded. In a perfectly elastic material, the piezoactuator and deflection signals will be in phase, i.e., the phase shift between them is 0°. In a completely viscous material, the signal will be out of phase with a 90° shift. Viscoelastic materials, with both elastic and viscous properties, exhibit a phase shift that can have a value between 0° and 90°.
By observing the phase shifts between the piezoactuator and deflection signals, only a qualitative estimation of the viscoelastic properties is possible. For a quantitative assessment, Mahaffy et al8 used the linearization of the Hertzian contact mechanics model. By assuming that the oscillation amplitudes are small, and after transformation into the frequency domain, an expression for a parabolic indenter can be obtained:

where F(ω) and δ(ω) are, respectively, the periodic force and indentation (calculated by subtracting cantilever deflection from piezo height) signals in the frequency domain, E*(ω) is the complex Young’s modulus, δ0 the mean indentation, ν the value of Poisson’s ratio, R the radius of the indenter, and ω the frequency.
In rheology, it is common to present the viscoelastic properties of a material using the complex shear modulus G*(ω) instead of the complex Young’s modulus. A simple relationship G=E / 2(1+ν) relates the shear and Young’s moduli.9 The following relation is, thus, obtained:

Where G' and G" are the shear storage modulus and shear loss modulus of the material and i is the imaginary unit.
The ratio F(ω) / δ(ω) is then evaluated from the oscillatory signals as follows:

Where AF(ω) and Aδ(ω) are the amplitudes of the force and indentation signals, and φF (ω) and φδ (ω) are the phase shifts of the force and indentation signals, respectively. With Δφ(ω)=φF (ω)-φδ (ω), by combining Equation 2 and Equation 3, the shear storage modulus G'(ω) and shear loss modulus G"(ω) can be calculated as follows:


However, a few considerations need to be taken into account prior to applying the abovementioned analysis. Firstly, the phase lag of the piezoactuator must be evaluated at least once for each AFM device, and secondly, the cantilever drag coefficient must also be measured and corrected for during analysis of the measurements.
Piezoactuator Phase Lag
When evaluating the inherent phase lag of the piezoactuator, the approach described by Alcaraz et al.10 should be followed. In this approach, the deflection of a relatively stiff cantilever in contact with a glass substrate is recorded. Here, a cantilever with a nominal spring constant of 2.8 N/m (TL-FM, Nanosensors) was used and its deflection recorded while the piezoactuator was being modulated with sinusoidal oscillations with an amplitude of 10 nm and in the frequency range of 3 - 500 Hz. The phase shift Φ(ω) was then calculated from the difference between the piezoactuator sinusoidal modulation signal z and the force signal F phases. The piezoactuator phase lag for the system used showed a linear relation with frequency ., as determined by the least square fit Φ(ω) = -0.026ω +0.337. This phase lag was used in the hydrogel measurements throughout the report.
To further evaluate the influence of the controller on the phase lag of the piezoactuator, we compared a second identical NanoWizard 4 AFM system with state-of-the-art controller generation (Vortis 2.1). It was found that the piezoactuator phase lag was lower by more than an order of magnitude in the latest generation controller, which, in practice has negligible contribution to the microrheological measurement. The significant reduction in piezoactuator phase lag for the system equipped with a latest generation controller is attributed to faster z-sensor controller electronics.
Cantilever Drag Coefficient
Next, the hydrodynamic drag coefficient of the cantilever used for the measurement is evaluated. To do so, a PNP-TR-TL (Nanoworld) cantilever with a length of 200 µm and a nominal cantilever spring constant of 0.08N/m was used. The deflection and height signals of the cantilever while immersed in liquid was recorded at different frequencies (3 - 300 Hz) and over different distances (1- 7 µm) from the substrate. The hydrodynamic transfer function Hd(ƒ) in that case is detailed in Alcaraz et al.10, and given as

where

and k is the spring constant of the cantilever. Hd(ƒ) was evaluated at every frequency at different distances, and the real H'd(ƒ) and imaginary H''d(ƒ) components were plotted, as shown in Figure 1.
The hydrodynamic drag transfer function is related to the cantilever’s hydrodynamic drag coefficient b(h) as follows:

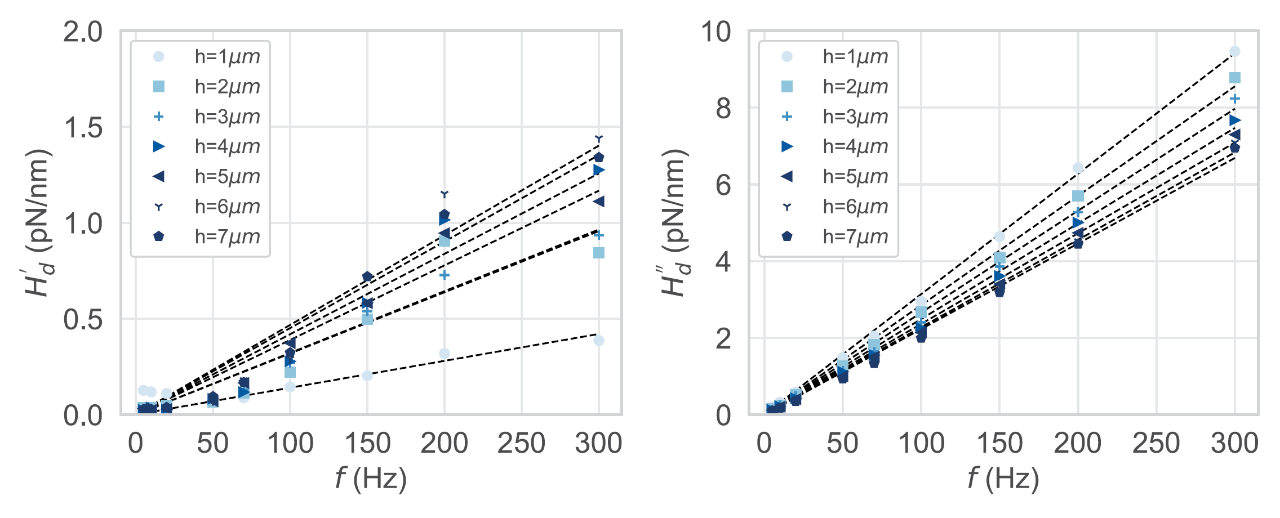
As expected, in Figure 1, the real component H'd(ƒ) of the transfer function is negligible compared to the imaginary component H''d(ƒ). In addition, b(h) is extrapolated from the fitted slope of H''d(ƒ) for every distance h.
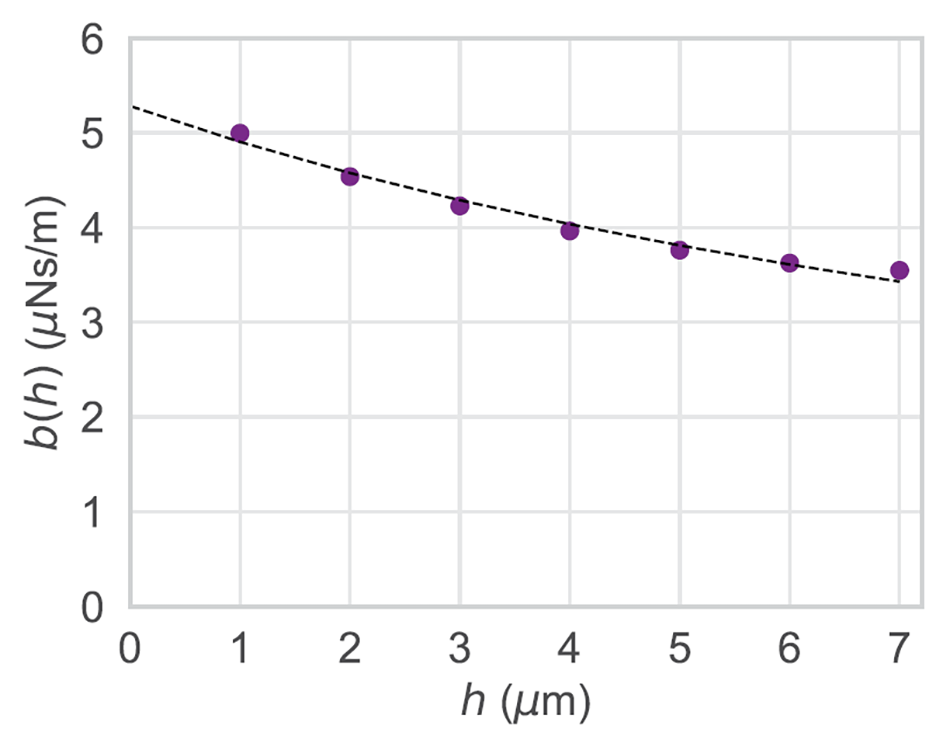
The hydrodynamic drag coefficient at distance zero b(0) is then calculated by extrapolating the scaled spherical model of the cantilever to h=0:

Where η is the viscosity of the medium, αeff is the effective radius, and h+heff the effective separation of the cantilever. To simplify the fit, 6πηα²eff and heff were defined as two fitting parameters, and the function ƒ(x) was fitted to the data points as shown in Figure 2:

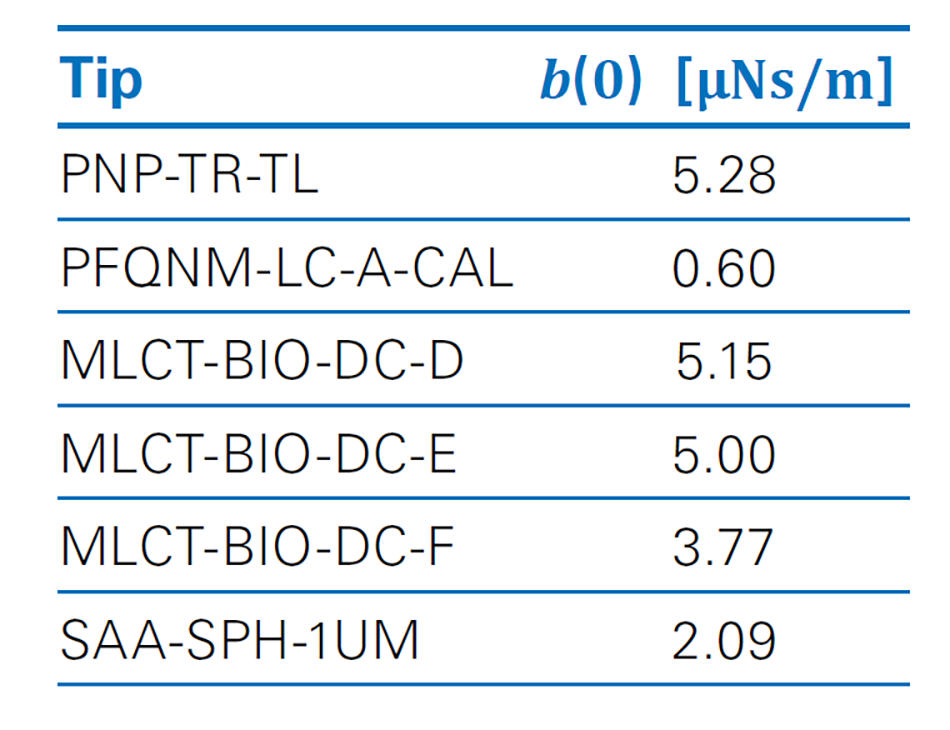
The value of the function at h=0 is b(0)=5.28 (µNs)/m and this drag coefficient characterizes the specific PNPTR- TL cantilever that we used for the measurements in this report. For practicality reasons, the drag coefficients of several other cantilevers were also determined and are shown here in Table 1.
After applying both corrections to the analysis of the signals measured, Equation 2 for evaluation of the complex shear modulus G*(ω) of a material indented with a spherical indenter can be rewritten as follows:

where

With Δφ(ω) = φF(ω) - φδ(ω) - Φ(ω), the shear storage modulus G'(ω) and shear loss modulus G''(ω) can be calculated as:


Polyacrylamide Measurements
Microrheology Measurements Using AFM
The microrheology method was tested on two polyacrylamide (PAAm) hydrogels with different stiffness and prepared as described previously.12 Firstly, glass coverslips (ø 13 mm, Marienfeld) were cleaned with 1N NaOH for 30 min, and then washed with double-distilled water (ddH2O), 100 % ethanol, and ddH2O, respectively. After drying, the coverslips were soaked for 30 min in a solution of chloroform (Sigma-Aldrich) containing 0.1% (v/v) triethylamine (Sigma-Aldrich) and 0.1% (v/v) allyltrichlorosilane (Sigma-Aldrich), and then washed with ddH2O again. Finally, the coverslips were soaked for another 30 min in 0.5% glutaraldehyde and then rinsed with ddH2O.

To prepare PAAm hydrogels with different stiffness, acrylamide (Sigma-Aldrich), N,N’- Methylenebisacrylamide (bis-acrylamide) (Sigma-Aldrich) and N,N,N’,N’- Tetramethylethylenediamine (TEMED) were first mixed in PBS, as shown in Table 2, to create a stock solution. From the stock solution, 100 µl was mixed with 1 µl of 10% ammonium persulphate (Sigma-Aldrich) and mixed with a pipette. Quickly, before polymerization, 35 µl droplets were added onto an ethanol-cleaned foil and sandwiched between the previously activated glass slides. After 30 min at room temperature, the glass slides with the polymerized gels were carefully detached from the foil, washed, and kept in PBS for at least 24 hours before the measurement.
AFM microrheology experiments on the hydrogels were conducted using a Bruker NanoWizard 4 AFM. The PNP-TR-TL cantilever characterized for the hydrodynamic drag coefficient was used for the preparation of a colloidal force probe with a 5 µm polystyrene bead (microParticles GmbH, Berlin). The cantilever spring constants were measured prior to each experiment using the thermal noise method implemented in the Bruker SPM software.
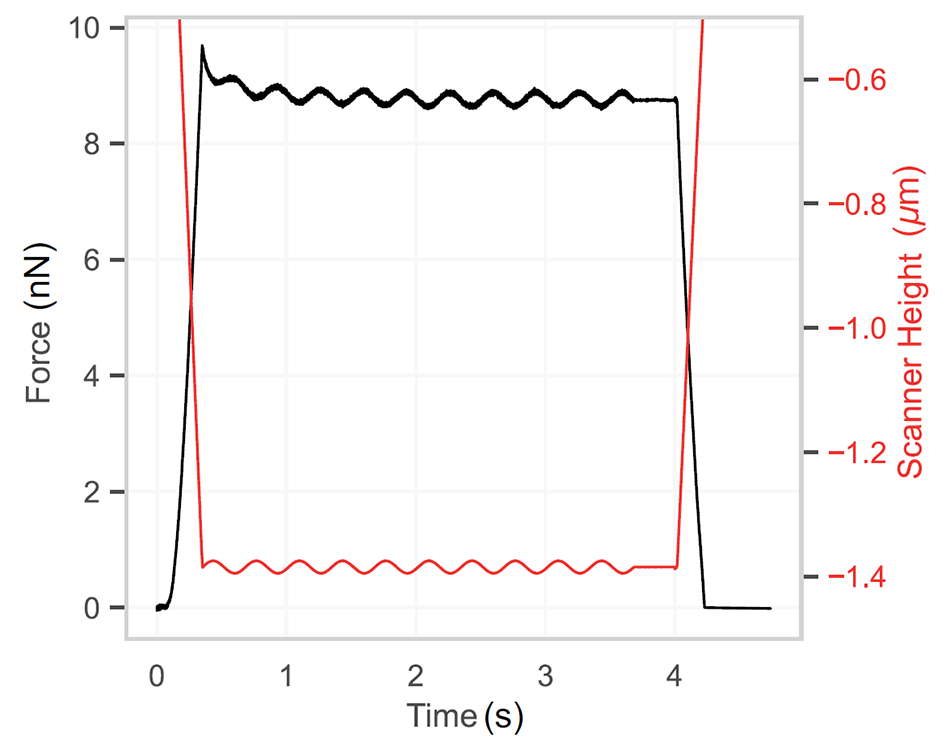
To measure the hydrogel, the cantilever was lowered at a speed of 10 µm/s to an approximate indentation depth δ0 of 1.3 µm and then oscillated by a sinusoidal motion of the piezo elements with an amplitude of 10 nm for a period of ten cycles. A graphical sketch of the experiment, depicting the scanner positions and vertical deflection readout, is shown in Figure 3. The procedure was repeated at different oscillation frequencies in the range of 3 - 300 Hz. Each gel was measured in three different areas (40µm×40 µm) with a 2×2 grid for each area.
Analysis and Results
Batch analysis was performed using the native Bruker data processing software. Each force file contains the oscillation signals of one frequency. After applying the baseline correction, contact point estimate, and the evaluation of the vertical tip position, the force and indentation signals were fitted with a sinusoidal fit and the amplitude and phase shift of each then extracted. The ratio of the force and indentation signals in the frequency domain F(ω) / δ(ω) was calculated using Equation 12. The shear storage modulus and shear loss modulus were then evaluated for each frequency using Equation 13 and Equation 14, respectively.
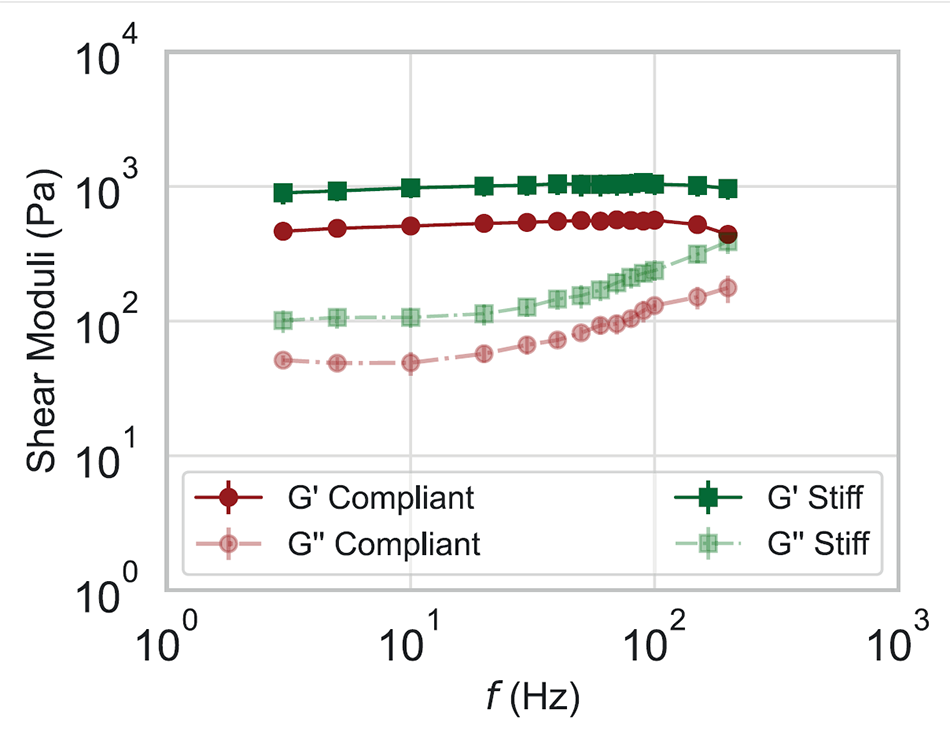
The results of the complex shear modulus are plotted in Figure 4, where the dark shades depict the storage modulus G' and the light shades the loss modulus G". The green square symbols describe the moduli of the stiff hydrogel, and the red circles depict the moduli of the compliant hydrogel. The storage modulus G' is considerably higher than G" and is generally stable in the range of the frequencies measured. The loss modulus G", however, increases with frequency.
This behavior is typical for hydrogels and correlates very well with the rheometer results of the hydrogels prepared with the same concentrations as in Moshayedi et al.11
Early Osteoarthritic Knee Articular Cartilage
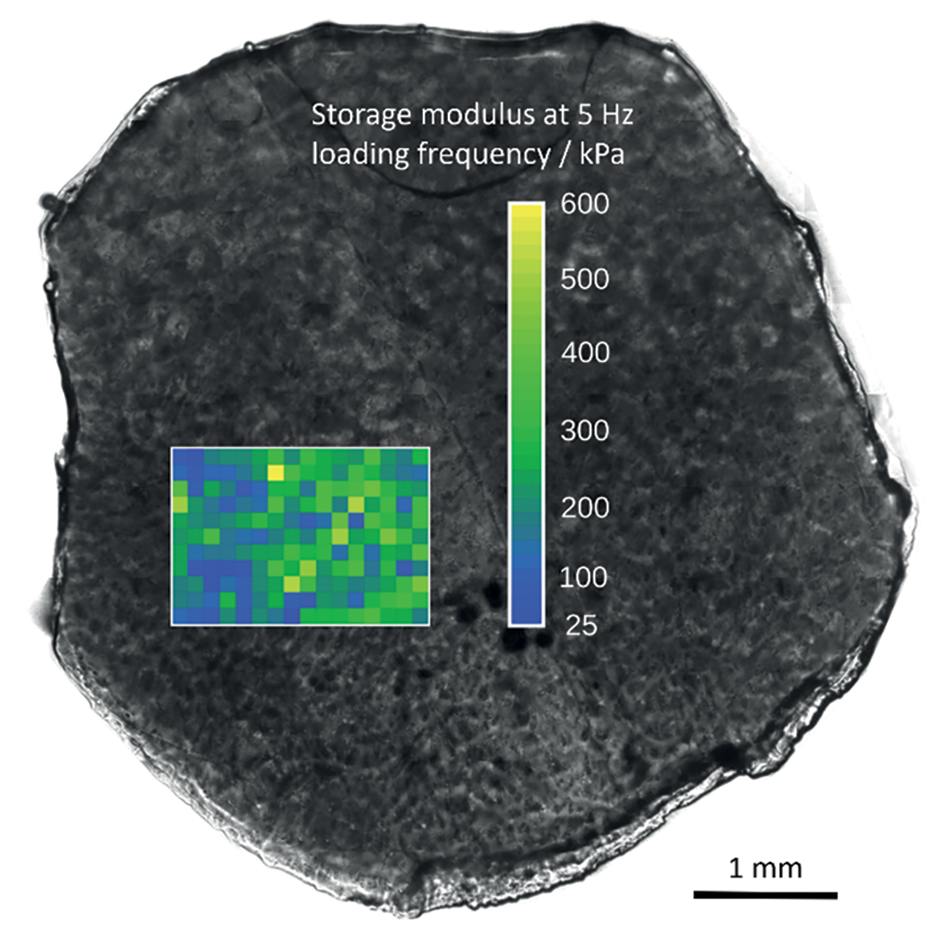
This example demonstrates the potential of the method to evaluate the spatial distribution of viscoelastic properties over a large area of a sample at a specific frequency. A native surface section of an early osteoarthritic articular cartilage from human femoral condyle, provided courtesy of a collaborator, was prepared as described in Tschaikowsky et al.13 Femoral condyle was obtained with the approval of the research ethics committee in Freiburg, Germany (418-19) and the informed consent of the patient. An area of 1.1mm×1.6mm was measured with force mapping using a modulation amplitude of 10 nm and a modulation frequency of 5 Hz. Storage and loss modulus were calculated following the procedure described above.
Every pixel of the heatmap corresponds to 16 juxtaposed symmetrically spaced force curves that were averaged for statistical and representative purposes. Figure 5 depicts a spatial correlation of the storage modulus results with an optical phase contrast image of the articular cartilage.
Conclusions
This technological report outlines how to perform AFM microrheology measurements on soft materials. While the theory is well defined, a simple-to-apply method was not available until now. This technical note presented a protocol for performing simple microrheological measurements and reliable analysis of the viscoelastic properties of the material under investigation. A comparison of the AFM and rheometer methods used to characterize the viscoelastic properties of hydrogels demonstrates that the same mechanical behavior can be explored by both techniques, however, AFM microrheological measurements expand not only the frequency range but also the length scale of materials under investigation.
Acknowledgements
We would like to thank Mathäus Tschaikowsky, Bizan N. Balzer, Thorsten Hugel (University of Freiburg, Germany) and Bernd Rolauffs (G.E.R.N. Research Center, Freiburg, Germany) for kindly providing the femoral condyle articular cartilage samples and their contribution towards the data acquisition and analysis. Further information on the methods, samples, and approval by the local research ethics committee (#418/19) can be found in Tschaikowsky et al.13 The authors would also like to thank Tanja Neumann for the measurements on the condyle samples, and Torsten Müller and Dimitar Stamov (JPK BioAFM, Bruker Nano GmbH) for the discussions and critical reviews during the preparation of this technical note.
Authors
- Shada Abuhattum (Max Planck Institute for the Science of Light, Erlangen, Germany)
- André Körnig (JPK BioAFM, Bruker Nano GmbH, Berlin, Germany)
References
- Hochmuth RM (2000), Micropipette aspiration of living cells, J Biomech 33 (1), 15–22.
- Guck J, Ananthakrishnan R, Moon TJ, Cunningham CC, Käs J (2000), Optical Deformability of Soft Biological Dielectrics, Phys Rev Lett 84 (23), 5451–5454.
- Alcaraz J, Buscemi L, Grabulosa M, Trepat X, Fabry B, Farré R, Navajas D (2003), Microrheology of Human Lung Epithelial Cells Measured by Atomic Force Microscopy, Biophys J 84 (3), 2071–2079.
- Rebelo LM, de Sousa JS, Mendes Filho J, Radmacher M (2013) Comparison of the viscoelastic properties of cells from different kidney cancer phenotypes measured with atomic force microscopy, Nanotechnology 24 (5), 055102.
- Brückner BR, Nöding H, Janshoff A (2017), Viscoelastic Properties of Confluent MDCK II Cells Obtained from Force Cycle Experiments, Biophys J 112 (4), 724–735.
- Efremov YuM, Dokrunova AA, Bagrov DV, Kudryashova KS, Sokolova OS, Shaitan KV (2013) The effects of confluency on cell mechanical properties, J Biomech 46 (6), 1081–1087.
- Rother J, Nöding H, Mey I, Janshoff A (2014), Atomic force microscopy-based microrheology reveals significant differences in the viscoelastic response between malign and benign cell lines, Open Biol 4 (5), 140046.
- Mahaffy RE, Shih CK, MacKintosh FC, Käs J (2000), Scanning Probe-Based Frequency- Dependent Microrheology of Polymer Gels and Biological Cells, Phys Rev Lett 85 (4), 880–883.
- Landau LD, Lifshitz EM, Sykes JB, Reid WH, Dill EH (1960) Theory of Elasticity: Vol. 7 of Course of Theoretical Physics, Phys Today 13 (7), 44–46.
- Alcaraz J, Buscemi L, Puig-de-Morales M, Colchero J, Baró A, Navajas D (2002) Correction of Microrheological Measurements of Soft Samples with Atomic Force Microscopy for the Hydrodynamic Drag on the Cantilever, Langmuir 18 (3), 716–721.
- Moshayedi P, da F Costa L, Christ A, Lacour SP, Fawcett J, Guck J, Franze K (2010) Mechanosensitivity of astrocytes on optimized polyacrylamide gels analyzed by quantitative morphometry, J Phys Condens Matter 22 (19), 194114.
- Escolano JC, Taubenberger AV, Abuhattum S, Schweitzer C, Farrukh A, Del Campo A, Bryant CE, Guck J (2021), Compliant Substrates Enhance Macrophage Cytokine Release and NLRP3 Inflammasome Formation During Their Pro-Inflammatory Response, Front Cell Dev Biol 9, 639815.
- Tschaikowsky M, Neumann T, Brander S, Haschke H, Rolauffs B, Balzer BN, Hugel T (2021) Hybrid fluorescence-AFM explores articular surface degeneration in early osteoarthritis across length scales, Acta Biomater 126, 315–325.
©2023 Bruker Corporation/Bruker Nano GmbH. NanoWizard is trademark of Bruker Nano GmbH. All other trademarks are the property of their respective companies. All rights reserved. TN301 Rev. A0.