Application Note: The Novel JPK CryoStage for Versatile Temperature Control for -120°C to 220°C
Discover Convenient, Versatile Temperature Control Tools
The CryoStage is a novel sample stage designed to facilitate both very high and very low temperature AFM imaging. This technology, combined with our leading-edge BioAFM instruments, extends the temperature range for AFM experiments to + 220C to -120C in a water-free environment and allow surface observation at high imaging speeds.
Readers can expect to learn about:
- The capabilities and novel experimental potential of the CryoStage;
- The impact of using the CryoStage on material property measurements, including Young's Modulus, and phase imaging outcomes; and
- Measuring melting point and glass transition, and the change in chain mobility, of thin polymer film samples.
KEYWORDS: Block Copolymer; Phase Imaging; Phase Transitions; Polycaprolactone (PCL) Film; Young's Modulus

Introduction
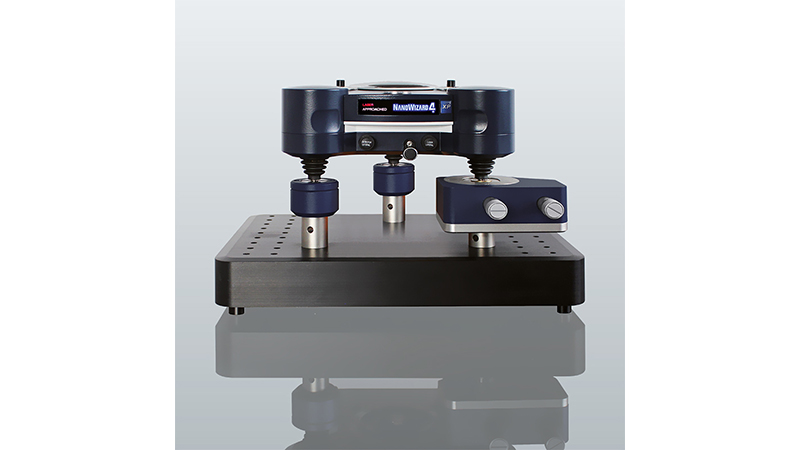
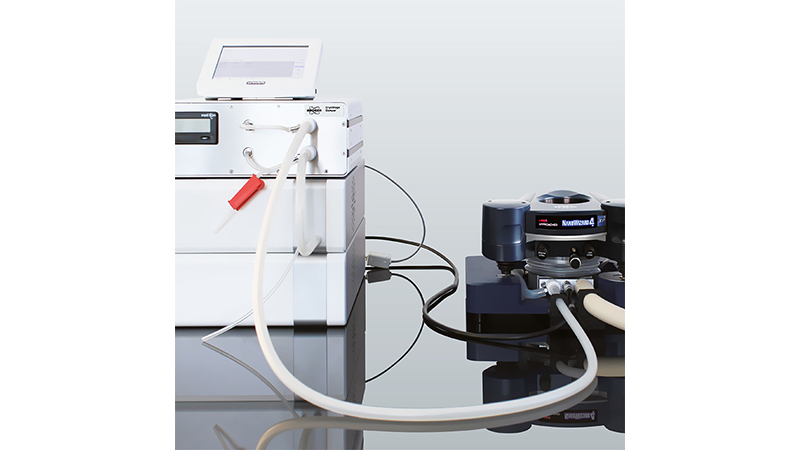
Recently, JPK Instruments developed the new CryoStage that allows for measurements at temperatures down to -120°C. By flushing an enclosed volume with cryogenic nitrogen the CryoStage provides a water-free environment to eliminate condensation and frost.
The new JPK CryoStage
Cryogenic nitrogen is guided out of a dewar directly to the CryoStage using a thermally isolated tube. In the stage the sample holder can also be heated allowing the full temperature range of -120 0 C to 220 0 C to be accessed. A flexible seal between the AFM head and the stage allows the closed sample volume to be completely ice-free. The temperature is adjusted conveniently via PID-controller across the whole temperature range.


Nano-mechanical properties of a blockcopolymer
The surface of a Kraton G1652 MU has been investigated at various temperatures in the range of TM -80 0 C to 40 0 C. From the data collected with QI (Quantitative imaging), where at every single pixel a force-distance curve is recorded, the Young's modulus has been derived. Using a batch process within the JPK data processing software, a Hertz fit has been applied to each force distance curve. Thus, a 256x256 pixel scan yields 65536 values of the Young's modulus which are depicted in the corresponding maps in Figure 2. While there are clearly two kinds of materials visible for temperatures down to -40 0 C they are hardly observed at -60 0 C. At even lower temperatures no differences between the two major Young's modulus values are detected anymore.
The result clearly shows that at room temperature one can see the stiff regions from the glassy polymer block and the soft regions from the rubbery polymer block. However, as one cools down the surface the rubbery component becomes glassy and the two components can no longer be distinguished.
To have more quantitative picture of what is happening when the sample is cooled to cryogenic temperatures, these Young's modulus maps have been further investigated by determining the distribution of the values in terms of histograms. Those histograms are depicted in Figure 3.

Phase transitions in Polycaprolactone (PCL) films
The crystallization of polymers from the melt has been studied extensively by AFM in the last almost two decades. First experiments were performed independently by Pearce et al. and McMaster et al. 1, 2. Early studies focused on isothermally crystallized films. Though, investigated at a different scale, AFM data confirmed the growth rates observed with optical microscopy techniques 1. Hobbs et al. observed, for the first time, that lamellae do not grow at a constant rate they rather propagate at sporadic rates 3. This has been explained by competing lamellae at the crystal growth front. Since then, studies were extended to many different polymers, mostly on thin films as these started to play a major role in many industrial applications.
Here we study the melting and crystallization of a PCL film at a wide range of temperatures. PCL is of interest because it is biodegradable and has been applied to drug delivery and tissue engineering 4. The drug delivery is achieved by the fabrication of nanoparticles through selfassembly of a copolymer brush containing hydrophilic polycaprolactone (PCL) chains, water-soluble PEG chains, and pH-responsive poly - [2- (N,N-diethylamino) ethyl methacrylate] (PDEA) chains 4. It is also commonly used in polymer mixtures, such as, with poly(vinyl chloride) 5. PCL also possesses well-known bulk properties, a melting point of 60 o c and a glass transition of -60 0 C, making it a convenient sample for the study of polymer crystallization by a variety of techniques. PCL crystallization studied with AFM has been reported in the literature for the investigation of, e.g., the morphologies, growth rates and melting of isothermally crystallized thin films 5. AFM data on PCL melt crystallization has also been compared with results of other techniques, including, differential scanning calorimetry (DSC) and polarized optical Microscopy (POM) 6.
In this study we used a PCL filmed prepared by drop casting from solution onto a 170 pm thick glass cover slip 7. Samples prepared in this way generally give films with a range of thicknesses from hundreds of nanometers to many microns. As the film is relatively thick, we do not expect the glass transition temperature to be significantly different to the bulk value. The majority of articles in the literature focus on the study of crystallization from the melt and most AFM data is obtained at conventional imaging speeds. In this study we extend the temperature range from +70 0 C down to -120 0 C by using the novel JPK CryoStage. Hence, we are able to study the melting point and the glass transition of the same sample location in one single experiment. By using JPK's fast AFM technology, we can also extend previous AFM experiments to more data points and/or higher imaging rates.
In our AFM experiment we chose a tip velocity of 50 um/s which was found suitable for imaging the melt above +60 0 C and the film below the glass transition of — 60 0 C. All AFM images are AM AFM images with an amplitude of 17.5 nm. Our experiment starts at room temperature followed by heating up to 70 0 C to completely melt the film. After melting the temperature is reduced in stages, through the crystallization and glass transition regimes, to -120 0 C before finally heating up the film to room temperature again. AFM images were obtained with the sample held at constant temperature, and the temperature was varied at a rate of 22.5 O C/minutes between the scans. All images were converted into a video which will be made public 8. In this analysis we can observe melting from the semicrystalline state, followed by crystallization at different temperatures.
Figure 4 shows the AFM phase images of a sequence at temperatures of 45 0 C, 65 0 C and 70 0 C. Crystalline structures show up as bright contrast and amorphous structures in dark blue. The thin white lines correspond to lamella crystals lying edge-on whereas the rather larger white areas represent the flat-on crystals. During the melting process the flat-on crystals disappear first. In the 70 0 C image on the right one can still see a few edge-on crystals after the rest of the film has melted. In the AFM image after the right one, the film is completely molten (not shown here).


In Figure 5 one can see the film crystallizing from the melt. On the left, the film is still completely molten. By rapidly reducing the temperature to 42 0 C one can follow the crystallization. The central and the right-hand-side images are taken at 42 0 C one after the other. The central image shows the appearance of edge-on crystals and only very few areas show flat-on crystals. Interestingly, one edge on crystal evolving horizontally almost across the whole image is hindering other crystals, forming a barrier which stops them growing towards the bottom of the frame. This competition for space to grow into and mobile material to add to the growing crystals results in the non-constant growth rate at the nanometer scale as discussed above. On the right-hand-side image (bottom left) one can see the appearance of two screw dislocations. These are a result of a crystal being hindered to go sideways and, instead, the crystal grows upwards like a spiral. Height images (not shown here) clearly show the spiral terraces associated with this phenomenon.
Figure 6 shows three images from the left to right at 38 0 C, -55 0 C and -72 0 C, respectively. In the AFM images from 45 0 C to -38 0 C the degree of crystallization gradually increases but at an apparently slow rate. Near the glass transition at -60 degrees, however, one can observe quite a sudden filling of the amorphous areas with crystals. In the central image the large triangular dark blue areas are suddenly filled with fully crystalline material, edge-on and flat-on crystals. At -72 0 C even the amorphous areas between the screw dislocations are fully filled with crystals. A possible explanation for this is that the homogenous nucleation rate increases at low temperatures [9]. This means that, in areas that have not yet crystallized because existing crystals restrict each other's growth and access to the melt, new crystals, can nucleate and fill in the gaps. Below -72 0 C down to -120 0 C there are only minor changes observed in the phase images (not shown). These are mostly a slight reduction in phase contrast indicating that the (now glassy) amorphous material has mechanical properties that are closer to the crystal than the melt.

Summary
The JPK Cryostage and JPK's Q TM allows the quantitative nano-mechanical characterization of surfaces in the range of +220 0 C and -1200 C. This has been demonstrated here by the transition of the rubbery parts to glass in the block-copolymer Kraton G 1652 MU resulting in an increase in their Young's moduli at below -600C.
With the Cryostage and the JPK fast AFM technology, one can extend the temperature range for AFM experiments as above and observe surfaces at high imaging speeds. As a result, the melting point and the glass transition of the same sample location in one single experiment of a PCL film was studied. In the future, the study can be extended to include the film thickness parameter. The change in the chain mobility of the thin polymer film should give interesting shifts for example in the glass transition temperature. We are also planning to compare these findings with the more extensively studied materials with more complex behavior, such as polypropylene. Furthermore, a more rapid cooling from the melt should result in interesting film behavior.
LEARN MORE:
Acknowledgements
JPK would like to thank Nic Mullin, University of Sheffield, UK for the help with sample preparation and the many fruitful discussions around the PCL experiments.
References
- R. Pearce, G. J. Vansco, Macromolecules, 30: 5853 (1997)
- T.J. McMaster, J.K. Hobbs, P.J. Barham, M.J. Miles, Probe Microsc., 1: 43 (1997)
- J.K. Hobbs, T.J. McMaster, M.d. Miles, P.J. Barham, Polymer, 39: 2437 (1998)
- K.K. Jain, Drug Delivery Systems, Springer, 2008
- V.H. Mareau, R.E. Prud'homme., Macromolecules, 38: 398 (2007)
- V. Speranza, A. Sorrentino, F. De Santis, R. Pantani, Hindawi Publishing Corporation- The Scientific World Journal, (2014), Article 720157, https://doi.org/10.1155/2014/720157
- Sample courtesy Nic Mullin, University of Sheffield, UK
- https://www.youtube.com/user/JPKInstruments
- E. Zhuravlev, PhD thesis, Universtiy of Rostock, Germany