Application Note: Measuring the Behavior of Brake Materials More Efficiently: Correlation Between Benchtop and Dynamometer Tests
Evaluating Performance of Friction Materials for Automotive Brake Applications
Testing of friction materials for brake applications using a full-scale dynamometer is an intensive testing method, both in cost and time, that requires the brake pads and rotor be in their final form. A more rapid and cost-effective method to screen materials employed in automotive brake applications has been developed at Bruker. This new benchtop technique utilizes small samples made of friction materials, and tests them under real brake operating conditions. Using the UMT TriboLab™ it is now possible to test such materials in real time and easily program industry-standard dynamometer protocols and standards, all while monitoring key parameters such as friction, temperature, sliding speed, and vibration.
This application note describes the benchtop brake materials testing technique and demonstrates its very good correlation to tests executed on the full-scale dynamometer following the SAE J2522 standard (known as AK Master).
Readers can expect to find:
- Benefits of fast screening for brake materials
- Key parameters to monitor for friction materials screening
- Case study proof of correlation between benchtop and dynamometer testing
KEYWORDS: Tribometer; Mechanical Tester; AN1013; Bruker; Application Note; UMT TriboLab; Brake; Friction Materials; Automotive; SAE J2522

Introduction
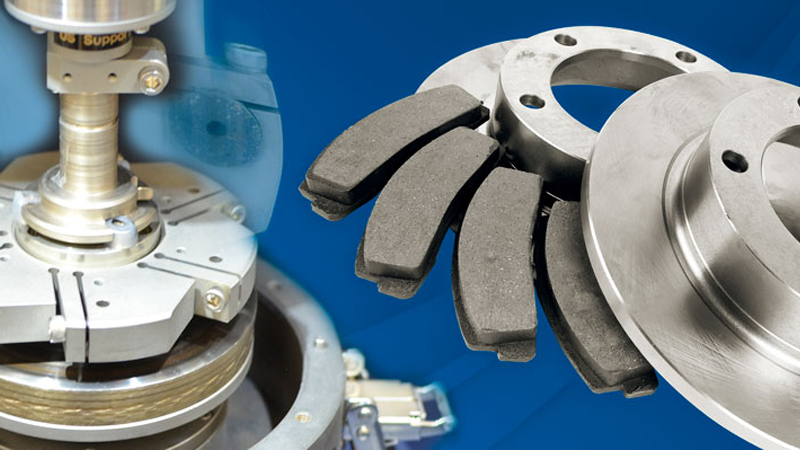
Testing of friction materials for brake applications using a full-scale dynamometer is an intensive testing method, both in cost and time, that requires the brake pads and rotor be in their final form (see Figure 1). A more rapid and cost-effective method to screen materials employed in automotive brake applications has been developed at Bruker. This new benchtop technique utilizes small samples made of friction materials, and tests them under real brake operating conditions. Using the UMT TriboLab™ it is now possible to test such materials in real time and easily program industry-standard dynamometer protocols and standards, all while monitoring key parameters such as friction, temperature, sliding speed, and vibration. This application note describes the technique and demonstrates its very good correlation to tests executed on the full-scale dynamometer following the SAE J2522 standard (known as AK Master).

Evaluating Performance of Friction Materials for Automotive Brake Applications
Development of the new generation of materials to be employed for automotive brake applications comes with many challenges, including formulation of materials that meet expected (usually more demanding) performance; cost reduction; and compliance with new safety and environmental regulations.
Brake materials are typically evaluated prior to on-vehicle stopping tests by techniques that are fully developed, such as the use of a full-scale dynamometer (see Figure 2). Dynamometer tests allow testing of the real pad or rotor under protocols simulating the conditions necessary to stop a vehicle. Different standards have long been in prevalent use by this specialized industry, such as the SAE J2522 developed by the AK Working Group, which represents European manufacturers of passenger car brakes. This test was developed to evaluate the effectiveness of the brake pad and the rotor system under varying conditions of pressures, temperatures, speeds, and deceleration.
To perform any relevant test on the dynamometer, it is necessary to manufacture the rotor and pad in the exact shape and size as a final product. Thus, it is a costly method, without even accounting for the time needed to prepare materials and the queue time in accessing available dynamometers. Additionally, to perform the tests, it is necessary to include other elements of the brake system that can introduce further variables. For example, the effectiveness of the caliper can vary depending on design, making it difficult to separate the effect of the brake and rotor.1 There is a critical need for a technique that can provide fast screening in the early stage of brake materials development, before the more laborious and expensive testing at the component level on the dynamometer.

Figure 2. Full-scale brake test protocols/standards are typically conducted on dynamometers.
Photo Courtesy of Greening Test Laboratories.
Testing Brake Materials at a Reduced Scale
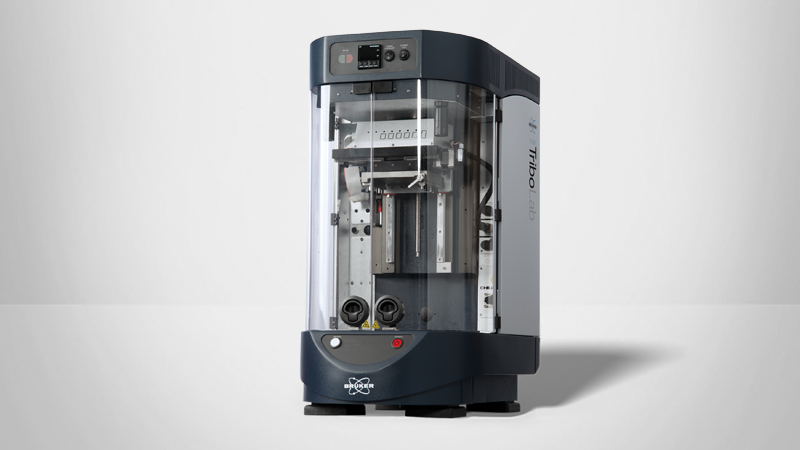
Bruker’s Brake Material Screening Tester for the UMT TriboLab (see Figure 3) was specifically designed to be a cost-effective and rapid way to screen and rank materials before proceeding to the component level evaluation. The techniques employed allow the characterization of the tribological performance of small, friction material samples in a precise and timely manner, while monitoring key parameters such as friction, sliding speed, temperature, vibration, and wear.
To scale down and properly simulate the brake system, it is necessary to consistently match critical physical parameters used by dynamometers for protocols like the SAE J2522:
- Contact pressure between the pad and rotor
- Sliding speed
- Deceleration
- Initial temperature
Since benchtop systems typically have small inertia in comparison with a vehicle or dynamometer, deceleration is simulated by controlling the velocity of the motor as a function of time. Key parameters monitored during the different steps of the simulation include torque, coefficient of friction, temperature of the rotor, temperature of the pad, and sliding speed.


Another key advantage of performing the tests at a smaller scale is the possibility of easily controling environmental parameters, like relative humidity and temperature, but also the capability of collecting the debris ejected from the sliding contact interfaces during the test. Such brake wear particles can then be subjected to post-test chemical and physical characterization.
The conventional tests that meet industry standards typically are focused on deceleration tests, in which the vehicle is simulated during stopping or speed-reduction conditions (e.g., in many of its test steps the SAE J2522 use snubs from 80 km/h to 30 km/h applying 3,000 kPa in the fluid line that applies the force to the caliper). With the TriboLab, the deceleration force is simulated in the same way, as shown in Figure 4.
Correlation between Benchtop Test and Full-Scale Dynamometer
The minimum contact size of the coupons is very important in benchtop friction material testing. While the contact pressure and sliding speed can be selected from the real application or test protocol, there is a minimum sample size that can represent the non-homogeneous morphology and composition of the brake pad.
Here, we employed the UMT TriboLab to simulate two different brake pad materials (A and B) that were previously tested on a full-scale dynamometer using the SAE J2522 protocol (courtesy of Greening Testing Laboratories). A typical report of the results obtained from SAE J2522 is displayed in Figure 5, in which the different steps and cycles for material "A" are presented, and key variables such as temperature, pressure, torque, and friction are shown.

Figure 5. SAE J2522 graphic report of the material A test performed on the dynamometer.
Courtesy of Greening Test Laboratories.

The samples were extracted from the same pads, as small cylinders with a diameter of 12.7 mm [0.5"] and thickness of 6.35 mm [0.25"]. A cast iron disc to represent the rotor was obtained by machining a real rotor to the desired dimensions. For the setup, three samples of each material were placed on a radius of 38 mm (see figure 6). The pad materials coupons were pressed against the cast iron disc, applying loads that simulate contact pressures used in the SAE J2522 protocol. To calculate the contact pressures used at the full-scale test, it is necessary to have the area of the pad, the pressure of the fluid, and the diameter of the piston. To calculate the linear speeds to be used on the benchtop scale test, the effective radius of the rotor and the tire-rolling radius were considered. Again, since the inertia of a benchtop scale system is very low in comparison with the dynamometer, the deceleration was precisely controlled at the motor, using similar stopping-time values to those obtained from the full-scale test.
The J2522 protocol consists of 15 different main steps and many other sub-steps that aim to evaluate the friction performance of the brake under different conditions. For this comparison, we choose 8 of these steps (292 cycles):
- 6.1 Green µ characteristic (30 cycles): snub 80-30 km/h, 380 N
- 6.2 Burnish (192 cycles): snub 80 to 30 km/h, varying the applied load
- 6.3 Characteristic value 1: (6 cycles): snub 80-30 km/h, 380 N
- 6.4 Speed/pressure sensitivity
- 6.4.1 Speed/pressure sensitivity 40 km/h (8 cycles): snub 40-5 km/h, varying the load
- 6.4.2 Speed/pressure sensitivity 80 km/h (8 cycles): snub 80-40 km/h, varying the load
- 6.4.3 Speed/pressure sensitivity 120 km/h (8 cycles): snub 120-80 km/h, varying the load
- 6.5 Characteristic value 2: (6 cycles): snub 80-30 km/h, 380 N
- 6.6 Cold application: 1 stop 40-5 km/h, 380 N
- 6.9 Fade 1: 15 stops 100-5 km/h, 500 N
- 6.10 Recovery 1 (18 cycles): snub 80-30 km/h, 380 N
For the comparison after the tests, some of the key parameters were calculated:
- μ0P61 Average value of the friction values of the 1st to 6th application in section 6.3 (characteristic value 1)
- μv120 Average value of the friction values at 2000, 3000 and 4000 kPa in section 6.4.3 (speed/pressure sensitivity 120 km/h)
- μ0P62 Average value of the friction values of the 1st to 6th application in section 6.5 (characteristic value 2)
- μT40 Friction value of the 1st application in section 6.6 (cold application) – μT40 Friction value of the 1st application in section 6.6 (cold application)
The data collected during the tests show good correlation between the full-scale and benchtop tests, not only from the calculated average CoF, but also in the behavior of the torque with similar trend and shape. Figure 7 presents the results of the characteristic value 1 step for material "B". The TriboLab tests show more evidence of vibration (observing the noise on the CoF) than the dynamometer tests. This could be due to differences in filtering the data, and that in the TriboLab tester the sensor is located very close to the tribological surfaces. Temperature values are different in magnitude, since temperature is not an intrinsic property, and depends of the mass of the components of the system.

When observing another step of SAEJ2522, in which the load is increased in every cycle, there is very good correlation in terms of the coefficient of friction following the trend. Figure 8 shows the step 6.4.2 aimed at measuring the sensitivity to brake-application pressure when testing the system at snubs of 40-50 kmh.

Another example of the good correlation between dynamometer and TriboLab results is evidenced when testing the materials at 40°C ("cold application," step 6.6). Here, the values of CoF are very close (see Figure 9)

When comparing all the calculated average coefficient of friction for the different tests, for both material A and B, it is clear that the TriboLab Brake Material Screening Tester can be used as a reliable tool to screen the friction behavior of brake materials, and as a good complement to the dynamometer tests.
Figure 10 shows the comparison in the CoF for each step. Most of the values are within 10% difference, which is a very good correlation, since many variables are not the same, such as the effectiveness of the caliper, or the inertia. For some of the more difficult-to-reproduce steps, such as the fade step (6.9), in which the temperature of the material raises very quickly, it is understandable that differences between the dynamometer and TriboLab results are greater than other steps.

Conclusion
The overall comparison of full-scale tests versus benchtop tests performed demonstrates that the UMT TriboLab Brake Material Screening Tester is an effective and reliable instrument for the evaluation and screening of friction materials for brake applications. The advantages in size, speed, and flexibility of the TriboLab make it an excellent complementary instrument to the dynamometer.
References
- Fecher, Norbert, Jochen Thiesing, and Hermann Winner. "Caliper-independent investigation of brake pads." EuroBrake, EB2014-ST-006 (2014).
Authors
Giovanni Ramirez, Steven Shaffer and Ivo Miller, Bruker Nano Surfaces Division