DIFFRAC.EVA
General Scan Evaluation
Routine data and cutting-edge research
DIFFRAC.EVA is the versatile X-ray diffraction (XRD) analysis software for fast, reliable evaluation of one and two dimensional diffraction data.
It supports all Bruker detectors and scan types and covers the full workflow—from data reduction and visualization to peak analysis, phase identification, quantification, crystallinity, and crystallite size determination. Advanced profile fitting, database driven phase identification, and integrated Pair Distribution Function (PDF) analysis enable confident interpretation of both simple and complex diffraction patterns.
Designed for modern XRD laboratories, DIFFRAC.EVA efficiently handles large datasets from fast detectors, in situ and operando experiments, high throughput screening, and spatially resolved measurements. Built in chemometrics tools, workflow automation, and seamless integration with the DIFFRAC.SUITE database infrastructure support reproducible evaluation, even in regulated environments such as pharmaceutical QC under 21 CFR Part 11. Publication ready graphics and flexible reporting complete a powerful, end to end solution for routine analysis and advanced research alike.
Introducing DIFFRAC.EVA 8 – From Phase Identification to Automated Insight
DIFFRAC.EVA 8 extends EVA from a powerful Search/Match application into an iterative, automated, and high‑throughput XRD data evaluation environment. The release focuses on deeper insight into complex diffraction patterns, increased productivity for large datasets, and tighter integration across the DIFFRAC.SUITE ecosystem.
Profile Fit Residual Search (PFRS) introduces an optional iterative loop between phase identification and profile fitting. After an initial Search/Match step, identified phases are fitted, unexplained residual regions are analyzed, and additional phases are automatically searched and added. Visual differentiation of newly identified phases supports transparent and efficient resolution of complex multiphase patterns.

Atom Pair Histograms link structural database information with experimental PDF data, supporting interpretation of short‑range order. Monoatomic and diatomic histograms improve understanding of local structure effects, particularly for disordered and nanocrystalline materials.

A new 3D View for scan lists provides intuitive pseudo‑3D intensity maps, enabling rapid identification of trends, transitions, and anomalies in non‑ambient, operando, or time‑resolved experiments.

Why Upgrade to DIFFRAC.EVA 8?
DIFFRAC.EVA 8 is designed for users who already rely on EVA and want to work faster, more consistently, and with greater confidence—especially when dealing with complex samples or large datasets.
Compared to previous versions, EVA 8 reduces manual trial‑and‑error through iterative phase identification with Profile Fit Residual Search (PFRS), enables consistent refinement across scan lists with batch profile fitting, and strengthens workflow automation for unattended and high‑throughput evaluation. Enhanced PDF interpretation and advanced visualization tools provide deeper insight into local structure and data trends.
For routine QC, application development, and advanced research alike, DIFFRAC.EVA 8 delivers higher productivity, improved result reliability, and seamless integration across the DIFFRAC.SUITE—from measurement to advanced quantitative analysis.
DIFFRAC.EVA Key Features at a Glance
Data Reduction, Visualization & Manipulation

DIFFRAC.EVA enables fast data reduction and visualization of one- and two-dimensional X-ray diffraction (XRD) data. Raw detector images are efficiently converted into conventional 1D diffraction patterns, providing the basis for reliable downstream analysis. From routine signal processing to detailed peak and full-pattern evaluation, EVA supports rapid and confident first insight into measurement results.
Big Data Visualization & Feature Extraction

DIFFRAC.EVA supports intuitive visualization and feature extraction from large XRD datasets using integrated cluster analysis and advanced statistical tools. Based on proven POLYSNAP technology, EVA helps identify similarities, trends, mixtures, and outliers in high-throughput, in-situ, and non-ambient experiments. Advanced 3D and multi-dimensional plots reveal relationships that are difficult to detect by manual inspection.
Large Datasets & Supplementary Information

DIFFRAC.EVA is designed to efficiently handle large measurement series using the multi-scan reader for rapid overview and selection of relevant scans. Supplementary information such as temperature, position, humidity, peak intensity, or amorphous content can be visualized alongside diffraction data. This accelerates identification of phase transformations, formation, or decomposition processes.
Bragg2D – Sample Preparation Insights

Bragg2D visualization in DIFFRAC.EVA supports rapid assessment of sample morphology, stress, and preferred orientation effects. High-resolution asymmetric detection enables intuitive inspection of grain size effects, spottiness, and alignment artifacts. Interactive selection of scans allows fast transition to detailed analysis.
Phase Identification, Profile Fit, and Quantification
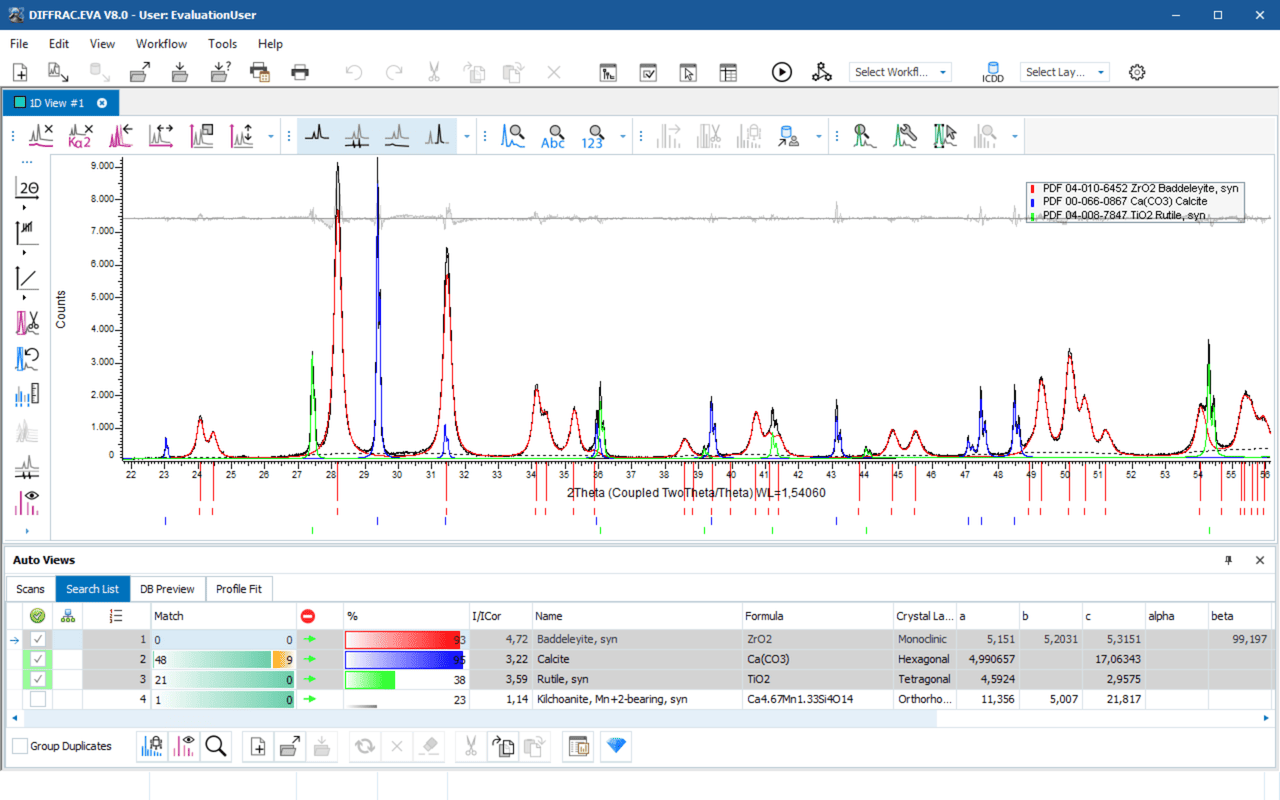
DIFFRAC.EVA is a trusted and widely recognized solution for reliable phase identification in X ray diffraction. Its advanced Search/Match functionality supports identification of known and unknown phases, even in complex multiphase samples, while simultaneous database searching and support for modern acquisition strategies improve detection of minor and trace phases.
To validate and refine phase assignments, DIFFRAC.EVA provides powerful interactive and automated profile fitting tools. Advanced background modeling, peak shape refinement, and residual inspection enable users to resolve peak overlaps and systematically improve the description of the measured diffraction pattern. Iterative workflows, including Profile Fit Residual Search (PFRS), use unexplained residuals to drive further phase discovery and refinement.
Based on the validated phase model and improved fit quality, DIFFRAC.EVA supports reliable quantitative phase analysis. Quantification using reference intensity ratios (RIR) and full profile information benefits directly from improved identification and profile fitting, resulting in higher accuracy and robustness—without changing the underlying quantitative methodology.
Integrated Pair Distribution Function (PDF) Processing

DIFFRAC.EVA enables streamlined generation and evaluation of experimental Pair Distribution Functions (PDFs) directly from raw diffraction data. Automated background correction, normalization, and Fourier transformation provide fast access to local‑structure information for amorphous, nanocrystalline, and disordered materials. Integrated database support and downstream analysis tools simplify interpretation and further quantitative evaluation.
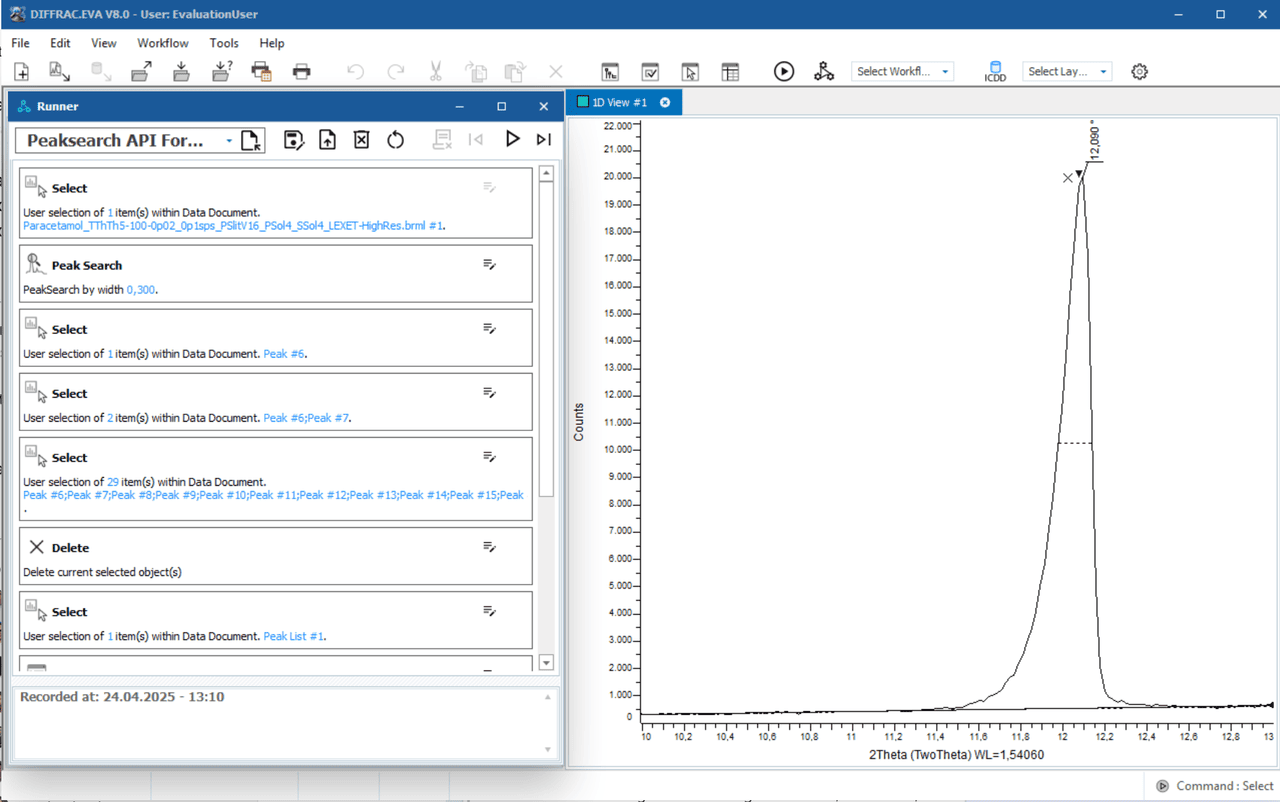
Workflow Recording and Automation
Evaluation steps in DIFFRAC.EVA can be recorded and reused as workflows to ensure reproducibility and reduce manual effort. Through tight integration with DIFFRAC.BBE and the measurement software, workflows become part of the Start Jobs and Results Manager concept: users can query the instrument database, select matching scans, and automatically apply predefined workflows to the resulting datasets. Recorded workflows can be executed interactively or in batch mode using the Instant Runner, supporting standardized evaluation procedures, high‑throughput screening, and QC environments.
DIFFRAC.EVA – Key Advantages
- Comprehensive XRD evaluation in one environment. Covers data reduction, visualization, phase identification, quantification, profile fitting, and advanced analysis using proven, industry trusted algorithms.
- High productivity on modern hardware. Optimized for current computer architectures with native 64 bit support, multi threading, and parallel processing to efficiently handle large datasets and complex evaluations.
- Immediate visual validation and safe interaction. Real time preview of all evaluation steps, combined with unlimited undo and redo, enables confident decision making and risk free exploration of analysis strategies.
- Flexible, user adaptive interface. The highly customizable GUI adapts to different hardware setups, workflows, and user preferences, ensuring efficient operation across all EVA modules.
- Seamless integration and fast onboarding. Tight integration with DIFFRAC.SUITE Measurement and Results Manager supports consistent workflows from data acquisition to reporting, while guided tutorials enable quick and reliable onboarding.
Together, these advantages make DIFFRAC.EVA a reliable and scalable XRD evaluation platform for routine quality control, application development, and advanced research.
Applications – What’s your Analytical Challenge
Out of the box analytical capabilities
DIFFRAC.EVA provides a comprehensive and scientifically sound set of X ray diffraction evaluation methods that are immediately available with every Bruker XRD system. It is designed as a solid and trustworthy foundation for professional laboratory work and academic teaching alike, supporting established XRD workflows as well as modern extensions such as iterative phase identification in powder diffraction and Pair Distribution Function (PDF) analysis.
Together, these out of the box capabilities make DIFFRAC.EVA a solid and trustworthy foundation for XRD data evaluation in industrial laboratories, academic research, and teaching environments.
Typical XRD applications supported by DIFFRAC.EVA
Peak and phase monitoring
Monitoring of peak position, intensity, width, and shape for quality control, phase evolution studies, and process monitoring across measurement series. EVA supports both interactive and automated evaluation workflows and integrates seamlessly with the DIFFRAC.SUITE measurement database for series based analysis.
Phase identification and quantitative analysis
Reliable Search/Match against comprehensive inorganic and organic reference databases, combined with semi quantitative and internal standard based quantification using reference intensity ratios (RIR) and full profile information. Iterative refinement workflows, including Profile Fit Residual Search (PFRS), support improved identification of minor and overlapping phases and provide a natural transition to advanced quantitative refinement with DIFFRAC.TOPAS where required.
Crystallinity, amorphous content, and local structure analysis
Evaluation of crystalline and amorphous fractions based on robust baseline and peak separation, complemented by Pair Distribution Function (PDF) analysis for investigating short range order in nanocrystalline, disordered, or amorphous materials. EVA supports export of PDF data for further quantitative analysis in DIFFRAC.TOPAS.
Crystallite size and crystallographic parameters
Analysis of peak broadening and refinement of phase related parameters to support crystallite size determination and comparative studies of structural properties, while accounting for instrument and sample related effects. These analyses provide essential phase property insight within EVA and form a consistent basis for extended structural refinement workflows.
Cluster analysis and scan matching
Similarity analysis, pattern classification, and correlation based scan matching for large datasets, enabling grouping, trend analysis, identification of recurring materials, and comparison of samples not represented in reference databases. These tools support high throughput studies and provide a foundation for automated evaluation pipelines in combination with DIFFRAC.BBE.
Rocking curves and orientation analysis
Evaluation of single crystals, thin films, and textured samples based on orientation dependent measurements and 2D detector data. EVA enables fast visualization and selection of scans for further detailed inspection or downstream analysis.
DIFFRAC.EVA Specifications
| Version | The current version of the software is DIFFRAC.EVA V8, DIFFRAC.Part 11 V8 | |
Database compatibility | Version 8.8 and two versions backwards compatible for r/w access | |
Compliance | cGxP/21CFR Part 11 |
DIFFRAC.EVA Resources
Flyers & Articles & Product Sheets & White Papers
Keep your DIFFRAC.EVA up to date
Free Maintenance Update
The free DIFFRAC.EVA Maintenance Update renews your EVA version to the most recent release. Regardless of your EVA license level, you can always download the latest Maintenance Update from www.brukersupport.com, free of charge!
Download process
- Register at Bruker Customer Support
- Click on the "Software" button
- Search for the DIFFRAC.EVA Maintenance Update
- Download the update
Bugfixes
By keeping your DIFFRAC.EVA up to date, you will benefit from all bugfixes made for the current but also all previously released versions, regardless of the license level. DIFFRAC.EVA Maintenance Updates are cumulative and can therefore be applied to any previous version.
What are Upgrades?
DIFFRAC.EVA Maintenance Updates do not come with new features. If you want to benefit from features introduced in new major releases you need to purchase the latest DIFFRAC.EVA upgrade.