Guide to Raman Spectroscopy
What is Raman spectroscopy?
Raman spectroscopy is a chemical analysis technique which involves illuminating a substance with a laser and analyzing the light that is scattered off the surface of the substance. The scattered light can provide a lot of information about the substance and its structure, and can be used to identify, characterize, and quantify many chemical components.
Light scattering explained
When light is scattered off a sample there are two possible outcomes:
(1) Elastic scattering, also known as Rayleigh scattering, occurs when the scattered light has the same energy as the light that initially struck the sample. This means that the elastically scattered light will be the same frequency, wavelength, and color as the original beam of light.
(2) Inelastic scattering, or Raman scattering, occurs when the scattered light has a different energy than the light that initially struck the sample. This means the inelastically scattered light will have a different frequency, wavelength, and color than the original beam of light.
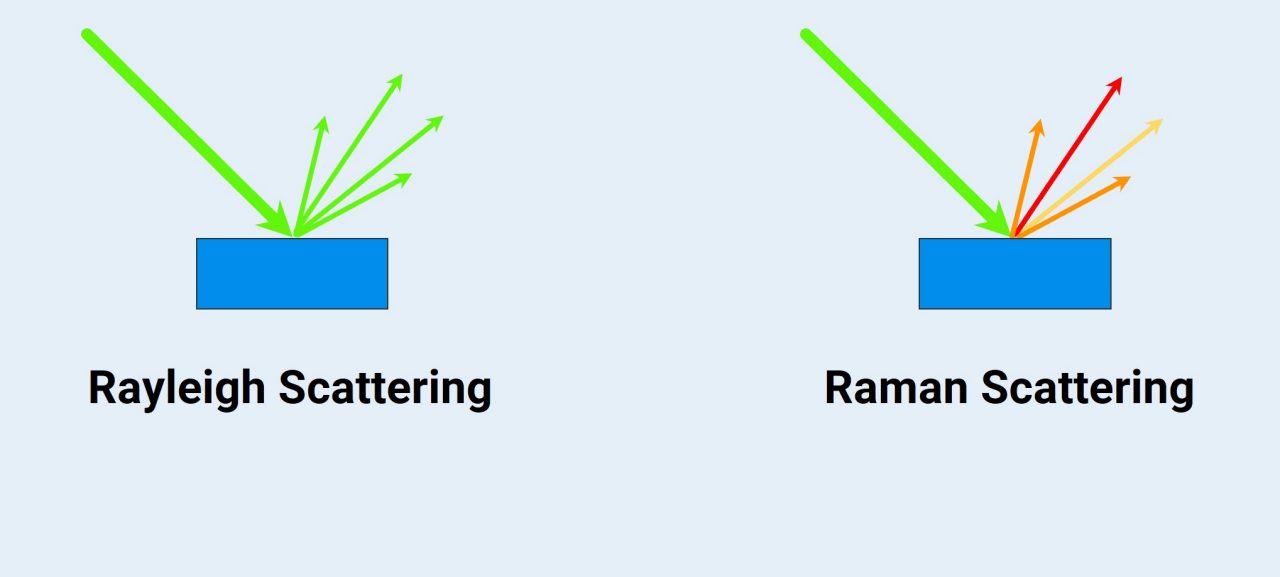
As the name implies, this is the type of scattering that gives Raman spectroscopy its name. So why is this kind of scattered light so useful for spectroscopy, and what causes it to have a different energy after interacting with a sample?
The Raman effect
The answer has to do with the constant motion of atoms in a molecule, which makes the bonds in atoms kind of like springs that are constantly vibrating in different directions. These molecular vibrations happen at specific frequencies which are unique to the molecule and type of bond. An popular and easy example for such a spring is molecular oxygen (O2) or nitrogen (N2). Imagine each moleccule as two hard spheres connectect by spring of a certain strengths and therefore specific vibrational frequency.
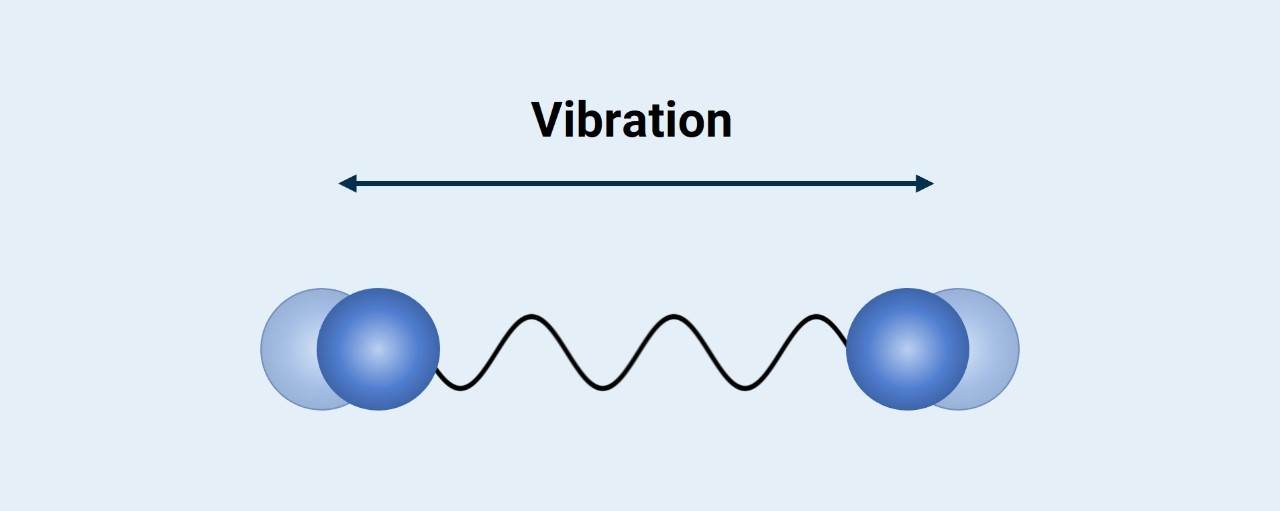
We typically discuss the vibrational frequencies of molecules in terms of wavenumbers, which have units of reciprocal centimeters [cm-1]. So for example, oxygen gas in our atmosphere vibrates at around 1550 cm-1, while nitrogen gas vibrates at 2330 cm-1. Larger molecules with lots of chemical bonds will have many different molecular vibrations occurring at different frequencies.
Now, every time incoming light has the same frequency as the vibration of the molecule, light can be absorbed, "exciting" the vibration further, and amplifying its amplitude. Since the different bonds in molecules vibrate at different frequencies, different molecules will absorb unique frequencies of light to excite vibrations.
So, what do these molecular vibrations have to do with Raman spectroscopy and the inelastic scattering of light? Well, if a molecule is illuminated with light, the molecule may absorb some of that light to excite a molecular vibration. If that happens, the light that scatters off the molecule will come back at a different frequency and color since some of the light from the original beam was absorbed by the molecule. This phenomenon is called the Raman effect, and it’s the cause of Raman scattering.

Applying the Raman effect
Since the frequencies of light absorbed when a molecule is illuminated are unique to the molecule and type of bonds, detecting these frequencies of light will allow us to figure out which molecules are present in the sample.
This is the aim of Raman spectroscopy.
So how can we detect which frequencies of light were absorbed by molecules in the sample? Well, when those molecules absorb some of the light (inelastic scattering), the frequency of the light changes. So to detect the Raman effect, we can simply determine the frequency shift between the original beam of light and the Raman scattered light. The frequency shift is called the Raman shift.
By using a monochromatic laser for the experiment we can easily determine the frequency of the original light beam, since lasers emit light that is all the same wavelength and frequency. The typical choice is a green laser (532 nm). To make it clear: When the sample is illuminated with the laser, some of the laser light will be absorbed by the sample to excite molecular vibrations, causing Raman scattering. The Raman scattered light is then collected at a detector so we can determine its frequency. That will give us all the information we need to determine the Raman shift.

Creating a Raman spectrum
Once we know the Raman shifts, we can plot that information to create the Raman spectrum. Each peak on the Raman spectrum corresponds with a different frequency of light absorbed by the sample which excited a vibration. Since these frequencies are unique to the molecule and the types of bonds it contains, the Raman spectra creates a “chemical fingerprint” that allows us to identify and quantify a large variety of substances.
For example, we know oxygen vibrates at around 1550 cm-1 while nitrogen vibrates at 2330 cm-1. If we illuminate these gases with our green laser, the gases will absorb those frequencies of light which we’ll see on the Raman spectra. There will be a peak for oxygen around 1550 cm-1 and a peak for nitrogen around 2330 cm-1. This means Raman spectroscopy would be able to easily tell these two molecules apart, even though they are both similar colorless gases in our atmosphere.

Of course, not every sample is as simple as oxygen or nitrogen. Many molecules are quite complex, containing many chemical bonds with lots of different molecular vibrations. So, the Raman spectrum for most molecules will contain many peaks. Luckily, the Raman spectra of many compounds have already been measured and compiled into vast spectral libraries. Computer software can compare measurements against these spectral libraries for effortless identification of nearly any sample.

Raman for beginners by Yan Di
Raman expert Di Yan has created an educational series with us in which he explains Raman for beginners in an easy way.
Benefits of Raman spectroscopy
Raman spectroscopy, like FT-IR spectroscopy, can be used to identify, quantify, and characterize a broad range of substances in industry and in the lab. Additionally, Raman spectroscopy has several unique benefits that cannot be accomplished with other techniques.
Since Raman uses visible laser light, a Raman spectrum can be obtained through any kind of packaging that visible light can go through. This means substances inside glass bottles, plastics bags, or other transparent containers can be analyzed without opening the packaging. The ability to analyze samples inside their packaging is very useful in the pharmaceutical industry for example, where drugs can be checked without contaminating the drug by opening the bottle.

Visible lasers also provide another advantage unique to Raman spectroscopy. SInce the wavelength of visible light is very small (see diffraction limit), even nano structures can be examined with Raman spectroscopy. This makes Raman useful for analyzing extremely thin polymer films or small biological structures like DNA and proteins.
Raman spectroscopy is also a completely non-contact technique that requires little to no sample preparation, so it can analyze nearly any sample without touching it or damaging it in any way. That’s why Raman is an invaluable tool to study historical artefacts and documents, as well as artworks.
On top of all that, Raman spectrometers are quite simple instruments, so capable handheld Raman spectrometers are widely available. This means Raman can be used quickly and easily outdoors or on the production floor. That’s why handheld Raman spectrometers are so useful for incoming goods control or in geology and mineralogy to quickly identify samples in the field.
Limitations of Raman spectroscopy
Though Raman spectroscopy is a powerful technique, it has several limitations. One of these limitations is the strength of the Raman effect itself. Most light that is scattered off a substance will be Rayleigh scattered, with Raman scattering accounting for only 0.0000001% of the scattered light. This places limits on the sensitivity of Raman spectroscopy, as it relies on detecting Raman scattered light.
An easy way to get around this is to increase the intensity of the laser, which has the drawback of potentially damaging the sample. There are also several variations of Raman spectroscopy, such as Surface Enhanced Raman spectroscopy (SERS), designed deal with and surpass this limitation.
Another major challenge with Raman spectroscopy is fluorescence. Fluorescence occurs when a substance absorbs light, and later emits light that is lower in energy. This is different from the Raman effect, where light that matches the frequency of molecular vibrations is absorbed and the rest of the light is scattered. Light absorbed and emitted due to fluorescence does not correspond to vibrations, so it isn’t useful in Raman spectroscopy.

However, the detector inside a Raman spectrometer can’t distinguish between the light emitted due to fluorescence and the light from Raman scattering. This means that if the sample in a Raman experiment fluoresces, the emitted light will show up on the Raman spectrum. Fluorescence interferes with the Raman spectrum, since fluorescence peaks are larger and broader than Raman peaks, making the Raman peaks difficult to distinguish.
To avoid fluorescence, the wavelength of the laser must be changed. Sometimes using a visible light laser with a different color is enough to avoid fluorescence. However, the best solution to avoid fluorescence in Raman experiments is to use an infrared laser (1064 nm). A special type of Raman spectrometer is used for analysis with infrared light, which is called an FT-Raman spectrometer.
Molecular vibrations in other techniques
The principles behind Raman spectroscopy are used in other techniques too. As Raman spectroscopy most often uses a visible light laser, it is quite easy to combine a Raman spectrometer with a traditional light microscope. These Raman microscopes allow samples to be analyzed by simply targeting the area of interest with the microscope. Raman microscopes are also able to create detailed chemical images, which gives a map of the sample being investigated.
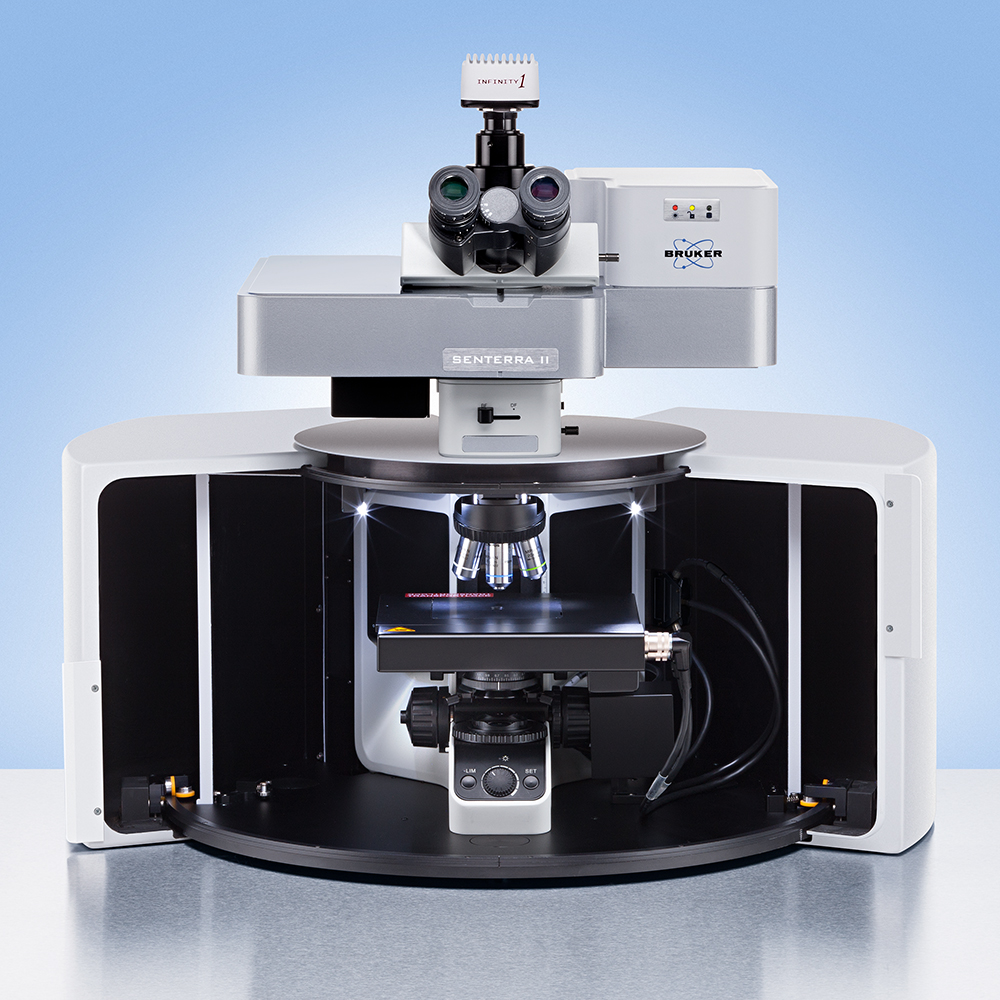
About Raman microscopy

Raman Spectroscopy usually uses a laser in the visible range, which can easily pass through any transparent material. This makes it easy to combine Raman spectroscopy with a traditional light microscope since the laser light can pass through the sampling slides and microscope lenses. Combining these two technologies results in a Raman microscope.
Raman microscope have become even more popular than a traditional benchtop Raman spectrometer since it offers a “point and shoot” approach with little or no sample preparation. To analyze a sample, such as graphene fibers, it is simply placed on a slide beneath the objective lens of the microscope. Then, the microscope is used to target an area of interest on the sample for analysis.
Raman microscopy allow samples to be examined visually with the microscope, and then analyzed with Raman spectroscopy with the laser. From there, detailed chemical images can even be created. Raman microcopy and imaging is an important set of techniques at Bruker, so be sure to check out those dedicated websites to learn more.
About infrared spectroscopy
Infrared spectroscopy is similar chemical analysis technique that analyzes molecular vibrations in a different way. This technique is generally great at identifying and quantifying the types of substances that Raman cannot analyze efficiently.
The history of Raman spectroscopy
The road to Raman spectroscopy begins in 1923, when Adolf Smekal theorized that light could be inelastically scattered. Five years later, an Indian Scientist C.V. Raman was studying how light travelled through different liquids and was able to observe the inelastic scattering Smekal predicted. This discovery earned Raman the Nobel prize in 1930.

In 1929 first Raman spectra was collected in 1929 by Franco Rasetti, who was studying various gases at high pressure. The first widely used Raman Spectrometers were created soon after in the early 1930s by the physicist George Placzek, which allowed scientists to investigate and document molecular vibrations in a wide array of molecules.

Despite these early developments, the Raman effect wasn’t put to much use experimentally for several decades. This was largely due to the light source used at the time, which was a mercury lamp that was filtered to create a monochromatic beam. The beam resulting from this was very weak, which meant experiments took hours, sometimes days to conduct.
It wasn’t until the 1960s, when the laser was discovered, that this problem was overcome. Lasers provided a strong monochromatic light source, which paved the way for Raman Spectrometry to become a mainstream technique.
Frequently asked questions about Raman spectroscopy
What is Raman spectroscopy?
Raman spectroscopy is based on the interaction of light with the chemical bonds of a substance. This yields detailed information about chemical structure, polymorphism, crystallinity and molecular dynamics.
What information is provided by Raman spectroscopy?
A Raman spectrum is like a chemical fingerprint that clearly identifies a molecule or material. And just like a human fingerprint, it can be compared with reference libraries to identify the material very quickly or distinguish it from others. Such Raman spectral libraries often contain hundreds of spectra with which the spectrum of a sample is compared to determine the analyte.
It provides insights into a sample's:
- Chemical composition and properties
- Crystallinity and polymorphism
- Contaminations and defects
- Thermal and mechanical exposure
Are there sample requirements?
Raman is a universal sampling technique and therefore works for both, inorganic and organic materials. However, since it is based on the rather weak Raman effect, other spectroscopic effects and certain material properties can critically interfere.
In case of sample fluorescence, the sample won't yield a nice Raman spectrum. However, a switch to near infrared (NIR) lasers and FT-Raman technology is a viable solution. Another, more significant problem are strongly absorbing (e.g. black) samples, for example carbon filled polymers.
What's the time needed to obtain a Raman spectrum?
The time required for a Raman measurement depends on several factors, such as the desired spectral quality, the sample properties and of course the Raman spectrometer used. Typically, good quality Raman spectra can be acquired in a few seconds.
What are the applications of Raman spectroscopy?
Raman spectroscopy can be used in all areas where non-destructive (microscopic) chemical analysis and imaging is required. It delivers answers for qualitative and quantitative analytical questions.
In general, Raman is easy to use and quickly provides key information to characterize the chemical composition and structure of a sample. Basically, it matters little whether the samples are solid, liquid or gaseous.
Here are some applications of Raman spectroscopy:
- Pharmaceuticals
- Geology and mineralogy
- Semiconductors
- Material research
- Life-science