New Directions for Chemical Analysis in Paleobiology
Explore New Technologies
The study of Earth’s past life requires special attention and dedication. Bruker understands the special requirements of delicate paleontological samples. Bruker’s instrumentation has been trusted for the non-destructive analysis of some of the world’s most important cultural heritage objects and paintings, and now we are bringing our chemical imaging expertise to paleontology, ichnology, and paleobiology. We invite you to explore Bruker’s wide and expanding portfolio of chemical imaging instrumentation and to reach out to speak to one of our Applications Scientists to organize a demonstration.
Lateral resolution | Analytical targets | Samples | |
|---|---|---|---|
Micro-XRF | 18 to 100 µm | Major and trace elements, quantification possible. Best performance for trace elements. | Slightly rough to flat surfaces, standard thin sections, outcrop with less than 1 cm roughness |
Raman Microscopes | 250 nm | Molecules with Raman scattering phenomenon. | Standard thin sections, rock chips, flat surfaces |
FTIR Microscopes | 2 – 10 µm | C-H-O functional groups | Polished and smooth surfaces, thin sections |
EDS on Scanning Electron Microscope | Microns (dependent on SEM beam size) | Major elements and some trace elements. Quantification possible. Best performance for light elements. | Polished and coated thin section or SEM mount. Vacuum required. |
EDS on Transmission Electron Microscope | Nanometers | Major elements and some trace elements. Quantification possible. Best performance for light elements. | Specialized TEM lamina sample preparation. |
EBSD/TKD | >2nm | Crystallographic characterization of minerals | Highly polished thin section and electron transparent samples |
Micro-XRF
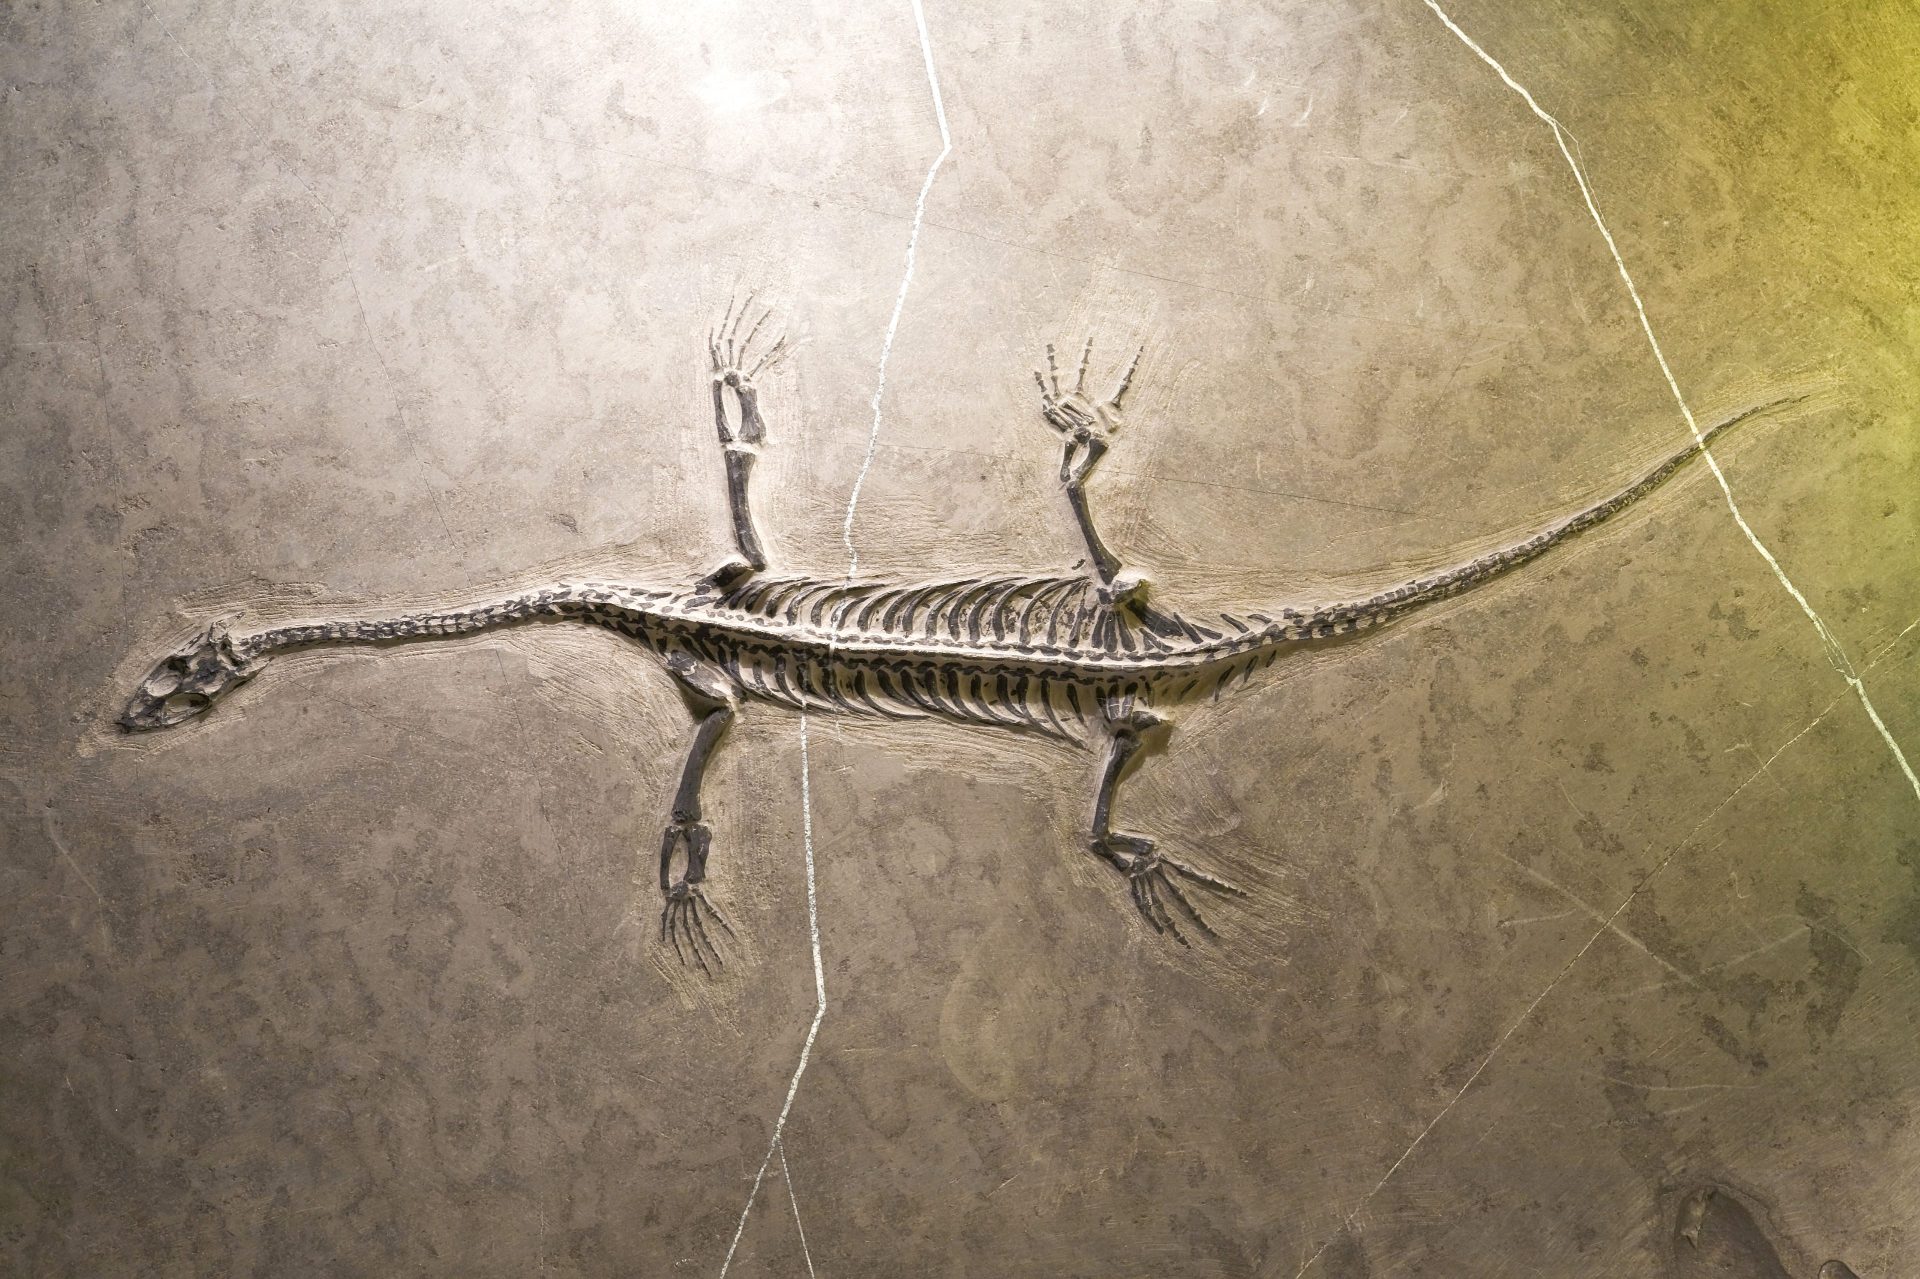
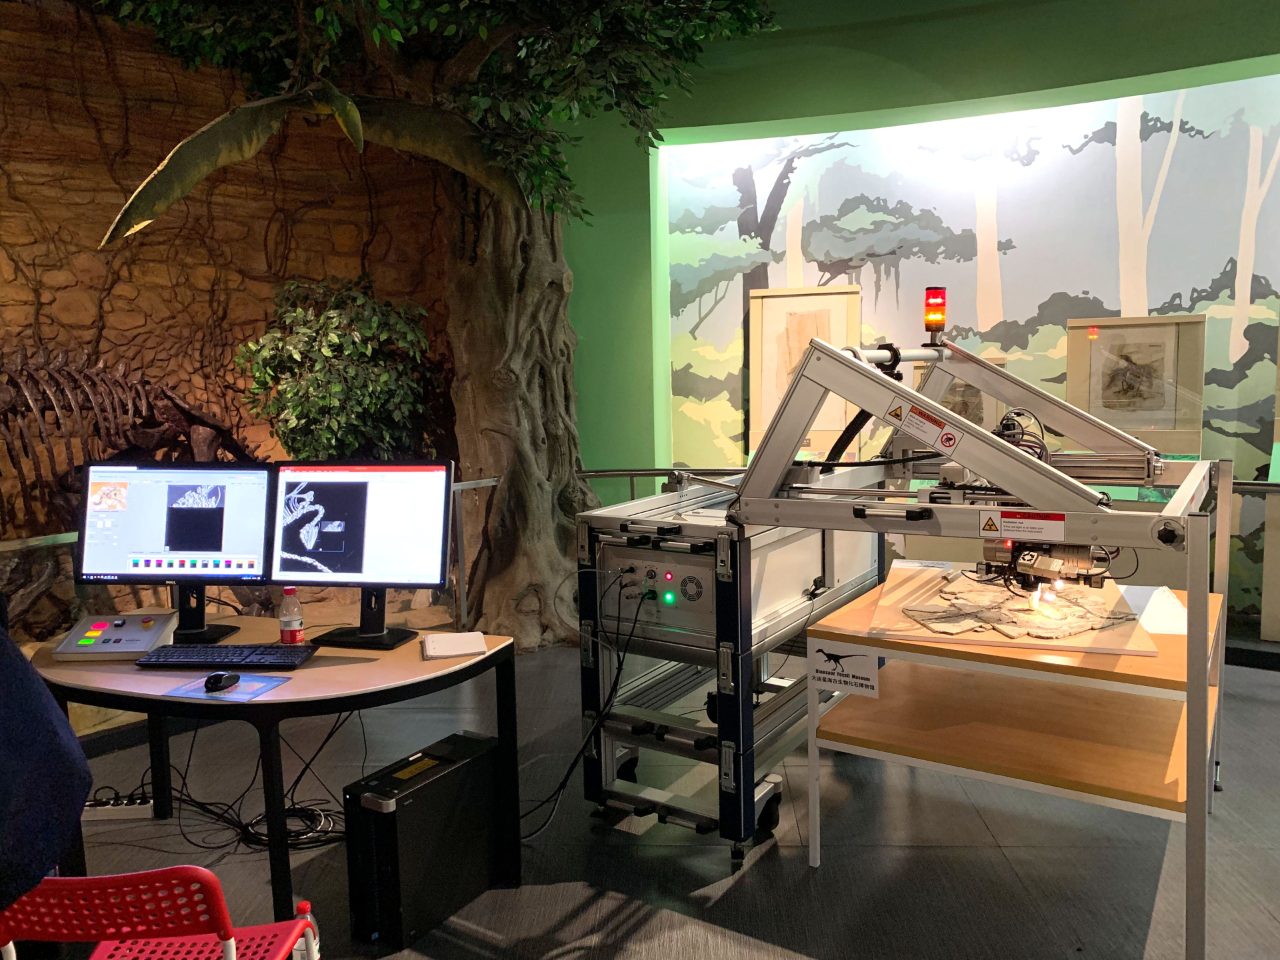
X-Ray Fluorescence microanalysis (µXRF or micro-XRF) is based on secondary fluorescence generated when an incident X-ray interacts with atoms and dislodges electrons from inner electron shells. The resulting rearrangement of electrons produces secondary X-rays of characteristic energy patterns that are measured by a detector. Conventional XRF has been used for quantitative compositional analysis since the 1920s. The addition of polycapillary X-ray optics allows the incident X-ray beam to be focused with high brilliance on a spot down to less than 20 µm. The progressive mapping with this spot enables relative X-ray intensity and quantitative elemental mapping for elements between carbon and uranium. The detection limits of trace elements are particularly attractive with an X-ray source (as opposed to the related electron beam source in EDS spectroscopy). In paleontology and paleobiologic studies this information can be used for detailed analysis of morphologic features defined by elemental changes. Recent work has used elemental analysis of dinosaur plumage, the traces of soft tissue and blood in host rock, and the automatic extraction of fossil features from outcrop scans. This method is particularly attractive for paleontology with the ability to set up a portable open-beam scanning system on a relatively flat outcrop.
Raman Microscopes
The foundation of Raman spectroscopy is based on the Raman effect. When a monochromatic light (typically a laser) is directed at a sample the photons from the laser will interact with molecular vibrations. Most of the light will be scattered at the same frequency as the incident light, called Rayleigh scattering. A small portion of the scattering will have a frequency shift related to a transfer of energy to the molecule (Stokes scattering) or a loss of energy by the molecule encountered (anti-Stokes scattering), a phenonium called Raman scattering. The changes in energy, called a Raman shift, are related to a specific molecular vibration and represent elements and how they bond in the sample. In paleontology Raman data is excellent for the investigation of organic matter preservation in fossils. This data has been used to study the ancient structure and function of life dating as far back as the Proterozoic.
Related publications:
- Alencar, Wemerson J., F. Eroni P. Santos, Juan C. Cisneros, João H. da Silva, Paulo TC Freire, and Bartolomeu C. Viana. "Spectroscopic analysis and X-ray diffraction of trunk fossils from the Parnaíba Basin, Northeast Brazil." Spectrochimica Acta Part A: Molecular and Biomolecular Spectroscopy 135 (2015): 1052-1058.
- Peresani, Marco, Marian Vanhaeren, Ermanno Quaggiotto, Alain Queffelec, and Francesco d’Errico. "An ochered fossil marine shell from the Mousterian of Fumane Cave, Italy" PLoS One 8, no. 7 (2013): e68572.
FTIR Microscope
Fourier-transform infrared (FTIR) spectroscopy imaging uses an IR source to excite chemical bonds. The provided absorption information from the sample is specific to a functional group: for example, C=O or C-H. FTIR reflectance can be used to directly analyze fossils, particularly when combined with light microscopy. In this method, the IR at each sampling point is measured and instigated into a spectrum so bands can be defined and visualized. These microscopes are widely used in materials analysis, forensics and manufacturing quality control. The coupled FTIR and light microscopy is used in paleontology specifically to detect and visualize the secondary signature of proteins in fossils. Previous work has focused on imaging reptile skin, porosity in fossilized bone and the measurement of melanin.
Related publications:
- Wöss, C., S. H. Unterberger, G. Degenhart, A. Akolkar, R. Traxl, V. Kuhn, M. Schirmer, A. K. Pallua, R. Tappert, and J. D. Pallua. "Comparison of structure and composition of a fossil Champsosaurus vertebra with modern Crocodylidae vertebrae: A multi-instrumental approach." Journal of the Mechanical Behavior of Biomedical Materials 104 (2020): 103668.
- Iniesto, Miguel, Christophe Thomazo, Emmanuel Fara, and Paris Biota Team. "Deciphering the exceptional preservation of the Early Triassic Paris Biota (Bear Lake County, Idaho, USA)." Geobios 54 (2019): 81-93.
EDS on SEM or TEM
Energy-dispersive X-ray spectrometry microanalysis (EDS or sometimes EDX) can be incorporated into Scanning Electron Microscopes (SEM), Transmission Electron Microscopes (TEM) and Electron Microprobe Analysis (EMPA); for elemental mapping or quantified elemental analysis. EDS utilizes the same principal as micro-XRF, except the source is a focused electron beam. This is one of the most widely known technologies for chemical imaging of fossils. The X-ray signal is emitted from the point of interaction of the electron beam with the spot size being that of the beam. This electron beam has less information depth than micro-XRF, meaning only the surface is imaged.
For SEM, samples must be prepared with conductive coatings such as gold and carbon, and imaging is improved with polishing. TEM requires collecting a thin foil from the sample so the electron beam may pass through the sample, enabling atomic-scale resolution. Some recent advances in EDS imaging may open new opportunities for analysis of paleontological specimens:
- Bruker’s FlatQUAD technology enables analysis of samples with low beam current and in low vacuum environments, enabling the analysis of sensitive samples and those with high topography
- High-speed large area mapping with quantification can provide detailed elemental concentration information over large areas
- Automated mineralogy software can automate data collection and mineral ID, producing high-resolution mineral maps
Electron Backscatter Diffraction (EBSD) and Transmission Kikuchi Diffraction (TKD)
EBSD is a common SEM-based technique that allows characterization of the microstructure of crystalline materials. The sample must be well polished and placed at 70⁰ tilt to generate strong backscattered signal. At each point of interaction between the beam and the sample some backscattered electrons exit at specific Bragg angles and diffract, forming Kikuchi lines for each crysta llattice plane. These diffracted electrons collide with a phosphor screen that converts them into photons, producing Kikuchi diffraction patterns. The pattern is detected by a CCD or CMOS camera, digitized and analyzed by software. By recording and indexing this pattern and repeating this process in a matrix, the system maps the crystal structure and orientation distributions of a sample. Simultaneous EDS/EBSD measurements allow retrieval of quantitative information about the phase distribution, strain localization and grain metrics.
EBSD can be used with any type of scanning electron microscope (tabletop, W-SEM, FEG-SEM and FIB-SEM). TKD technique is similar but can reach nanoscale resolution (> 2 nm) by using the EBSD hardware on electron transparent samples. It is also suitable for beam sensitive samples.
For paleobiologic studies, EBSD is used for:
- Identifying mineral polymorphs in-situ and related mineralization and alteration to biological structures
- Primary and secondary minerals can be identified and differentiated, particularly the ability to differentiate calcareous biomineralization from the chemically identical replacement phases
- Delineate diagenetic mineralization that can distort original structures and features
- Describe features of biomineralization, such as shell micromorphology