Genomics Research
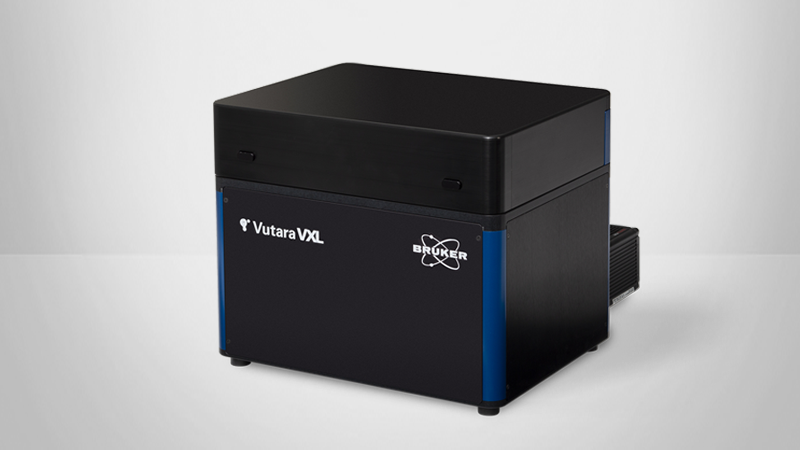
Imaging the Genome in 3D with Vutara VXL
The three-dimensional organization of chromosomes plays a key role in chromosomal function and gene expression. Chromosomes exhibit structural differences on a regional basis, both within and between chromosomes. Understanding these structural differences likely will prove useful in understanding chromosomal function in both normal and pathological states. Chromosome conformation capture assays, based on proximity-based ligation, generally use ensemble-sequencing techniques to provide an average structure of the genome from millions of cells. This provides a good overview of DNA organization in the average cell. The Bruker VXL platform enables visualization of three-dimensional chromosome structure at single cell, as well as sub-cellular levels. Visualizing genomic organization and structure on a sub-chromosomal level is necessary for understanding relationships between genes and their environment.
Key features that make Vutara VXL an ideal genomic imaging platform:
- 3D localization with patented biplane technology – each image plane encompasses a 1 μm thick slice
- Extended axial range by Z series – scan through an entire nucleus with imaging depths of up to 30 µm in cells
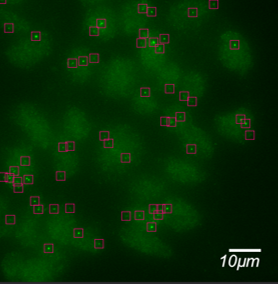
- Multi-location capture of multiple nuclei
- Widefield workflow for non-single molecule chromatin walking applications
- Enclosed system – can be used in an open lab environment
OligoSTORM and OligoDNA-PAINT
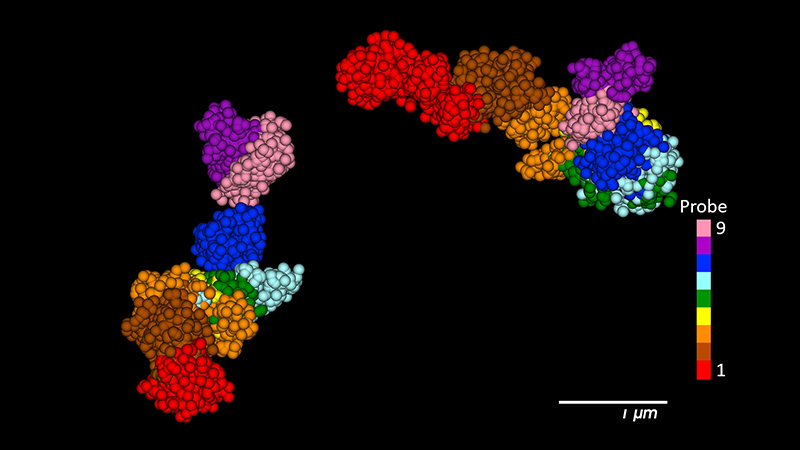
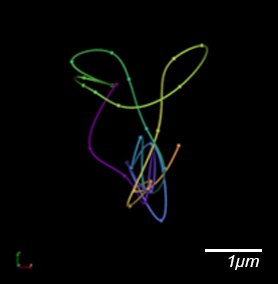
Based on the use of OligoSTORM and OligoDNA-PAINT (B. J. Beliveau et al., 2015 and G. Nir et al., 2018), the laboratory of Ting Wu at Harvard University, in collaboration with Bruker, has developed Oligopaints (B.J. Beliveau et al., 2012) based methods for imaging and visualizing DNA sequences in specific chromosomal regions at the super-resolution level using the Vutara platform (view webinar). Specially designed Oligopaint oligonucleotides are hybridized to a chromosomal sequence, and then imaged with localization microscopy, generating volumetric 3D images of the structure of that labeled region. The technology allows the imaging of the genome at distances measured in kilobases to megabases.
References
Chromatin Tracing
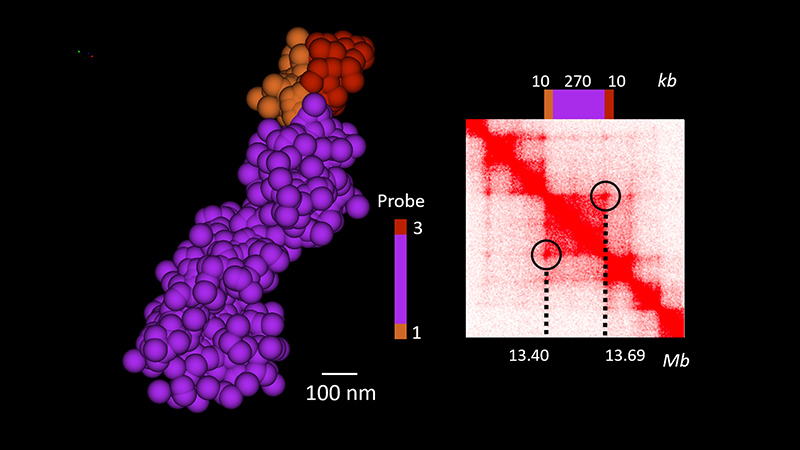
In addition to super-resolution workflows for genomic imaging, the Vutara platform with SRX software is fully capable of performing ORCA (Optical Reconstruction of Chromatin Architecture) experiments from acquisition through analysis. ORCA, originating in the laboratory of Alistair Boettiger at Stanford University, is a widefield genomic imaging technique useful for looking at small genomic regions or single genes with small probe step sizes (2-10 kb). While diffraction-limited, this method provides high sequence resolution by computationally fitting gaussians to the signal from small probe step sizes and allows for high throughput studies due to the faster acquisition of widefield images compared to single-molecule localization data (L. J. Mateo et al., 2019).
References
OligoSTORM and Chromatin Tracing: Complementary Techniques for Genomic Imaging
The Vutara VXL with integrated fluidics is capable of both single molecule imaging based super-resolution microscopy with OligoSTORM and chromatin tracing using ORCA. But when should you use each technique? To understand this we have to understand the background of these techniques. Both techniques use OligoPAINT probes to label regions of the genome and both use sequential labeling of imaging fluorophores to label each point that is needed to be imaged. The major difference is that OligoSTORM uses STORM based single molecule imaging to build up a structure of the region labeled. While ORCA labels a small diffraction limited spot that can be fit by a simple gaussian. The key differences and advantages of both techniques are listed below:
OligoSTORM:
- Step size of 3 kb – megabases
- 2-40 steps covers 3 kb to megabases
- STORM single molecule imaging
- 10-100 cells/ experiment*
- Provides single cell, volumetric information over multiple genomic length scales at high resolution
* cell type dependent
ORCA:
- Step size of 2 kb – 10 kb
- 2-70 steps – typically covers ~100-700 kb
- Widefield imaging
- 100s – 1000s of cells/experiment*
- Provides single cell/population scale, fine-trace information over multiple genomic length scales at high resolution.
* cell type dependent
Comprehensive Visualization and Analysis
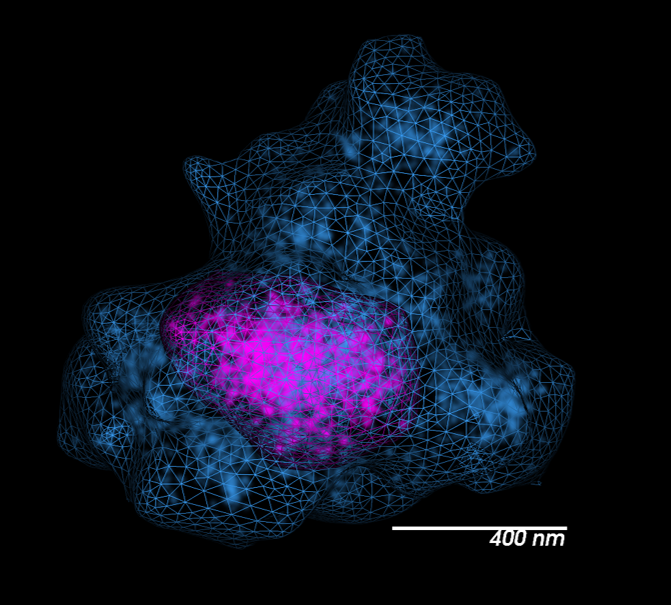
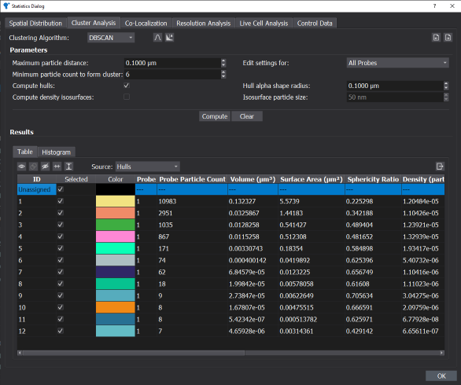
SRX software offers a full suite of data filtering and statistical analysis tools for performing a wide variety of analysis. Clustering algorithms such as DBScan, OPTICS, and Delaunay analysis are available for identifying clusters of genomic data. After clusters are identified, further metrics such as particles in a cluster, volume, sphericity ratio, density of particles and radius of gyration can then be calculated.
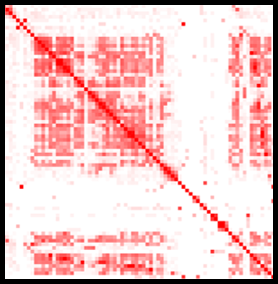
SRX software is also equipped with analysis workflows for automatic image segmentation and reconstruction of ORCA data sets. This includes generation of distance and contact frequency maps similar to Hi-C maps obtained by ensemble chromosome conformation capture techniques.
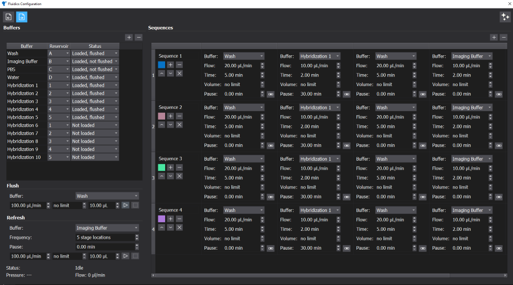
Integrated Fluidics
Imaging the genome via super-resolution or widefield requires labeling a large number of probes, far more than there are spectrally distinct probes available. Thus, these methods rely heavily on sequential labeling strategies. Full integration of fluidics with the Vutara and SRX is available for all sequential labeling needs.
SRX software has been optimized to meet the requirements of this demanding application. A critical step was to implement microfluidics control in order to perform sequential labelling steps. The SRX microfluidics control module allows users to create fluidic sequences containing an unlimited number of buffers and reagents per fluidics step, as well as an unlimited number of steps per experiment. SRX assigns a user defined color for localizations in each step, and during visualization and analysis, the entire data set is merged. An unlimited number of steps can be visualized and analyzed.