3D Imaging with Bi-Plane
TABLE OF CONTENTS:
- Biology is Three-Dimensional
- How to Measure the z-position
- The Depth-of-Field (DOF) in Widefield Microscopy as a Measure for z-resolution
- Total Internal Reflection Microscopy (TIRF)
- Supercritical Angle Fluorescence (SAF)
- Point-Spread Function (PSF) Engineering
- Bruker Vutara Bi-Plane
- Comparing Astigmatism and Bi-Plane Detection
- References
- Talk to an Expert
The Bruker Vutara VXL super-resolution microscope is a powerful tool for 3D imaging of biological samples with sub-diffraction resolution. Unlike other methods, it uses a bi-plane detection technique that divides the focused light into two axially separated object planes and fits the 3D point spread function to localize dye molecules in the z-axis. This technique is unique to the Bruker Vutara VXL and has several advantages over other methods, such as:
- Enables 3D sub-diffraction resolution without compromising speed or sensitivity.
- Allows the acquisition of z-stacks over a large z-range, more than 50 µm deep into a sample.
- Facilitates imaging deep within tissue slices, which is important for studying cellular and tissue structures in three dimensions.
Bi-plane detection is more robust and accurate than astigmatism-based localization, which has a variable xy resolution and a limited z-range. It is also more flexible than TIRF and SAF, which can only image structures near the coverslip.
Bi-plane detection can be used for various neuroscience and cell biology applications, such as imaging synapses, dendritic spines, axons, glia cells, mitochondria, endoplasmic reticulum, nuclear pore complex, centrioles, and chromatin domains in different cell types. This article describes how Bruker implemented the bi-plane detection technique in their Vutara VXL super-resolution microscope and compares it to less powerful methods to achieve sub-diffraction resolution in 3D.
Biology is three-dimensional
All cells, cell colonies, organoids, and tissue slices extend from the microscope coverslip into the third dimension differently. For example, an E. coli bacterium has a diameter of about one µm [1] (Figure 1). HeLa cells spread thinly on coverslips and are a few µm high, but human stem cells growing in a colony can be 10-20 µm tall. Organoids are typically 0.5 mm in diameter, but some can reach a 3 -5 mm diameter while tissue slices are often 100 µm thick (Figure 2).
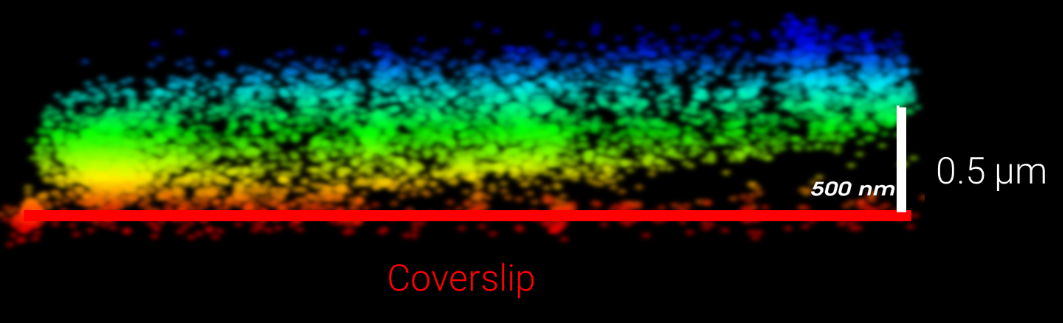
In most biological microscopy experiments, researchers are interested in structures far away from the coverslip within cells and tissues and their dimensions in x, y, and z. How deep within a biological system can be imaged depends on the illumination method. TIRF microscopy (total internal reflective fluorescence) is limited to about 100 nanometers off the coverslip, and HiLo sheet illumination (highly inclined laminated optical, [2]) can reach up to 5 µm into a sample. The Bruker Vutara VXL uses widefield illumination where scattering inside the tissue limits the imaging depth. In most cases, researchers can image more than 50 µm deep into a sample with this super-resolution technology (Figure 3).
Single-molecule localization microscopy (SMLM) works by determining the position of individual dye molecules that label structures of interest. The following paragraphs discuss different methods to determine the localization of a dye molecule along the optical axis above the coverslip, also known as the z position.

How to Measure the z-position
The Depth-of-Field (DOF) in Widefield Microscopy as a Measure for z-resolution
The wave nature of light limits the resolution of a microscope due to diffraction. The resolution depends on the objective's numerical aperture (NA) and the wavelength of the light used for imaging. The high-end objective in the Vutara VXL can distinguish details about 200 nm to 300 nm apart in xy and separated by ~700 nm in z [3]. A helpful way to understand diffraction limits is to examine the point-spread function (PSF) of a sub-resolution light emitter like a dye molecule (~3 nm) or a 100 nm bead (Figure 4).
Two objects can be distinguished in a light microscope only if their PSF overlaps so far that the added intensities have a visible dip between them. In xy, the ring pattern of the Airy disk is often used to illustrate this fact, while in z, the concept of depth-of-field is used.
Focusing on two objects enables the measurement of their distance along the optical axis, perpendicular to the coverslip. When using a well-calibrated fine focus drive (e.g., a piezo drive used in the Vutara VXL), the difference between the focus positions is identical to the z-distance between the objects as long as the refractive index of the mounting medium matches the immersion medium. Otherwise, researchers must use a correction factor based on the refractive index of the medium and immersion oil.
Total Internal Reflection Microscopy (TIRF)
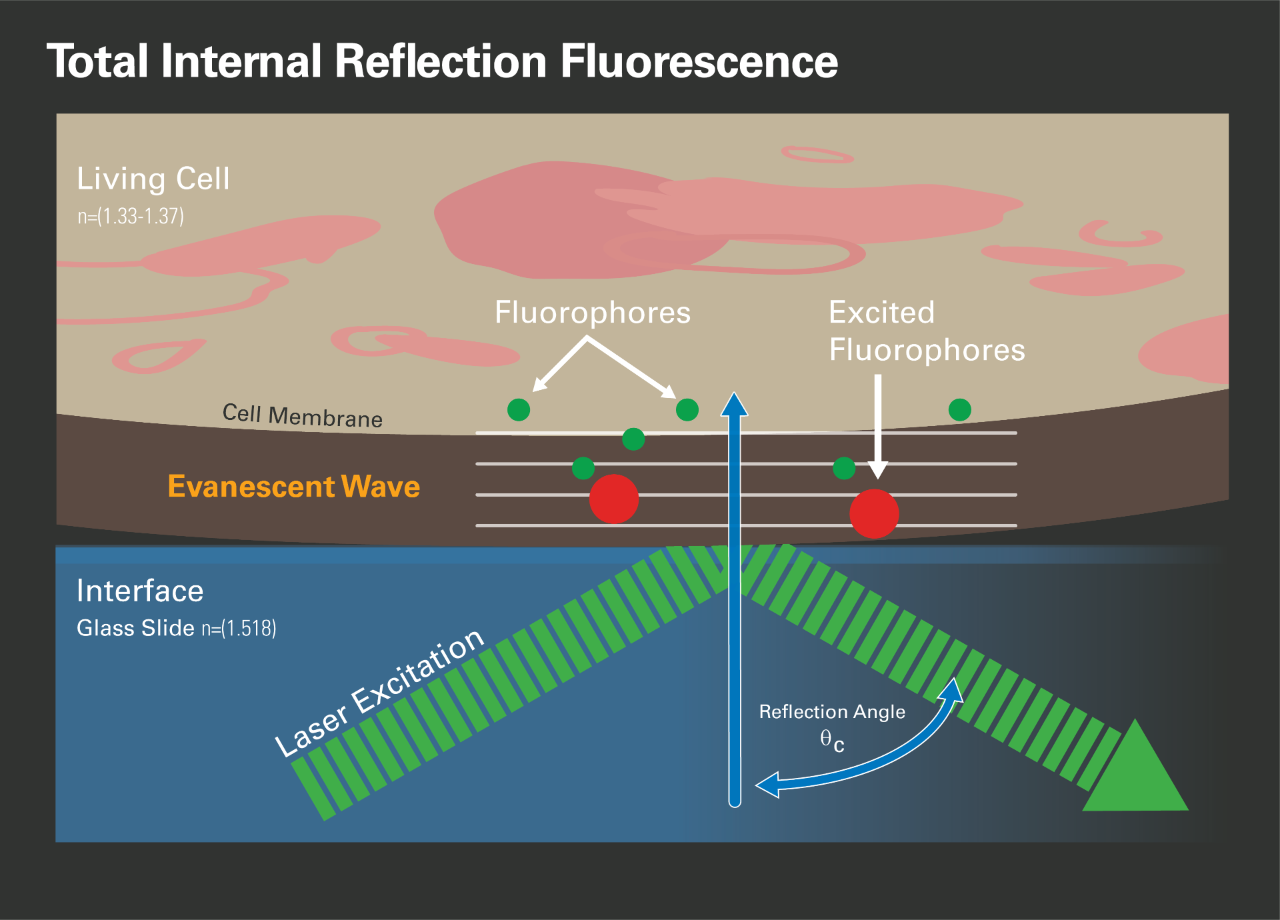
In the early 1980s, Daniel Axelrod developed total internal reflection microscopy (TIRF, [4]). Suppose light travels from a material with a high refractive index (e.g., glass) to a low refractive index (e.g., buffer solution or cellular cytoplasm). In that case, the light is refracted away from the optical axis according to Snell's law. If the angle between the optical axis and the incoming light grows beyond the critical angle, all light is reflected into the material with the higher optical index and only the evanescent field penetrates a few hundred nanometers into the other medium. The intensity decays very fast and follows an exponential law that Axelrod used to limit the excitation of fluorescence dyes, lableing cellular structures, in contact with the surface of the glass cover slip. The advantage of this approach is that all cellular components more than a wavelength above the glass surface are invisible and do not contribute to background fluorescence. Because this makes it easier to detect single molecules, early implementations of SMLM microscopes used TIRF, with the acknowledged disadvantage that this setup can not image internal cellular structures.
Because of the fast decrease of the evanescent field with z, it is possible to determine the distance of a dye molecule from the surface based on its intensity. In practice, such an experiment requires a very challenging calibration, and practical implementations rely on measurements using laser beams with different refractive angles. This approach is too slow for SMLM experiments.
Supercritical Angle Fluorescence (SAF)
Supercritical Angle Fluorescence (SAF) is a near-field effect that occurs when a fluorophore is near an interface with a higher refractive index, such as the microscope coverslip [5]. The intensity of SAF strongly depends on the distance of the fluorophore from the interface and decays near-exponentially with the distance on the scale of 100 nm. To reliably extract the z positions of fluorophores, their undercritical angle fluorescence (UAF) has to be collected simultaneously and used for normalization. An advantage of this approach is that the extracted z coordinates report the absolute distance of the fluorophore from the coverslip. The main drawbacks are that the xy resolution varies with the distance from the coverslip, and the approach works only in a narrow z-range like TIRF.
Point-Spread Function (PSF) Engineering
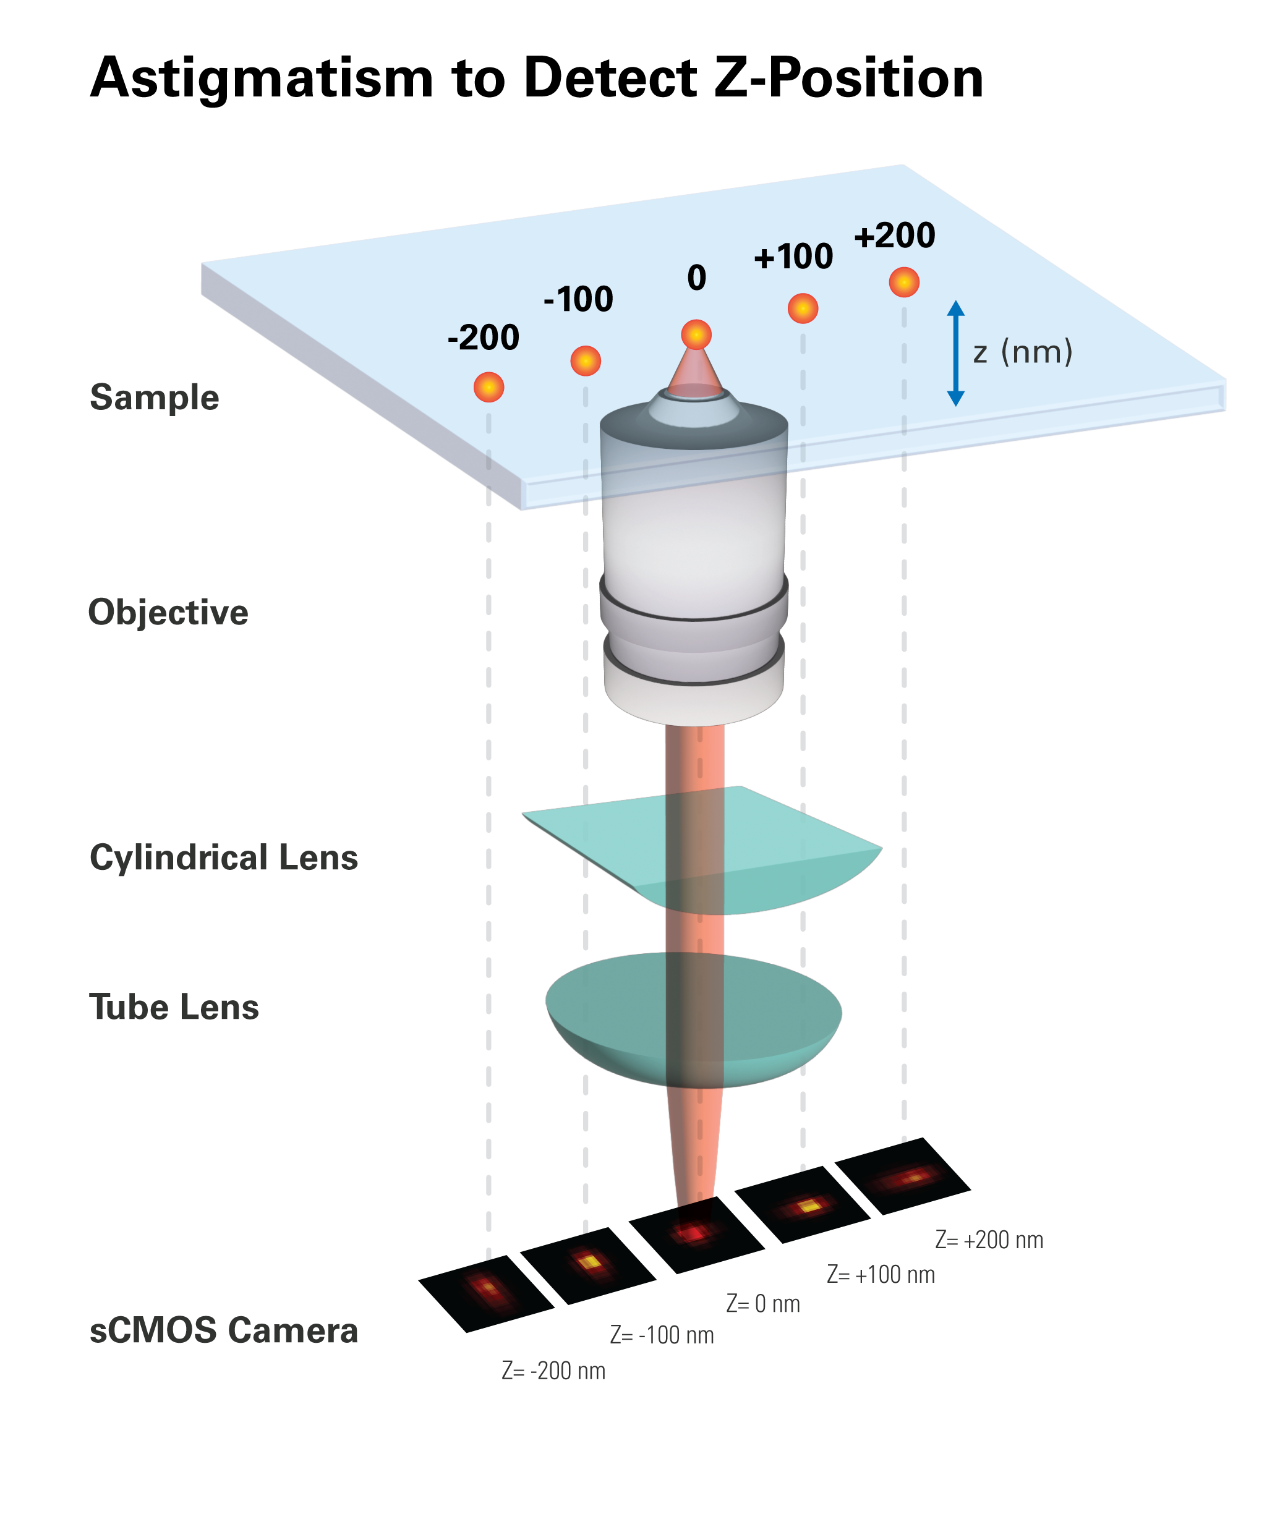
In the most common point-spread function (PSF) engineering approach, a weak cylindrical lens is introduced into the imaging path to creating two slightly different focal planes for the x and y directions (Figure 6) [6]. The cylindrical lens introduces astigmatism that elongates the PSF above and below the focal plane in different directions. As a result, the ellipticity and orientation of a fluorophore's image vary as its position changes in z. By fitting the image with a 2D elliptical Gaussian function, the x and y coordinates of peak position as well as the peak widths wx and wy are obtained, which in turn allows the z coordinate of the fluorophore to be unambiguously determined. To experimentally generate a calibration curve of wx and wy as a function of z, single molecules are immobilized on a glass surface and imaged to determine the wx and wy values as the sample is scanned in z. In 3D STORM analysis, the z coordinate of each photo-activated fluorophore is then determined by comparing its image's measured wx and wy values with the calibration curves.
Bruker Vutara Bi-Plane
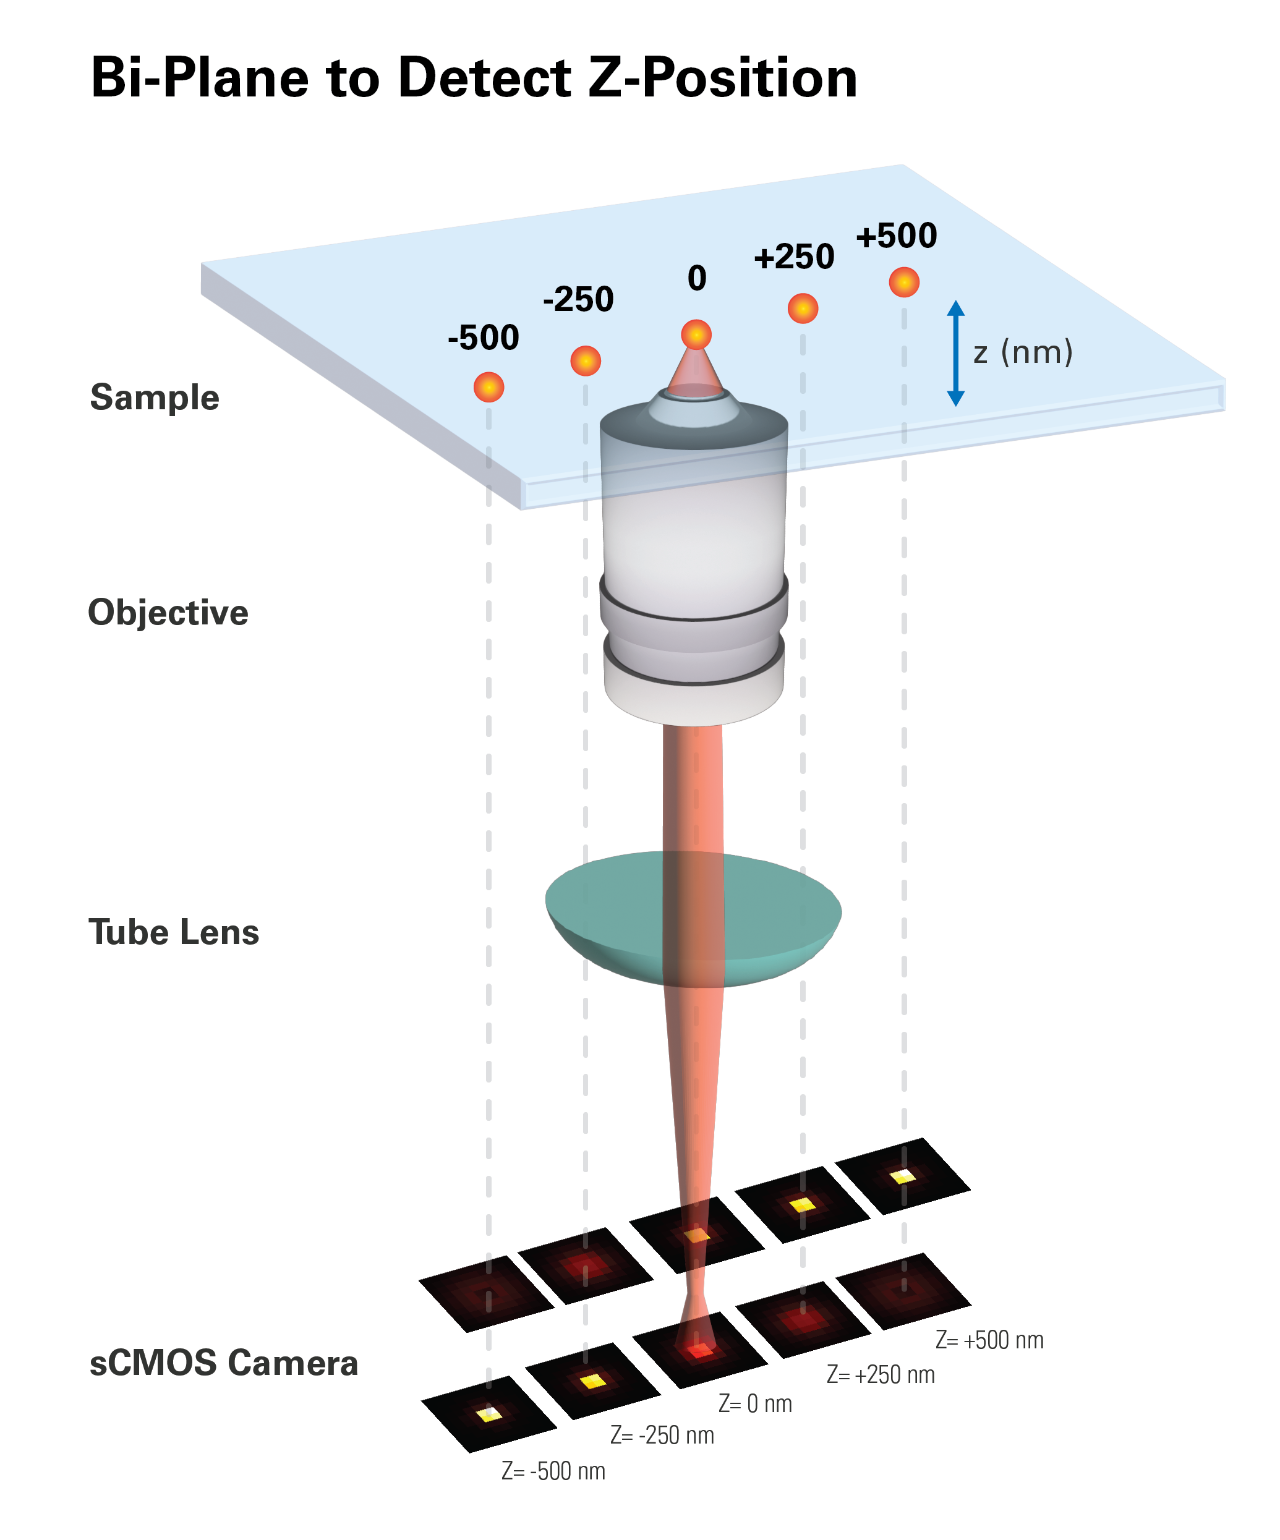
Bruker Vutara super-resolution microscopes use a bi-plane detection technique to localize an emitter in the z-axis (Figure 7). This method is more robust and flexible than the approaches described above, allowing for imaging at greater depths, even inside tissue slices. In this scheme, a 50:50 beam splitter cube divides the focused light in front of the camera into a transmitted (shorter) and a reflected (longer) path, which is redirected toward the camera. The transmitted and reflected beams form images on different regions of the detector, representing object planes further away and closer to the objective than the original object plane. This setup allows simultaneous detection from two axially separated object planes, enabling 3D sub-diffraction resolution without compromising speed or sensitivity. The difference in intensity for an emitting dye molecule on the two imaging planes defines its z-position [7].
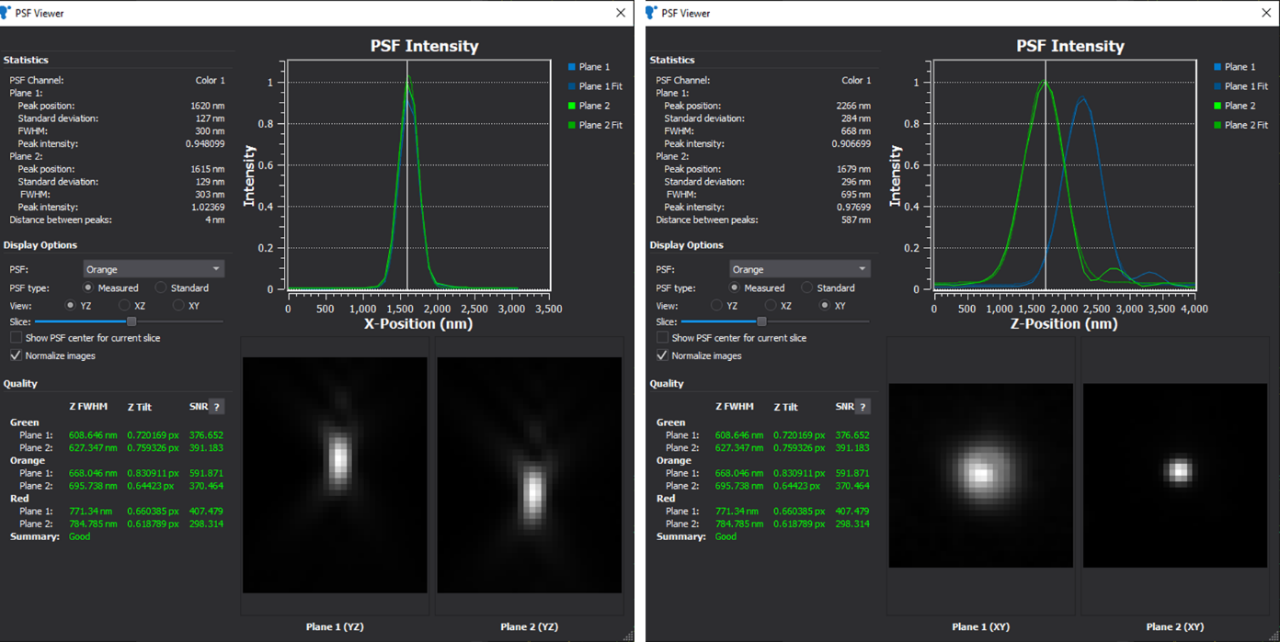
In the bi-plane detection technique, instead of using a Gaussian function, an experimentally obtained 3D point spread function (PSF) is fit to each dataset consisting of the pixels around each detected probe molecule. This allows for the determination of the molecule's x, y, and z coordinates. The PSF is determined independently by imaging a small fluorescent bead as a function of the z-dimension position of the sample relative to the objective. Using two detection planes for z-position determination is generally sufficient for particle localization under certain constraints. These constraints include that the distribution of particles is sparse (meaning there is no overlapping signal within the size of one PSF) and that the axial position of the particle is close to one of the detection planes or lies between them.
Comparing Astigmatism and Bi-Plane Detection
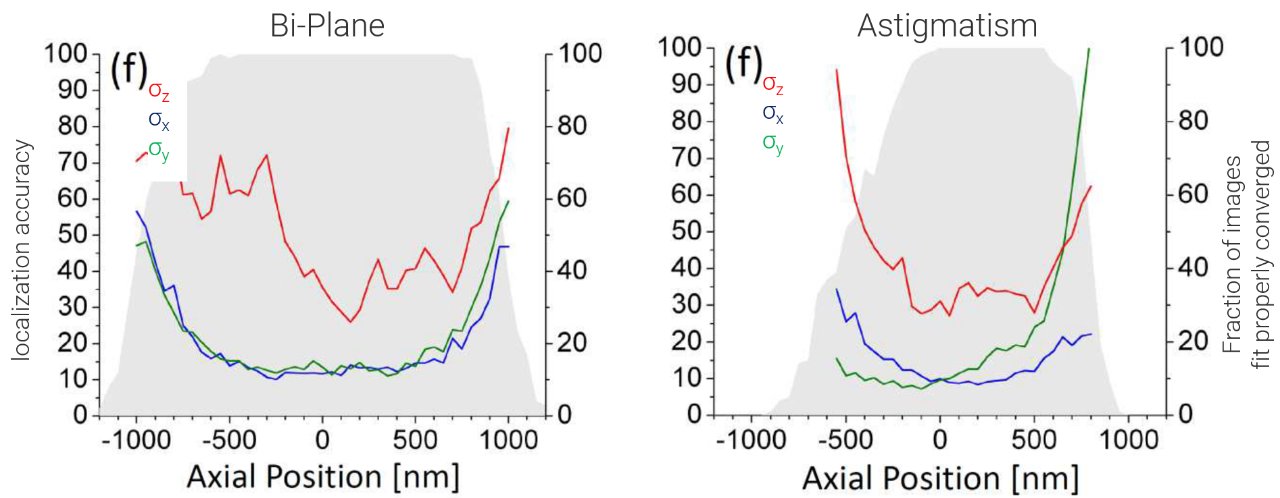
The main advantage of using astigmatism to determine the z-position of an emitter is its simplicity. However, bi-plane detection is more robust and allows for imaging deeper within a biological sample. The localization accuracy in the xy plane for astigmatism-based localizations changes differently for x and y based on the z-position due to the unsymmetrical point spread function (PSF). Generally, bi-plane detection is more robust and works over a larger z-range (Figure 8).
References
- Cell Biology By The Numbers. 03/09/2023; Available from: http://book.bionumbers.org/.
- Tokunaga, M., N. Imamoto, and K. Sakata-Sogawa, Highly inclined thin illumination enables clear single-molecule imaging in cells. Nature Methods, 2008. 5(2): p. 159-161.
- Optical Microscopy Primer. Available from: https://micro.magnet.fsu.edu/primer/index.html.
- Axelrod, D., Cell-Substrate Contacts Illuminated by Total Internal Reflection Fluorescence. The Journal of Cell biology, 1981. 89(1): p. 141-145.
- Dasgupta, A., et al., Direct supercritical angle localization microscopy for nanometer 3D super-resolution. Nat Commun, 2021. 12(1): p. 1180.
- Huang, B., et al., Three-dimensional super-resolution imaging by stochastic optical reconstruction microscopy. Science, 2008. 319(5864): p. 810-3.
- Juette, M.F., et al., Three-dimensional sub-100 nm resolution fluorescence microscopy of thick samples. Nature Methods, 2008. 5(6): p. 527-529.
- Mlodzianoski, M.J., et al., Experimental characterization of 3D localization techniques for particle-tracking and super- resolution microscopy. Opt Express, 2009. 17(10): p. 8264-77.