A standardized NMR solution to support Biobanks’ Challenges
Biobanks
need standardization!
- Stringent and standardized quality control on sample input which enables to characterise their samples in an effective way. With the B.I.BioBankTool 1.0, NMR can validate if newly incoming samples fulfil quality requirements for storage in the biobanks
- Highly standardized and high-Quality spectra generation offer a substantial value add for biobanks. In fact , by using Bruker SOPs (B.I.Methods, used on IVDr Platform), biobanks benefit from the outstanding NMR reproducibility and transferability and achieve compatibility with all biobanks worldwide applying the same SOPs
- Standardization is needed also on the Quality of specimens. Bruker has developed a comprehensive tool to check the quality of urine, plasma and serum samples before entering the biobank.
- Additional relevant analysis results can be generated from the QC measurement. These are Lipoprotein Subclass Analysis on plasma/serum (B.I.LISA 1.0) and quantification of a large number of metabolites in plasma/serum (B.I.QUANT-PS 2.0)/urine(B.I.QUANT-UR 1.1). If a new analysis is available, retrospective analysis can be done without remeasuring the sample.

Level 2 - Bruker IVDr Methods: B.I.Methods 2.0
As you are surely aware, there is a strong need for standardization, guaranteeing highest spectral performance, reproducibility and transferability of routines used. This defines, what our level 2, the B.I.Methods 2.0 has to ensure. The following features are integral part of the procedures
Preanalytics
Advice on sample collection, storage and transfer to magnet
SOP for sample preparation for 3 and 5mm tubes
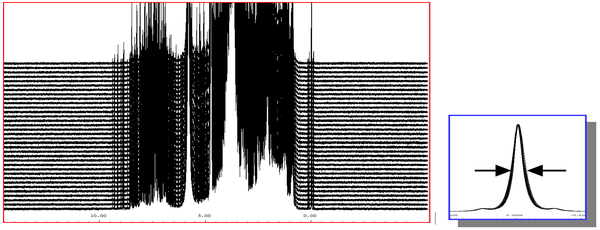
Spectral properties
Generated under fully automated data acquisition and processing conditions
Flat baseline without any offset
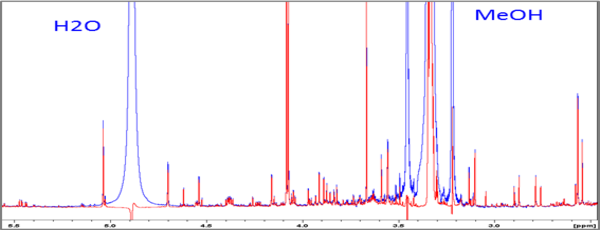
High quality signal suppression for water and methanol at low presaturation power
90 degree pulse and presaturation power are adjusted for every sample, the latter making sure, if integral correction factors are need for signals close to solvent lines being suppressed, they are always the same
Automatic transfer of optimized parameters to the 2D-Jres experiment done on every sample
Residual solvent signals are always in phase with all non-suppressed signals
Automatic phase correction works without errors
Daily QC samples to ensure integral calibration, absolute temperature and solvent suppression are correct and integral value for 1 proton is stored in the dataset
QC reports for every sample
Based on the spectra obtained with B.I.Methods 2.0 (available on Avance III HD or Avance Neo with Windows Operating System), the following enablings Tools (Layer 3) can be applied
As you can imagine, such routines can also be of importance for best performance in other applications you run in Water or Methanol. So you can multiply benefit here.
For more information and examples on the B.I.Methods 2.0:
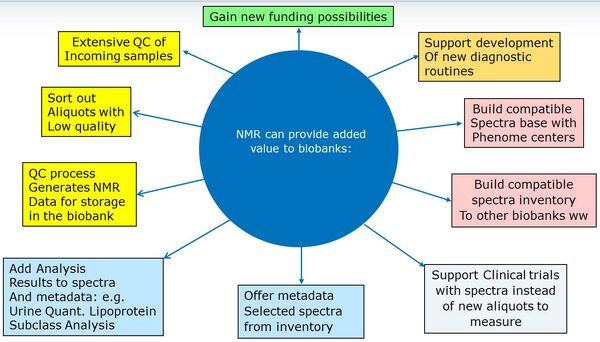
Level 3 – Bruker IVDr BioBank Tool
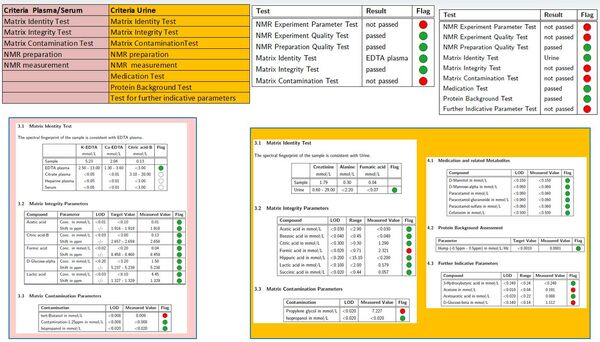
B.I.BIOBANK-TOOL
NMR analysis is a sensitive and specific tool for biobank QC. As it is also completely standardized, it strongly supports the high need for standardization in biobanks. A biobank should only contain high quality specimens to justify the storage cost. It is vital to be able to have as much information on each aliquot as possible to avoid any wrong conclusions in biobank based clinical trials or research studies. The IVDr Biobank tool generates 36 parameters e.g. for urine QC, it checks for wrong labeling of samples, for unreported drug treatment, high protein content in the urine and fasted or non-fasted state, just to mention a few.
In addition to the QC part, NMR can deliver added value for the biobanks. Whenever a QC test is done through the IVDr platform, a spectrum is available, that can also be transferred to the biobank metadata. Having spectra allows to run the quantification tools ( B.I.LISA and B.I.QUANT-PS 2.0 for plasma/serum and B.I.QUANT-UR for urine) and the results thereof can be added to the biobank as well. The potential of this can be imagined easily, when multiple biobanks work along the IVDr SOPs and store spectra and quantification results, as these data are completely standardized and can be exchanged with other biobanks worldwide.
Quantification results are available as follows and can be ordered as package together with the B.I.Biobank-Tool
Plasma/serum:
- B.I.LISA lipoprotein parameters including subclass information
- B.I.QUANT-PS Small molecule quantification
Urine:
- B.I.QUANT-UR basic 50 small molecule endogenous metabolites
- B.I.QUANT-UR extended 150 small molecules endogenous + disease markers (children + adults)
- B.I.QUANT-UR neonate extended 150 small molecules endogenous + disease markers (newborns) + non-targeted statistical classification result compared to healthy newborn model
For more information and examples on the B.I.BIOBANK-TOOL 1.0:
Level 3 - Bruker IVDr Lipoprotein Subclass Analysis: B.I.LISA
Lipoprotein distributions play a major role in cardiovascular risk assessment, while the main fractions
- HDL = High Density Lipoprotein
- IDL = Intermediate Density Lipoprotein
- LDL = Low Density Lipoprotein
- VLDL = Very low Density Lipoprotein
And the typical house doctor`s panel
- Total Cholesterol
- Total Triglyceride
- LDL Cholesterol
- HDL Cholesterol
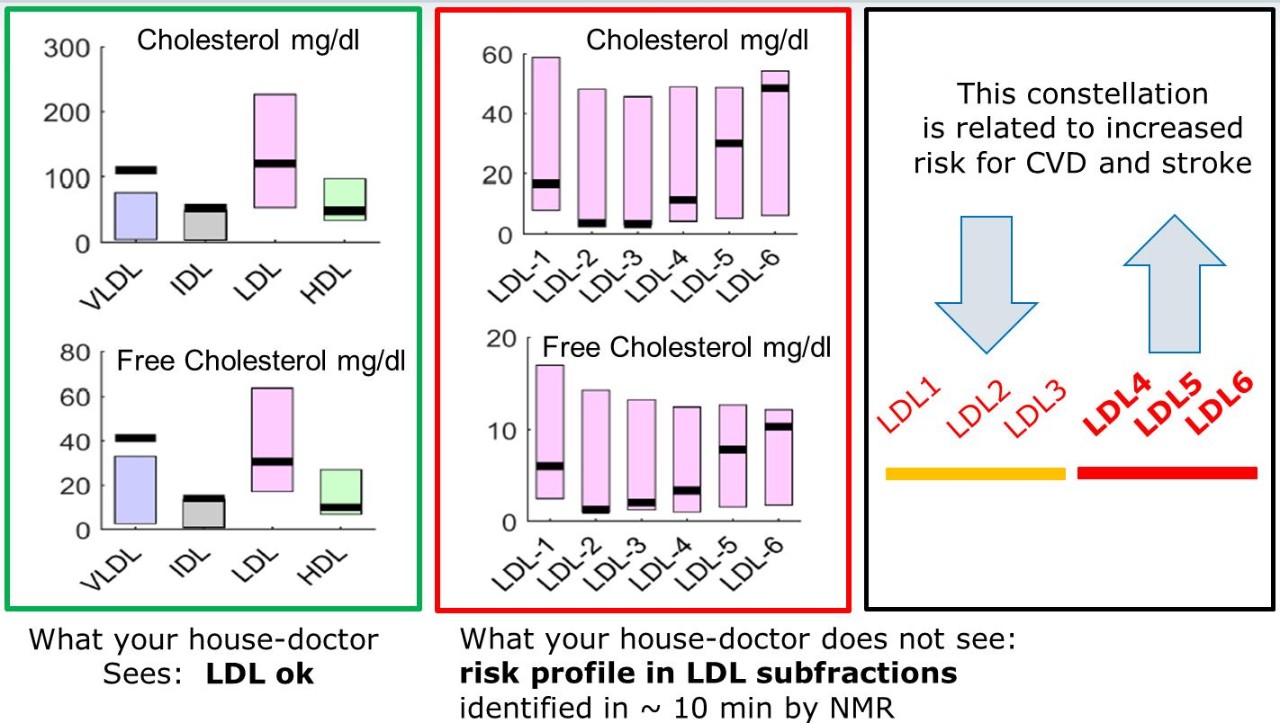
can be readily obtained by conventional analysis, subfractions of LDL, HDL and VLDL is best measured by NMR. In the Literature various publications show, that subfractions, especially LDL and HDL cholesterol, can produce better risk analysis, they are also carry information in various types of cancer.
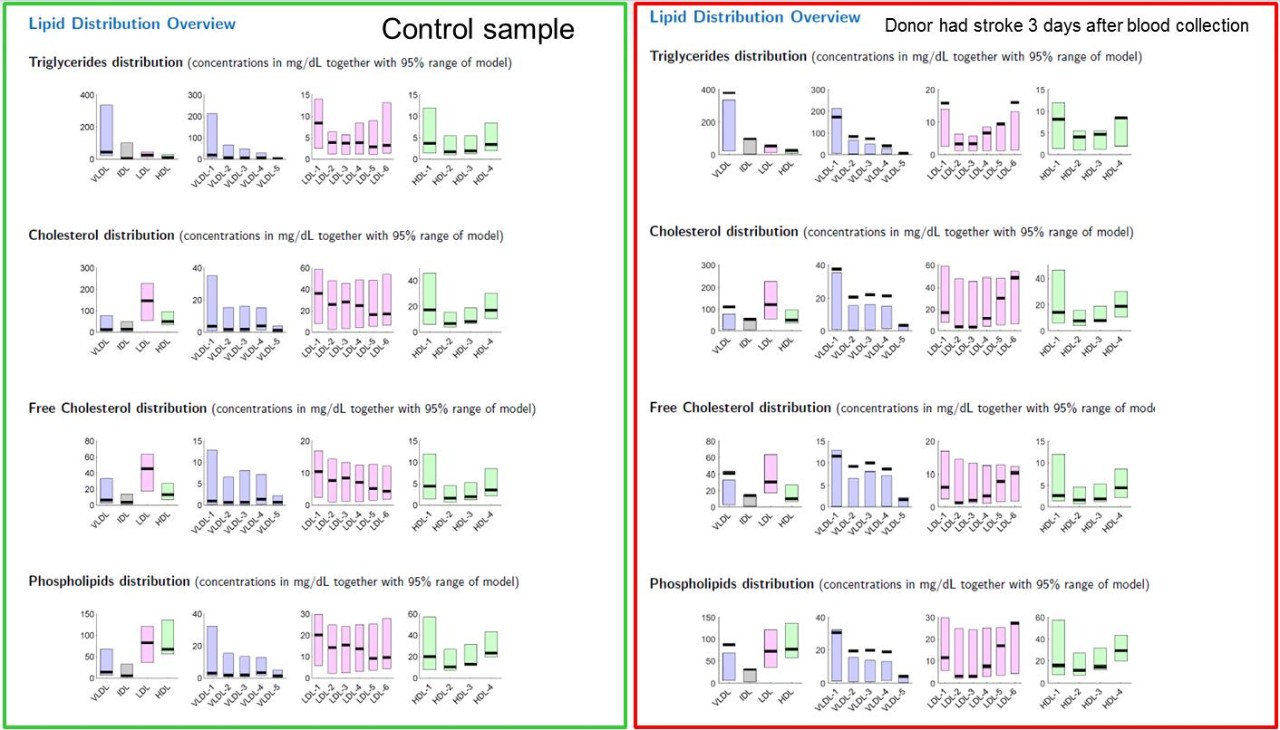
B.I.LISA produces 115 parameters, including e.g. Particle numbers, APO A1, APO B and APO A2, cholesterol, free cholesterol, triglyceride and phospholipid main and subfraction values. The values are obtained by NMR regression training on ultracentrifugation results of a representative human cohort. Ultracentrifugation is considered the gold standard in the subclass analysis, however the total analysis time is about 1 week, while NMR does this in 10 minutes.
Below you can see a typical healthy panel (left side) to a panel obtained from a subject, that had a severe stroke 3 days after sample collection. The grey bars indicate the reference range in the cohort used to build the regression model. The black horizontal bar shows the person under test for all parameters.
With exactly the same experiment done for lipoproteins, also small molecules in plasma and serum can be quantified using our B.I.QUANT-PS 2.0 tool.
For more information and examples on the B.I.LISA 1.0:
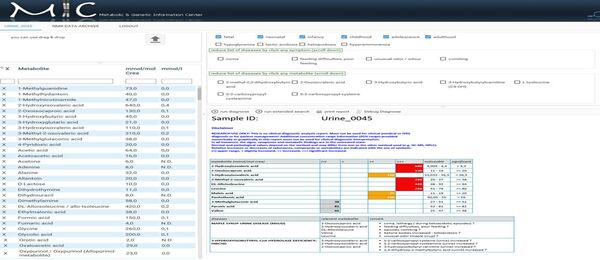
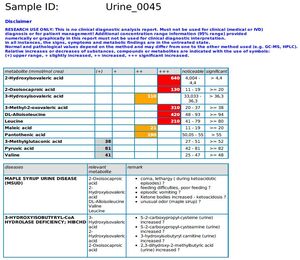
Level 3 - Bruker IVDr Quantification in Urine: B.I.QUANT-UR 1.1
With our new version B.I.QUANT-UR 1.1, routines and validation parameters have been improved and enables now more positive hits. Indeed, the raw concentrations are accessible independent on the LOD and additional quantification result assessment information have been made available in order to be able to judge on quantification reliability.
Fully automated quantification in urine is available on the IVDr platform in 3 versions
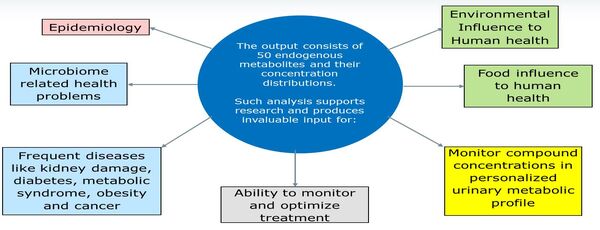
- B.I.QUANT-UR basic: 50 endogenous metabolites
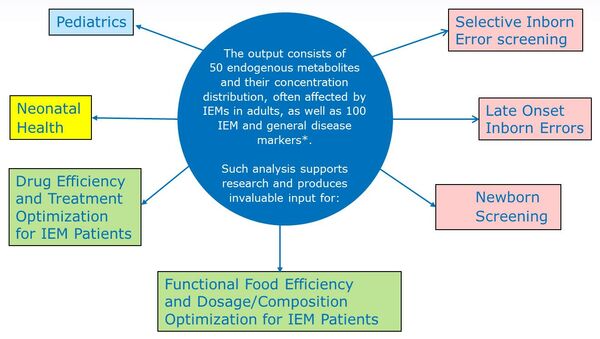
- B.I.QUANT-UR extended: 150 metabolites, thereof the 50 endogenous (contained in the basic version) and additionally 100 disease markers, age range from 6 month to adults
- B.I.QUANT-UR neonate extended: 150 metabolites as in the extended version however selective for newborns, in addition a classification against a healthy normal model of newborns is included
B.I.QUANT-UR basic allows to investigate a multitude of diseases as listed below.
For more information and examples on the B.I.QUANT-UR 1.1:
Level 3 – Bruker IVDr Quantification in Plasma/Serum: B.I.QUANT-PS 2.0 (new)
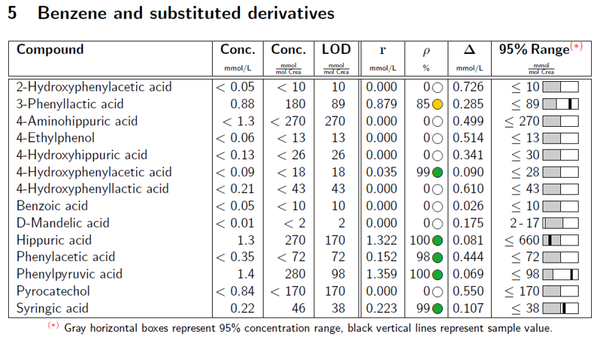
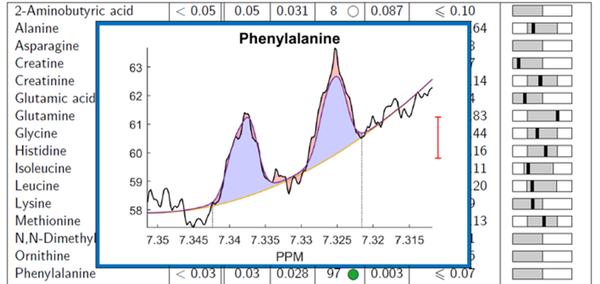
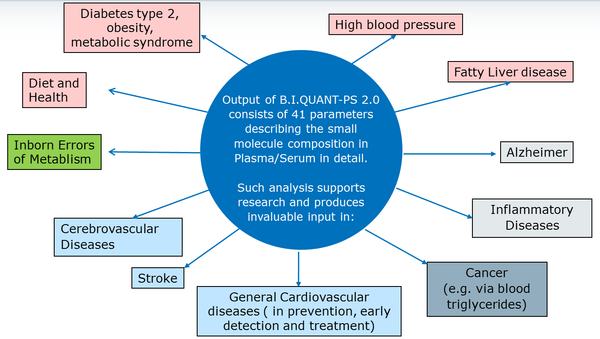
With Version 2.0 41 Metabolites are quantified under full automation from serum and plasma. For each metabolite the reference range as obtained from NMR is shown again with grey bars, the black bar shows the person`s values superimposed. In order to improve our quantification results, we have now introduced the raw concentration (r), which can also be below LOD. TMAO and branched chain amino acids are known to contribute to the risk of cardiovascular disease as well. So with B.I.LISA and B.I.QUANT-PS we offer 2 viewpoints with one experiment and further improved cardio risk analysis is obtained.
An extract showing 1 page of the quantification report including the doubt, an interactive plot can be obtained showing the real spectrumAminoacid part of the quantification is displayed below. In case of doubt, an interactive plot can be obtained showing the real spectrum versus the fit.
All Metabolites have undergone wet spiking according to DIN-ISO norm.
For more information and examples on the B.I.QUANT-PS 2.0:
Level 4 – Bruker IVDr Inborn Error of Metabolism Panel: B.I.IEM Panel
For the 2 extended versions, B.I.IEM-Panel new can be applied on the quantification list. If added as part of the analysis process, the quantification results are transferred automatically to the Bruker version of the Metagene knowledge base, which covers more than 1000 rare diseases and is constantly updated. The output of Metagene to the user consists of a ranked list of diseases, that can be explained by the metabolites identified in outlying concentration ranges. In addition to the disease, the markers and their expected concentrations as well as the clinical symptoms are listed. With this additional automatic step a new level of intelligent analysis is offered.