MetaboScape®
Discover and annotate
with confidence
Explore the digital metabolome landscape
New for 2026b: MetaboScape® neXus
Leverage what you know. Scale what you discover.
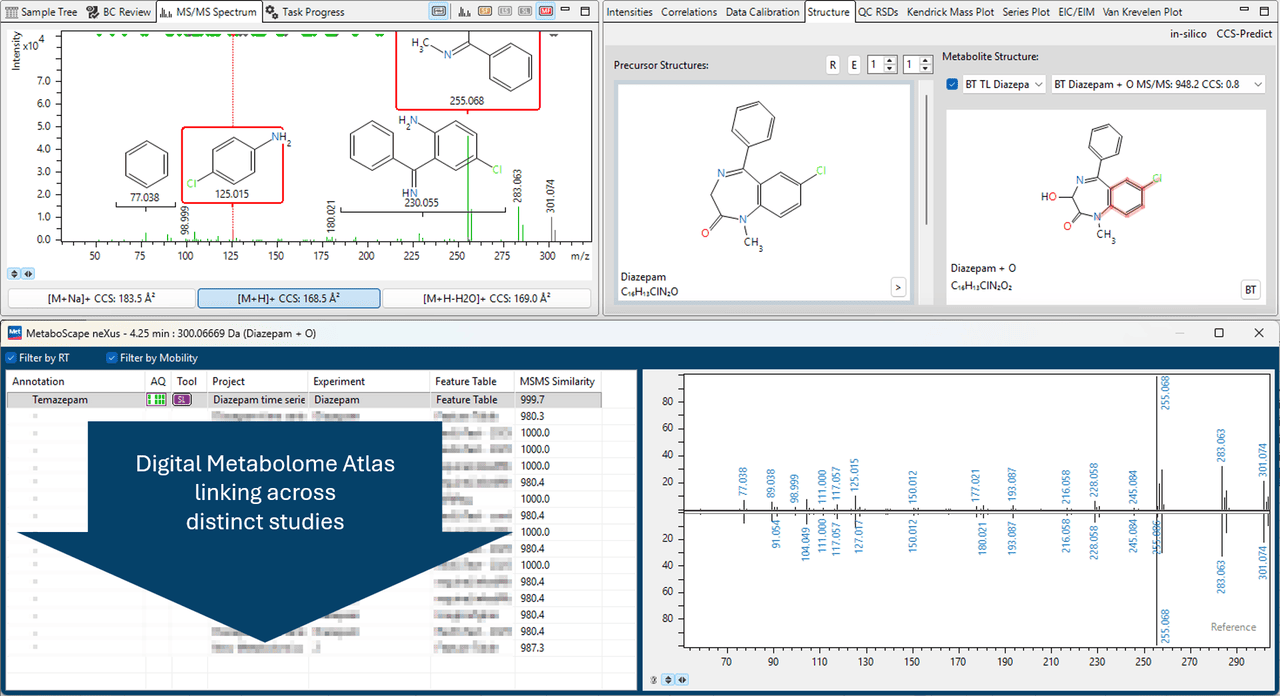
Built on MetaboScape®’s established Compass Server architecture, neXus connects metabolite annotations across studies to transform isolated analyses into a continuously expanding Digital Metabolome Atlas.
Modern metabolomics rarely stops at a single experiment. Over time, laboratories accumulate thousands of features, hundreds of annotations, and dozens of interpretation decisions across recurring matrices, long term studies, and evolving acquisition methods. Use MetaboScape® neXus to automatically search your entire database of all projects for previously annotated features, allowing your current study to both benefit from and contribute to a growing internal knowledge base.
From individual experiments to a living Metabolome Atlas
MetaboScape® neXus operates across a clear conceptual stack:
- Digital Metabolome Archive – a complete record of the bioanalytical information derived from the LC-TIMS-HRMS analysis of a single sample.
- Digital Metabolome Landscape – the comparative metabolomic context within a single study, built from multiple Archives.
- Digital Metabolome Atlas – a cumulative, cross study representation of metabolomic knowledge created by harmonizing annotations across distinct study landscapes.
MetaboScape® neXus is the workflow that creates the connections across this Atlas, linking digital metabolome landscapes from different projects and time points into a unified, growing knowledge base.
Answer the critical question: Have I ever seen this before?
MetaboScape® neXus instantly reveals whether a detected feature has appeared in any previous experiment. By matching key characteristics such as m/z - and, where available, retention time, ion mobility, and MS/MS spectra - neXus links features across all accessible projects to connect today’s results with historical knowledge.
This enables you to:
- Reuse validated annotations from past experiments
- Retrospectively enrich earlier datasets when new annotations become available
- Ensure consistent interpretation across recurring studies, matrices, and acquisition setups
A compound identified today can be traced back across years of experiments - and enriched in a controlled, reproducible way.
Reproducibility by design
Beyond identifying matches, MetaboScape® neXus allows you to reproduce the exact annotation method used in another project, including scoring parameters and tool settings. This ensures analytical consistency across projects, users, and time as your Digital Metabolome Atlas evolves.
Flexible across data dimensionality
MetaboScape® neXus adapts to heterogeneous datasets. Feature matching can be restricted to comparable data dimensions (such as mobility enabled experiments) or deliberately relaxed to allow cross dimensional comparisons between 3D and 4D data - balancing stringency and discovery as required by your study design.
From Archive to Atlas, MetaboScape® neXus leverages what you know so you can scale what you discover.
From acquisition to biological insight
MetaboScape® uses a unified workflow to process non-targeted analyses from Bruker's ESI and MALDI Imaging instruments, simplifying the number of steps and rapidly pinpointing and identifying biomarkers.

MetaboScape® can be used across application areas, including discovery metabolomics, lipidomics, phenomics, foodomics, environmental and pharma and provides users with the flexibility to support workflows ranging from basic ID to advanced statistics.
- MetaboScape®’s powerful T-ReX® algorithm comprises retention time alignment, deisotoping and feature extraction to ensure robust data processing
- Target compounds can be automatically annotated using user defined Analyte Lists
- Unknown ID pipeline including library matching and in silico fragmentation to facilitate unknown ID
- Visualize relevant information in complex data sets using supervised and non-supervised statistics, including PCA, t-test, ANOVA, PLS and bucket correlation analyses
- Annotation Quality (AQ) scoring providing five indicators of data quality
- Pathway mapping to set identified metabolites in a biological context, thereby turning data into knowledge
- Identification of drug and xenobiotic metabolites using local metabolite prediction
- Batch correction to offset sample effects in large sample cohorts
- Time series plots to investigate changes in metabolites over time
- Dedicated lipidomics annotation tools, including rule based annotation, 4D Kendrick mass defect plot and CCS-Predict
- Fully integrated in-silico derivatization automatically generates derivatized structures for target compounds, based on customizable reactions
- To simplify the identification of knowns, MetaboScape® supports the MetaboBASE® Personal Library, HMDB Metabolite Library, the Bruker Sumner MetaboBASE® Plant Library (including CCS values for >130 compounds), as well as custom libraries
- Customized data export to a file format suitable for import in GNPS (Global Natural Products Social Molecular Networking)
- Client-server architecture to enable rapid data processing and multiple users to share methods and access shared datasets
- Semi-targeted workflows in MetaboScape® go hand in hand with targeted workflows for absolute quantification using TASQ®
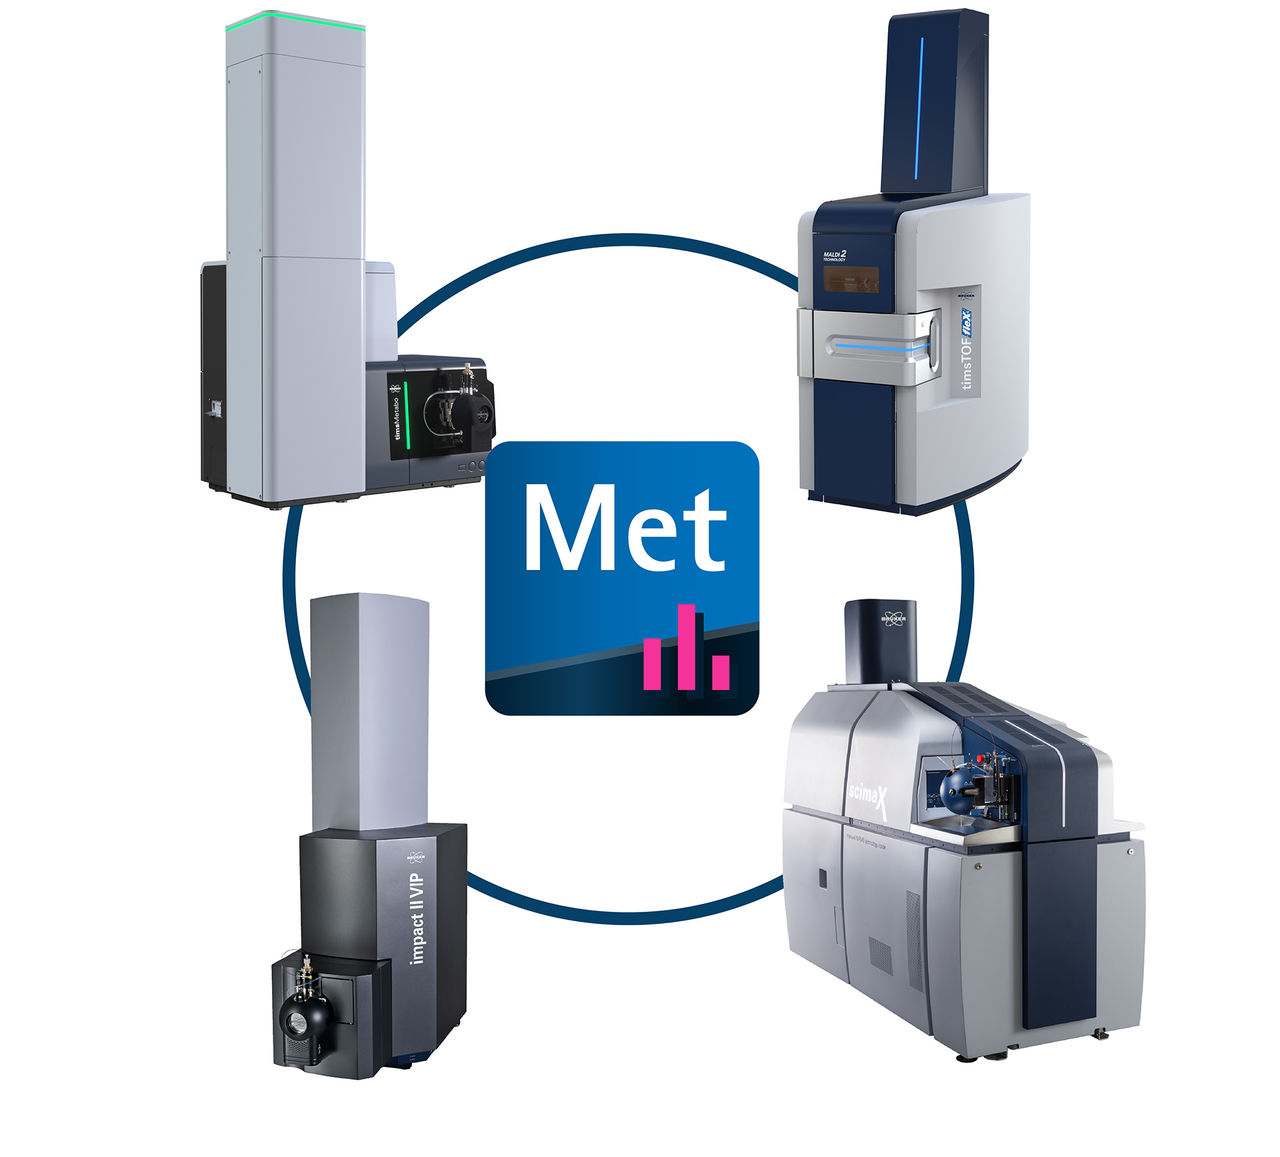
One software platform for 4D-Metabolomics™ and 4D-Lipidomics™ across Bruker instruments
MetaboScape® is Bruker’s integrated software platform for non targeted metabolomics and lipidomics workflows. It provides a unified, compound centric data model to process and interpret data from Bruker ESI LC MS(/MS), ion mobility enabled timsTOF systems, and MALDI instruments, enabling consistent analysis across acquisition modes and experimental scales.
At the core of MetaboScape® is a confidence driven annotation strategy. Molecular features are supported by multiple, orthogonal layers of evidence, including accurate mass, isotope pattern, retention time alignment (T ReX®), MS/MS fragmentation, ion mobility derived collisional cross section (CCS) values where available, and standardized Annotation Quality (AQ) metrics. Together, these indicators provide transparent and reproducible confidence for compound annotation in complex data sets.
When used with Bruker timsTOF platforms, MetaboScape® fully exploits ion mobility separation as a fourth analytical dimension. Experimentally measured CCS values add selectivity for isomeric metabolites and lipids, while integrated CCS Prediction further supports compound annotation by enabling comparison of theoretical and experimental CCS information, even in the absence of reference standards.
MetaboScape® supports progressive compound identification, from known compounds to structurally related unknowns. Integrated tools include SmartFormula3D™ for molecular formula determination based on accurate mass, isotopic patterns, and fragment information; automated searches of local and public compound databases; in-silico fragmentation via MetFrag for structure candidate ranking; and MS/MS similarity analysis to propagate annotations across chemically related features within a study.
Interactive user Interface to facilitate discovery
MetaboScape® offers an interactive and dynamic user interface, enabling swift navigation through Feature Tables, utilization of statistics to highlight key features, and assessment of annotations. The context-sensitive MS/MS spectrum automatically adapts to one of the following dedicated modes based on the type of annotation:
- SF (SmartFormula): Annotates molecular formulas to fragment peaks and measures neutral losses between peaks.
- LS (Lipid Species): Identifies MS/MS peaks that play roles such as side chain neutral losses or head group fragments.
- SL (Spectral Library): Displays a butterfly plot with the measured spectrum on top and the Spectral Library reference spectrum below.
- MF (MetFrag): Shows which MS/MS peaks correspond to specific substructures of the annotated compound.


Pharma workflows for identifying drug metabolites

The identification of drug metabolites is not only of great interest to pharmaceutical research but has gained increasing interest in metabolomics, phenomics, exposomics and non-target screening workflows. Here, metabolites of drugs or other xenobiotics like pesticides, toxics or narcotics are expected to occur, which may belong to the family of unidentified, so-called dark metabolome compounds.
MetaboScape® supports a local BioTransformer1-based metabolite prediction for assignment of these metabolism products both from liquid samples and directly from tissue using the SpatialOMx® workflow. Additionally, changes in time of these metabolites can be tracked and semi-quantified by using integrated time series plots.
([1] Djoumbou-Feunang et al.; Journal of Cheminformatics 2019, 11:2).
Fully integrated 4D-Lipidomics™ workflow
Rule based annotation routines in MetaboScape® enable the identification of lipid species taking into consideration the Lipidomics Standards Initiative (LSI) guidelines. This Lipid Class (LC) annotation tool avoids this risk of over annotation and simplifies the automatic identification of lipid features.
MetaboScape® can calculate and visualize Kendrick Mass Defects, turning complex mass spectral information into a compositional map with informative clustering of points based on lipid specific homologous repeating units (e.g. CH2). The customizable 4D Kendrick mass defect plot allows for intuitive lipid ID validation. Various characteristics of the extracted features can be plotted in 4 dimensions (x-axis, y-Axis, color scale, and bubble size), allowing versatile applications.
- Plotting retention time vs m/z reveals the separation of different lipid classes using different colours for different lipid classes. Using this colour coding, you can easily spot annotations with obvious deviation in retention time or CCS relative to the rest of the same lipid class.
- Plotting m/z vs CCS, you can further interrogate lipid data by visualizing trends in CCS observed for lipids with differences in chain length and double bond numbers. These trends can be used to confirm lipid class IDs and can assist in the annotation of unknowns and help to remove false positives.
- Visualize the Kendrick Mass Defect with CH2 specified as repeating unit allows to quickly investigate lipid species of a selected class for saturation and chain length consistency. In addition, the shown example for lipids annotated as Triacylglycerols (TGs) reveals the expected elution order using reversed phase chromatography, as well as the increasing trends in CCS value making full use of all 4 complementary dimensions.


In-silico derivatization

Streamline your laboratory workflow with integrated data processing. Let MetaboScape® perform the same chemical derivatization in-silico, that you have performed in the lab.
- In-silico derivatization of target structures
- Accurate prediction of product fragmentation and collisional cross section
- Customizable derivatization reagents enabled
- Never lose touch of the original structures
- Seamless integration with existing systems
T-ReX® 4D – enabling 4D-OMICs

A major requirement of metabolomics and lipidomics analyses is to quickly pinpoint and identify those compounds that change as a result of perturbation or disease. Matching retention time, precursor mass, isotopic pattern and MS/MS spectra are common criteria for accessing confidence in compound annotations. PASEF® data acquisition on the timsTOF Pro provides hundreds of MS/MS events per second, resulting in a greater depth of fragment coverage in single analysis. Additionally, PASEF® spectra benefit from ion mobility separation, therefore cleaner MS/MS spectra are obtained using an on-the-fly mobility filter. Each MS value is complemented with a collisional cross section (CCS) value to give a measure of the shape of the analyte, providing further confidence to ID.
T-ReX®² and T-ReX®³ for MALDI Imaging
In conjunction with SCiLS™ Lab software, T-ReX®² empowers the SpatialOMx®-based non-targeted profiling for processing and annotation of features, including drug metabolites, lipids and glycans. For the first time, map analytes spatially using this unique combination of T-ReX®³ and combine it with CCS-enabled annotation of compounds to enable a higher confidence annotation of compounds acquired using MALDI Imaging on timsTOF fleX systems.

T-ReX® 2D - FIA-MRMS ‘MetaboTyping’

The chromatography free MRMS aXelerate® workflow provides higher sample throughput by omitting time-consuming chromatography in phenomics research. Compounds are accessible that are not readily detectable by LC-MS analysis, allowing targeted and non-targeted metabolomics approaches. The data extraction by T-ReX® 2D in MetaboScape® provides confidence in automatic annotation of the FIA MRMS data. The novel scimaX® MRMS system can show its extreme performance with mass resolutions of >1 million and mass accuracies of <0.2 ppm. The ultra-high resolving power enables you to utilze isotopic fine structure for the unambiguous determination of elemental composition. This adds another layer of confidence for compound ID in non-targeted metabolomics.


"The AQ concept has been recently complemented with collisional cross section values. This allows us to incorporate very reproducible CCS value measurements from the timsTOF Pro as additional and orthogonal parameters into our metabolite identification workflow."
Prof. Lloyd Sumner, University of Missouri Columbia, MO, USA

"The performance of our new MRMS system has met and exceeded all our expectations across a variety of high end metabolic phenotyping challenges in molecular profiling, structure elucidation and imaging- and it is highly user friendly - every laboratory should have one!!"
Professor Jeremy Nicholson, Director of the Australian National Phenome Center, ProVice Chancellor for Health Murdoch University

"The client-server setup of Metaboscape® is ideal for us as core facility, because we can easily provide interactive access to metabolomics data to many users."
Dr. Jörg Büscher, Max-Planck-Institut for Immunbiology and Epigenetics, Germany


For Research Use Only. Not for use in clinical diagnostic procedures.