TEM, STEM and T-SEM EDS Quantification at its Best
On-Demand Session - 64 Minutes
EDS Quantification Guideline
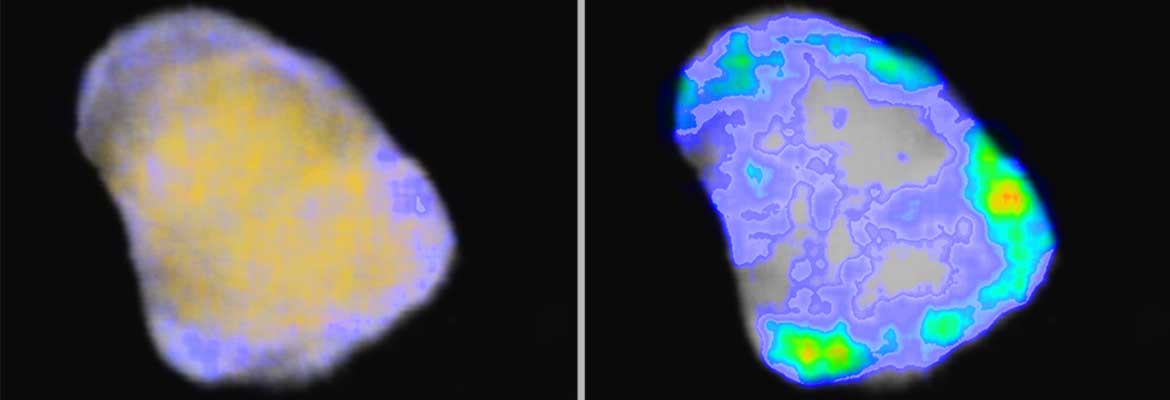
In this webinar we explain EDS quantification for electron transparent samples. Available methods and their application following a simple guideline will be shown. Possible pitfalls and successful approaches will be discussed.
Main topics are:
- Suitable specimen and specimen mounting
- The Cliff-Lorimer and the Zetha-factor method - which to use when
- Theoretical and experimental Cliff-Lorimer and Zeta-factors
- System setup and data acquisition
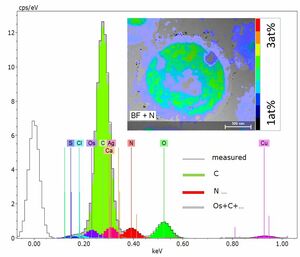
- Quantification steps
- Background- and peak-fit models, calibration options, also off-line
- Display of quantitative results (e.g. in pseudo-color or tables) for
- spectra
- line scans
- hypermaps
- High spatial resolution EDS
Who Should Attend?
- Students, engineers, advanced scientists using or wanting to use EDS in TEM/STEM or in T-SEM (TEM sample in SEM)
- Scientists interested in using the Bruker software for data analysis in experiments on the nanoscale
Speakers
Dr. Meiken Falke
Global Product Manager EDS/TEM, Bruker Nano Analytics
Watch this Webinar On-Demand
Please enter your details below to gain on-demand access to this webinar.