Imaging Live Samples
Living Samples
Imaging live samples allow researchers to observe biology and processes in living samples. Among the various methods available for live imaging, light-sheet fluorescence microscopy is particularly advantageous to study dynamic processes in real-time. Light-sheet microscopy employs a thin, focused sheet of laser light to illuminate a specific plane in a biological sample, minimizing the exposure of surrounding tissues to potentially damaging light. This reduces phototoxicity and photobleaching, which are common issues in conventional imaging techniques that can impact samples. As a result, light-sheet microscopy enables prolonged observation of samples, making it ideal for tracking processes such as cell division, embryo development, and even the behavior of entire organisms.
Bruker's Luxendo light-sheet microscopes combine expert knowledge and years of experience to deliver tailored, live-sample light-sheet imaging. This enables researchers to better understand complex biological phenomena by capturing high-resolution 3D images quickly and with minimal harm to biological specimens.


Embryogenesis and Developmental Biology
Light-sheet microscopy is a widely used imaging technique in embryogenesis and developmental biology. It allows scientists to non-invasively capture volumetric data and gain a comprehensive understanding of cell movement, organ formation, and embryo development. Particularly, time-lapse imaging creates critical insights into organogenesis, tissue patterning, and spatiotemporal dynamics during embryogenesis. By employing light-sheet microscopy with biomedical image analysis, the entire development of tissues and organisms can be described.
Applications include:
- Organ formation
- Tissue morphogenesis
- Genetics in embryonic development
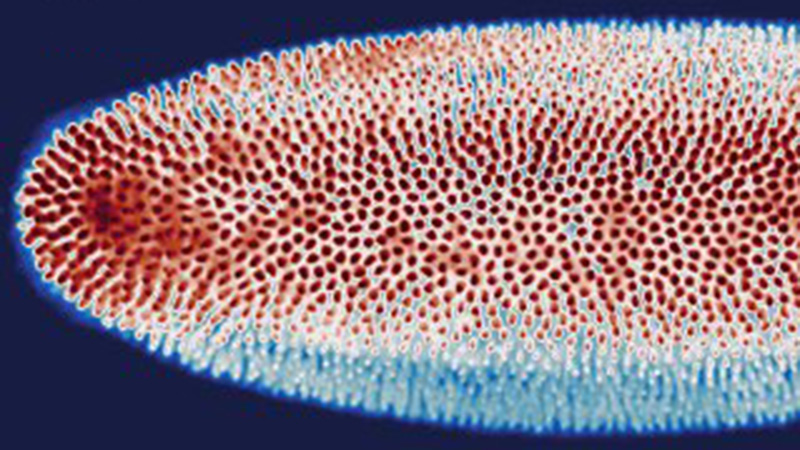
Cell Tracking in Drosophila Embryo Development
Cell tracking created with arivis Vision4D 3D visualization and analysis software. Imaged on the MuVi SPIM.
Courtesy of:
Celia Smits and Stanislav Y. Shvartsman
Department of Molecular Biology
Princeton University, NJ
USA
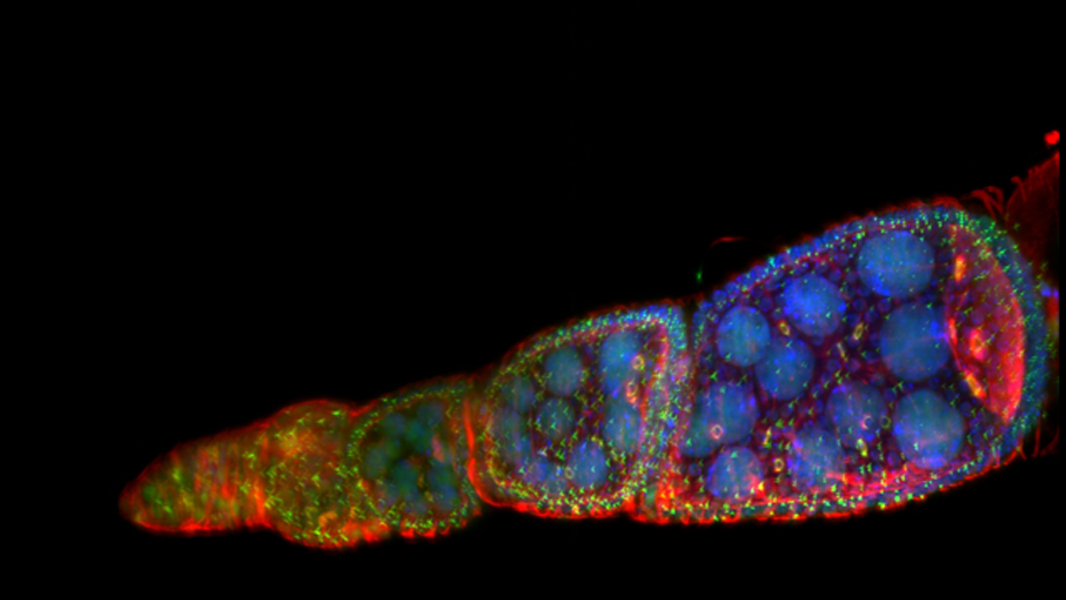
Zebrafish Embryonic Development
Zebrafish embryo expressing Histone H2A-GFP imaged every 6 min from late gastrula to 15–17 somite stage. Imaged on the MuVi SPIM.
Courtesy of:
Andres Collazo
Caltech, Pasadena, CA, USA
as well as: Course faculty and participants of the 2017 Zebrafish Course
Marine Biological Laboratory (MBL)
Woods Hole, MA, USA
Zebrafish Development
Zebrafish imaged on the MuVi SPIM. Stitched from 5 stacks in Imaris, each 340 slices, 16 hour/10min. Fish growth can be observed.
Courtesy of:
Prof. Jingxia Liu
Huazhong Agricultural University
China
Neurobiology and Neurodevelopment
Neurobiology and neurodevelopment are two scientific fields concerned with the nervous system and its structure, function, and development over time. Neurobiology focuses on studying the nervous system's fundamental processes including neuronal communication, synaptic plasticity, and the organization of neural circuits. Neurodevelopment focuses on the intricate processes by which the nervous system forms and matures, encompassing the birth and differentiation of neurons, axon guidance, and the formation of synapses. Together, these disciplines offer profound insights into the mechanisms underlying brain function and development, which are crucial for comprehending neurological disorders and designing potential interventions.
Applications include:
- Brain development and calcium signaling
- Immune cell tracking and time-lapses
- Cell connectivity
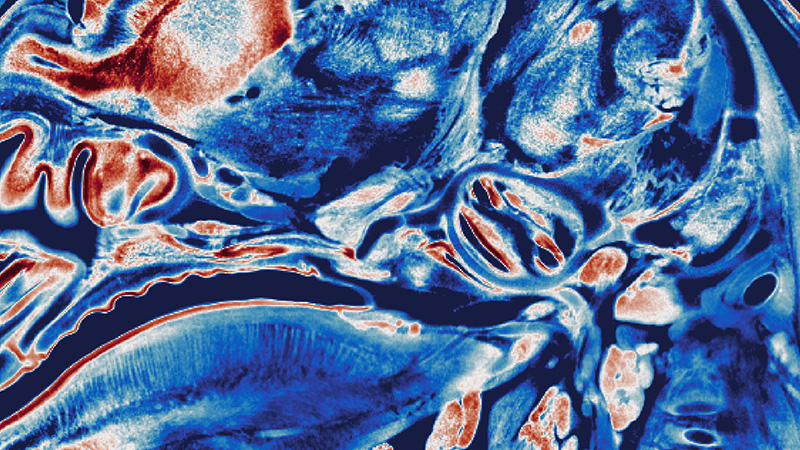
Microglia Response to Axonal Damage
The axon of a neuron in the zebrafish brain was selectively dissected by means of IR laser ablation (MuVi SPIM). Thirty minutes after ablation, four microglia reached the damaged axon.
Image taken from:
de Medeiros, G., Kromm, D., Balazs, B. et al. Cell and tissue manipulation with ultrashort infrared laser pulses in light-sheet microscopy. Sci Rep 10, 1942(2020). https://doi.org/10.1038/s41598-019-54349-x
Microglia Movement
Microglia movement in zebrafish. The vascular system is labeled with a cyan marker and microglia with a yellow one. Imaged on the QuVi SPIM at 2 FPS for 20 min. Two orthogonal views fused and max. project.
Courtesy of:
N. Norlin, F. peri
European Molecular Biology Laboratory (EMBL)
Heidelberg, Germany
Live Imaging of Plants
Studying living plants under the microscope helps to understand plant growth, development, and responses to environmental stimuli. However, traditional fluorescence microscopy techniques create challenges, such as phototoxicity, when imaging living plants. Phototoxicity can damage or even kill the plant over time whereas imaging thick plant tissues is often limited due to light scattering, especially in roots and stems. These challenges hinder the ability to observe dynamic processes such as cell division, cell elongation, and the movement of cellular components in living plants.
Light-sheet microscopy offers a transformative solution to these issues. By employing light-sheet imaging techniques, scientists can non-invasively and efficiently observe plant specimens such as Arabidopsis with minimal phototoxicity. Light-sheet microscopy utilizes a thin sheet of light to selectively illuminate the specimen, reducing exposure and cell damage.
Applications include:
- Plant stem cells in root development
- Cell biology and plant physiology
- Cell death and apoptosis
Arabidopsis Root Growth
Transgenic Arabidopsis root expressing nuclear envelope marker imaged with the MuVi SPIM. The comparison of the videos shows the effect of gravity on root growth.
Courtesy of:
Shanjin Huang
Tsinghua University
Beijing, China
Arabidopsis Root
Transgenic Arabidopsis root expressing a membrane marker. Imaged with the InVi SPIM.
Courtesy of:
Alexis Maizel
COS, University of Heidelberg
Heidelberg, Germany
Live Imaging of 3D Cell Cultures and Organoids
3D cell culture and organoid imaging allow researchers to replicate complex 3D environments that cells naturally inhabit within tissues and organs—creating profound insights into cell behavior, interactions, and responses to stimuli. Furthermore, avenues of personalized medicine are immensely promising. For example, it is particularly useful to use subject patient-derived organoids for drug screens and establishing the optimum drug for specific patients. These highly effective studies also result in a reduction in unwanted side effects.
Applications include:
- Disease studies
- Drug screening
- Personalized medicine
Mitosis in HeLa Cells
Mitosis in HeLa cells stained for histone 2B-mCherry (magenta), GFP-tubulin (green) and GFP-tubulin (white, deconvolved).
Imaged on the InVi SPIM Lattice Pro.
Visualization: Imaris (Bitplane).
Courtesy of:
Sabine Reither
European Molecualr Biology Laboratory (EMBL)
Heidelberg, Germany
Sample: HeLa cells (Neumann et al., Nature. 2010 Apr 1;464(7289):721-7)
Mouse Pre-implantation Development
Left: Mouse preimplantation embryos expressing H2B-mCherry. Nuclei tracking from one-cell stage to blastocyst.
Right: Mouse oocytes expressing CENPC-EGFP and H2B-mCherry for kinetochore tracking.
Imaged on the InVi SPIM.
Petr Strnad, et al. (2016). Inverted light-sheet microscope for imaging mouse pre-implantation development. Nature Methods 13, 139-145

Epithelial Cells
Epithelial cell line (BS-C-1) stained for f-actin and chromatin. Image taken with InVi SPIM Lattice Pro.
Courtesy of:
Ulrike Engel
Nikon Imaging Center
University of Heidelberg
Germany
Other Applications
Live imaging is an incredibly insightful technique to study the biology of life. It has applications in many scientific fields in addition to (i) Embryogenesis and Developmental Biology, (ii) Neurobiology and Neurodevelopment, (iii) Live Imaging of Plants, and (iv) Live Imaging of 3D Cell Cultures and Organoids. There has also been proven success in fields such as marine biology, tumorigenesis, and biophysics.
Daphnia Magna
Auto-fluorescence in Daphnia imaged on the MuVi SPIM.
Courtesy of:
Ellen Decaestecker and Luc De Meester
KU Leuven
Kortrijk, Belgium
Mammalian Tumors
Mammalian tumors (red) growing in zebrafish (green). Imaged on the MuVi SPIM
Courtesy of:
Dr. Xi Yao and Dr. Zhangzhao Junjie
Model Animal Research Center of Nanjing University
China
Zebrafish Heart Beating
Zebrafish heart beating imaged on the MuVi SPIM.
Courtesy of:
Prof. Jingxia Liu
Huazhong Agricultural University
China