

Infrared Imaging in Biology
Why use infrared (IR) imaging for tissue analysis?
Infrared imaging allows the analysis of biological samples with minimal sample preparation and without the use of contrast enhancement agents. It is the alternative to traditional dye staining methods.

Traditionally, the analysis of biological tissues is usually performed using microscopic methods. The low visual contrast is compensated by dye staining to highlight the regions of interest. To visualize specific components (proteins, carbohydrates, lipids).
To visualize disease patterns (e.g. cancer, neuro-degeneration), immunohistochemical (IHC) staining is used, where staining is achieved using antibodies, which specifically bind to antigens in the tissue sample.
This might be effective but is very time consuming, complex and comes with serious disadvantages, e.g. cross reactions, which lead to a strong background staining and a weak staining of the target antigen.
In IR imaging no staining agents are necessary. It uses infrared light to study the molecular vibrations and therefore provides clear answers about the chemical composition of samples
How does IR imaging work?
IR imaging reveals the chemical nature of biological structures and identifies proteins, lipids, polysaccharides etc. In many scientific studies, it has been shown that the method allows to differentiate between cancer cells and normal cells. Additionally, different structural forms of proteins (α-helix, β-sheet and random coil) and fatty acids (degree of unsaturation) can be discriminated.
Tissue sections are placed on reflective metal surfaces or special IR transparent windows (CaF, KBr, ...) and subjected to first an visual inspection and then to the actual infrared analysis. During the measurement a complete infrared spectrum is recorded at the selected spatial resolution, e.g. every 10 µm.
There are different approaches to IR tissue imaging: one can use single element detectors or advanced technology like focal-plane array detectors, which also allow ultrafast high resolution imaging.
Biological tissue imaging by focal-plane array technology
As mentioned above, biological tissue samples are often large and do not show clear distinguishing features in the visible image. This makes it quite difficult to identify relevant areas. Therefore, it is useful to analyze the entire tissue section in one run.
In such applications, focal plane array detectors (FPA) represent a decisive advantage. In general, they work like a digital camera and capture sample areas of 32 x 32 pixels (or more), where each individual pixel contains a complete IR spectrum.
Our video shows the analysis of a mouse intestine tissue cut (1.12 µm x 1.12 µm) by FPA-imaging in real time. For this purpose the sample was prepared on a CaF window. In the live preview, an IR spectral band representative for proteins was selected to provide a first chemical image during analysis.
Applications of IR imaging in tissue analysis
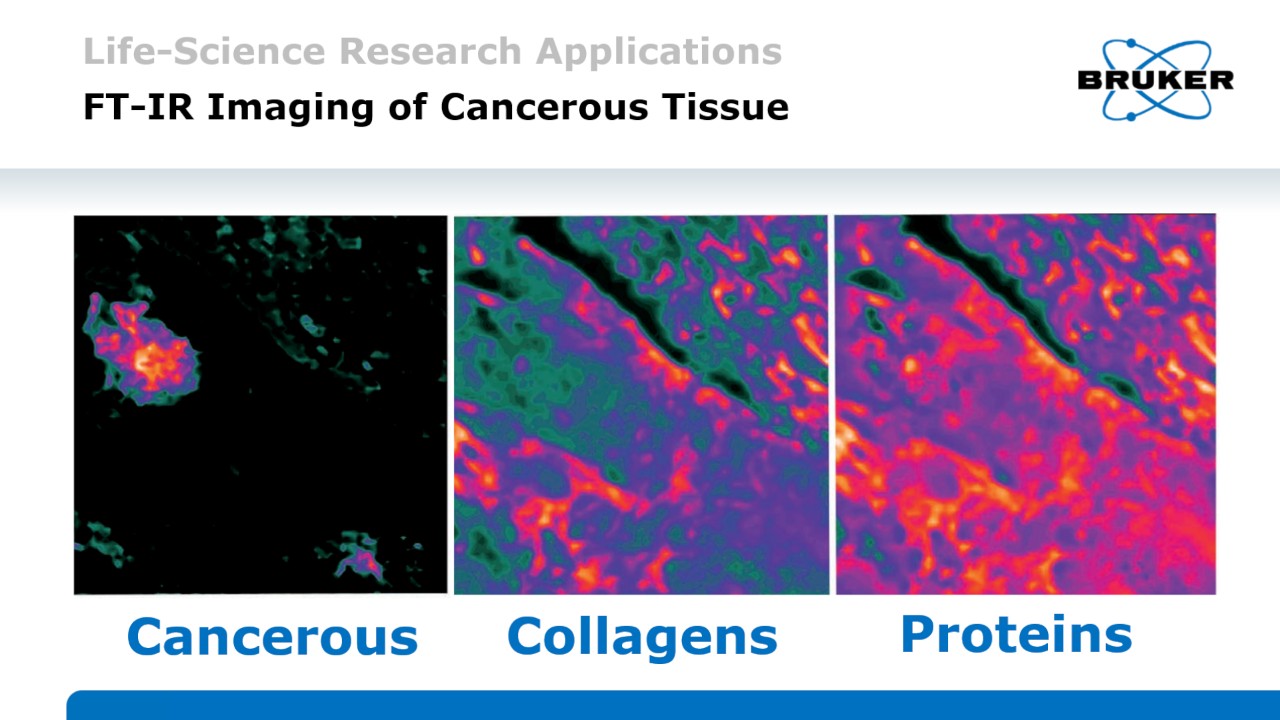
At around 30.5 percent, breast cancer is the most common cancer among women in all countries of the industrialized world.
These color coded chemical infrared images show the distribution of individual biological components in cancerous breast tissue. Black indicates for the lowest, red and white for the highest values. Cancerous region (left), collagens (middle), and proteins (right).
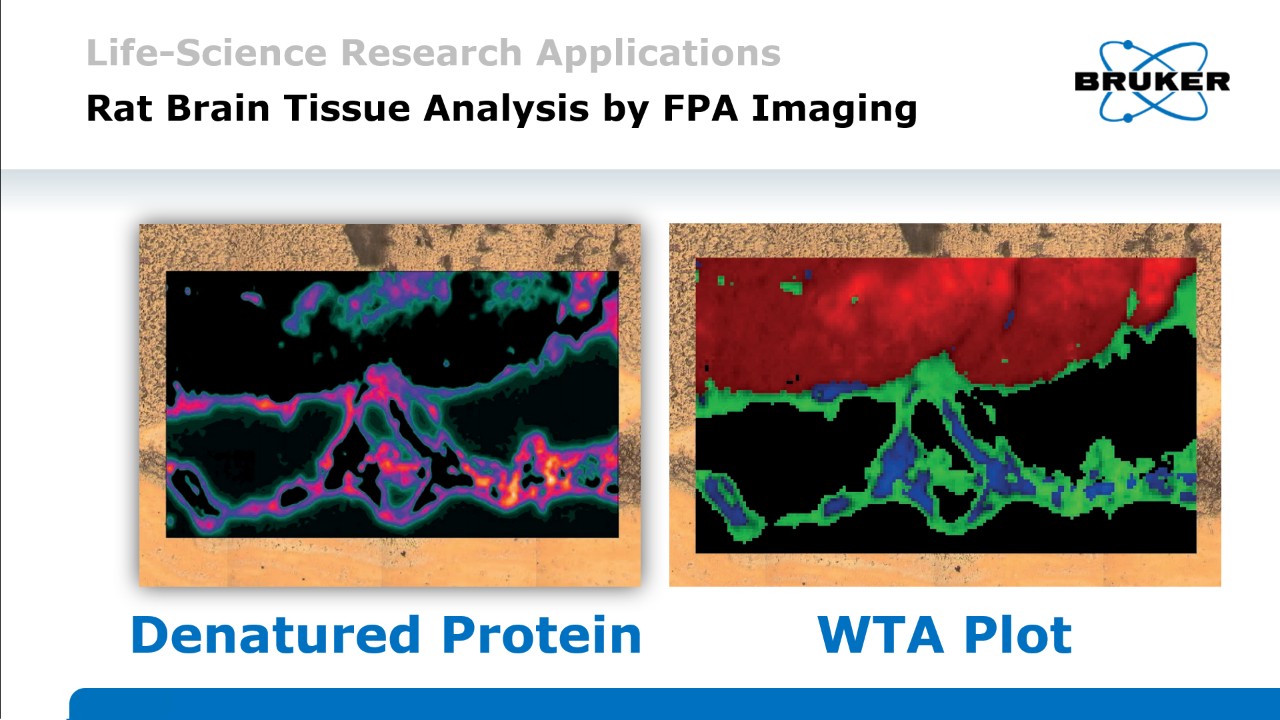
Neurodegenerative diseases typically involve the formation of denatured proteins that differ in their structure from native proteins.
This example shows the chemical images of a rat's brain. On the left, the denatured proteins are visualized and on the right, a WTA image of the rat brain sample was composed, showing: fatty acids (red), native proteins (blue), and denatured proteins (green).
