Application Note: Hardness Mapping of a DP980 Steel Sample
Advanced dual-phase (DP) steels are important new high-strength steel products being developed for the automotive industry. Their microstructure typically consists of a soft ferrite phase with dispersed grains of a hard, substantially stronger, martensite phase. While conventional DP steels exhibit low yield strength phase combined with a high strength phase, new advanced DP steels use solid-solution hardening in the ferrite phase to increase the yield strength. These enhanced properties make DP steels suitable for automotive structural and safety parts, such as longitudinal beams, cross members, and reinforcements. As they are developed and find commercial application, thorough characterization of the mechanical properties of these steels is crucial. The strength and ductility of a steel are closely related to its microstructure. It is possible to produce a steel with specific mechanical properties by controlling certain factors that affect microstructure, such as alloying elements and thermal/mechanical treatments used during processing. When characterizing these materials, a number of techniques are employed to evaluate traits that are known to affect mechanical properties, such as grain-size distribution, the presence of precipitates, and texture (average orientation distribution of the steel).
In this application note, hardness mapping is used to characterize the two phases of a DP steel sample. It is possible to quantify the properties of the different phases using a hardness map if the deformed volume of the indentation test is small enough to fall completely into one phase and if the number of indentations is large enough to assure that different phases are probed.
Procedure
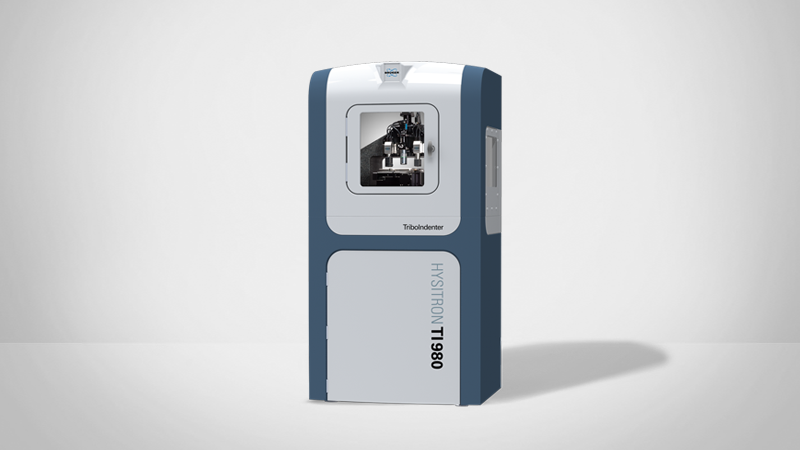
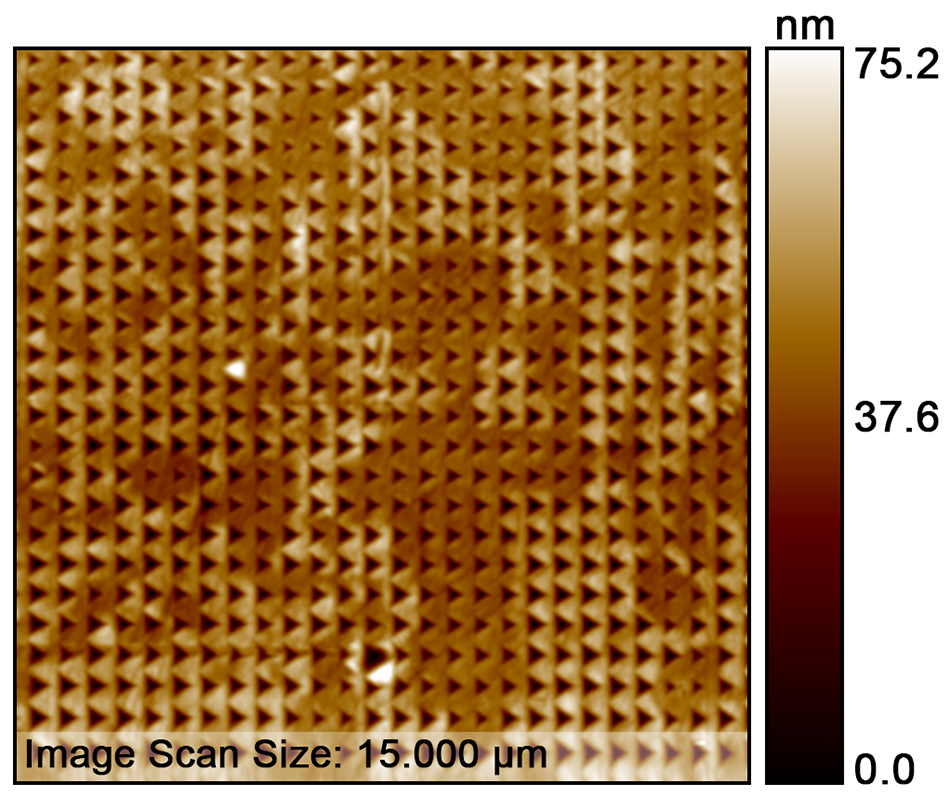
The DP980 sample was ground and polished with oxide polishing suspensions (OPS polishing) to produce a smooth surface for nanohardness testing; no etching was employed. The sample was mounted in the Hysitron® TI 980 TriboIndenter®, and XPM™ was used to perform a 100x100 indent hardness map with a sharp Berkovich probe. The map was acquired in 1.5 hours over an area of 60x60 µm at the half-thickness position of a DP steel sheet. The time for each load cycle was 400 ms and the penetration depth was ~50 nm. The SPM image in Figure 1 shows a subset of the 10,000-indentation array.
Results
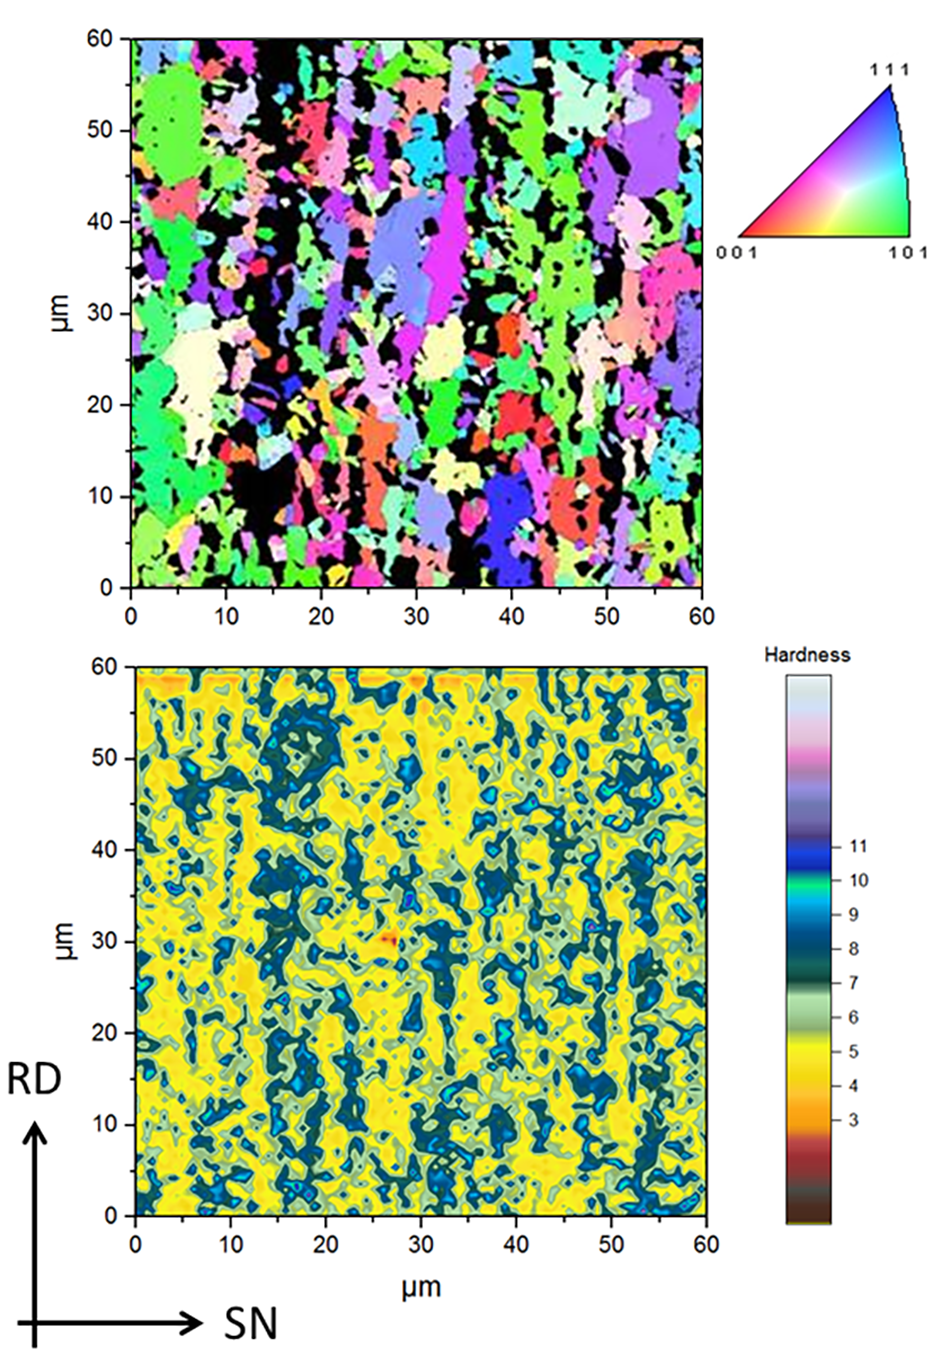
The two phases, ferrite and martensite, are easily identifiable by the difference in their measured hardness, shown in the hardness map in Figure 2. The plot in Figure 3 illustrates the hardness distribution for the 10,000 indents performed (red triangles). The relative proportions of martensite and ferrite can be determined assuming a Gaussian distribution. The Ferrite distribution is fitted to the data points from 0 to 5.8 GPa, while the martensite distribution is fitted to hardness values of 8.4 GPa and higher. Since the distributions are overlapping between 5.8 and 8.4 GPa, these data points are not used for the fit. Electron backscatter diffraction (EBSD) mapping of the material attributes 33% of the surface area to martensite (Figure 2; black area). Therefore, it can be assumed that the peak area of ferrite to martensite should be 2:1.
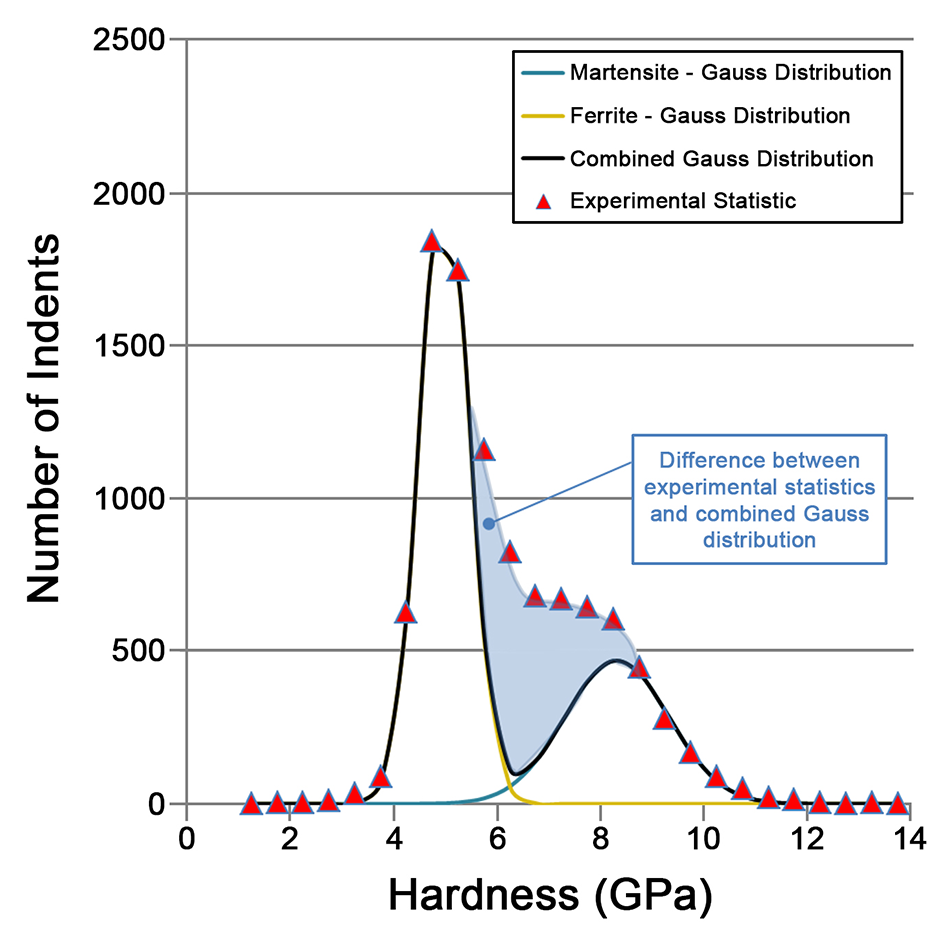
The black curve in Figure 3 is a combination of the two Gaussian fit curves. However, this curve does not match with the experimental distribution in the range of 5.8 to 8.4 GPa—the model underestimates the number of hardness measurements performed in the transition between ferrite and martensite. This deviation becomes a measure for the number of indents that were performed on the interface between the two phases—i.e., they have deformed both phases and are not part of either Gauss distribution. Following this, it was determined that 2,800 of the 10,000 indents were performed at an interface. The hardness of ferrite was found to be 4.8 GPa and the hardness of martensite was found to be 8.3 GPa.
Conclusion
Nanohardness testing with XPM is a fast, powerful characterization technique for evaluating the mechanical behavior of dual-phase steels. It offers several key benefits, including the ability to perform indents with depths ≤50 nm with a well-controlled plastic zone, allowing for testing of small grain sizes, automated mapping to acquire large data sets with minimal hands-on operator time, and advanced data analysis.
Hysitron, TriboIndenter, and XPM are trademarks of Bruker Corporation. All other trademarks are the property of their respective companies. © 2018 Bruker Corporation. All rights reserved. AN1511, Rev. A0