Application Note: Correlative Microscopy and XPM — Mechanical Property Distribution by Nanoindentation Mapping
High-Speed Nanoindentation and Microstructural Analysis
Mechanical properties of materials are typically being assessed by a small number of experiments. The outcome of these experiments is relevant as the deformed volume integrates over all microstructural features to allow repeatable tests of the material's properties. Nanoindentation allows for the speeding up of the testing process, while scaling down the tested volume. With the added information of statistical distribution and spatial mapping of properties, the average material behavior can now be calculated from the distribution of the material's properties. The results show the granularity of material at the microstructural level. This application note discusses how the mapping of properties helps to correlate effects when combined with complementary high-resolution microscopy techniques.
Procedure
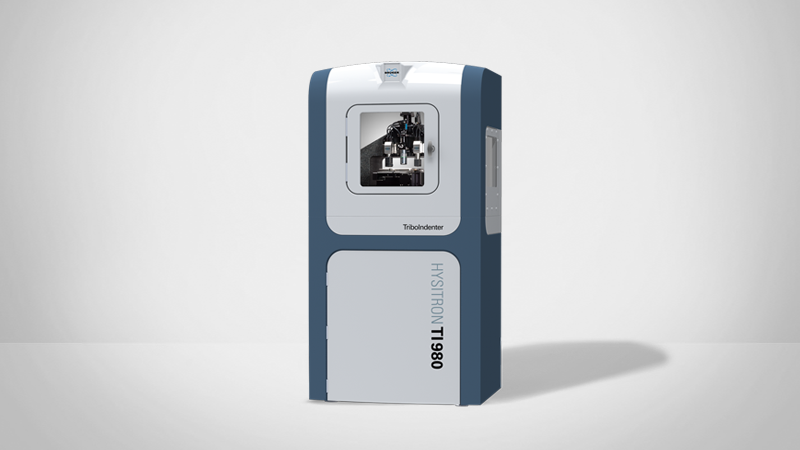
Dual-phase (DP) steel is typically used for automotive applications. This steel consists of a ferrite matrix containing a hard second phase, usually islands of martensite. A Hysitron® TI 980 TriboIndenter® with XPM™ (high-speed nanoindentation) was used to investigate a DP600 steel sample and a railway welding joint. XPM mode is able to perform several indentation cycles per second on different spots of the sample by combining a high-bandwidth indentation head with a piezoelement for fast and controlled motion between the testing positions.
A calibrated Berkovich probe was used with a maximum load of 800 µN to control a small indentation size (times: 0.1s loading, 0.1s dwell, 0.05s unloading).
XPM Mapping of a DP600 Steel Sample
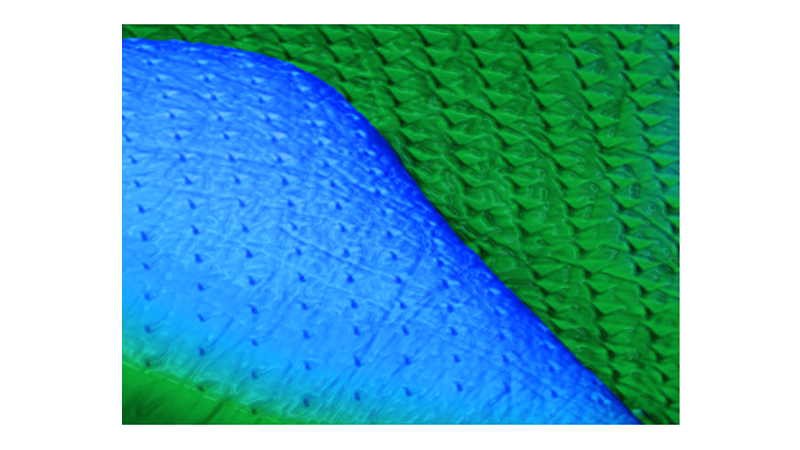
A DP600 steel sample was tested by combining nanoindentation with complementary high-resolution microscopy techniques, such as high-resolution scanning probe microscopy (SPM) imaging and electron backscatter diffraction (EBSD) (see Figure 1).
XPM was used to obtain a quantitative, ultrahigh-speed mechanical property map for high-resolution characterization of nanoscale hardness inhomogeneities across the surface. A quantitative 10,000-point nanoindentation hardness map (100x100 indent array) on a DP600 steel sample was completed in ~90 minutes to quickly gather property distribution statistics and generate spatial distribution of localized mechanical properties (see Figure 2).
Local differences in microstructure and grain orientation were examined thoroughly. EBSD characterization was used to further study the effects of orientation on deformation behavior. The grain crystallographic orientation plays a role in the deformation pathway of the material (see Figures 3–5).
The combination of nanoindentation and EBSD techniques enables one to measure and correlate the material’s mechanical response with the crystallographic orientation. The modulus map is not sensitive to the orientation or the different constituents of the matrix tested.
Microindentation and XPM Mapping on a Railway Welding Joint
The hardness profile of a welding joint region and heat affected zone of railway steel was investigated by a line profile of microindentation and nanoindentation experiments (see Figure 6). The Vickers indentation experiments, with a maximum load of 1 N, were compared to a XPM map of 196 indentations (14x14 indent array) that covered an area similar to the Vickers indentation cup (see Figure 7). The Vickers indentation cup was placed closely to the tested grid. It is assumed that the Vickers hardness experiment establishes an average hardness value by containing all critical characteristics of the microstructure in the deformed volume under the indentation cup.
The hardness map, comprised of 196 nanoindentation tests, was more sensitive to the microstructure features, and probed the different characteristic features of the microstructure locally. This caused the hardness values of the 196 indentation tests to show high scatter, representing the hard and soft spots in the microstructure. It is assumed that the mean value of the scattered hardness values is providing a representation of the average material behavior within the measured area. The distribution of nanohardness is represented by the box-plot in the diagram.
The resulting profile of Vickers hardness and XPM nanohardness box-plot shows very good agreement between the Vickers hardness value and the mean of the XPM hardness map. The box-plot represents the scatter of local mechanical properties.
It is observed that the heat affected zone and the matrix material show very comparable trends for the Vickers hardness test and the XPM map mean value.
In the welding joint, it is found that the XPM map mean value shows better reproducibility than the Vickers hardness value. This indicates that the welding joint area consists of large areas of high to very high material hardness, and that the Vickers hardness test needs a higher force to average over a larger volume.
Conversion of Vickers Hardness to Nanohardness
The Vickers hardness to nanohardness conversion is measured by employing a factor of 92.65 between the Vickers hardness in Kg/mm2 and the nanohardness in GPa (ISO14577). The scales for nanohardness and Vickers hardness were chosen in such a way that the nanohardness and Vickers hardness can be compared within the plot.
Conclusions
The nanoindentation and Vickers hardness tests showed good agreement in matrix area. However, the nanoindentation average shows better reproducibility in the welding joint, and also shows the local granularity of the steel alloy. This work shows that granularity of mechanical properties of samples can be assessed by using XPM mode. With XPM, the time it takes to complete 196 nanoindentation tests is similar to the time it takes to complete a single Vickers test. Therefore, XPM offers higher statistical relevance and spatial distribution of mechanical properties to complement existing microscopy techniques.
Authors
- Junhe Lian, IEHK - RWTH-Aachen
- Ude Hangen, Ph.D. (ude.hangen@bruker.com), Bruker
Hysitron, TriboIndenter, and XPM are trademarks of Bruker Corporation. All other trademarks are the property of their respective companies. © 2019 Bruker Corporation. All rights reserved. AN1521, Rev. A0.


