FT-IR or IR Spectroscopy?
The Original Technique: Dispersive Infrared Spectroscopy
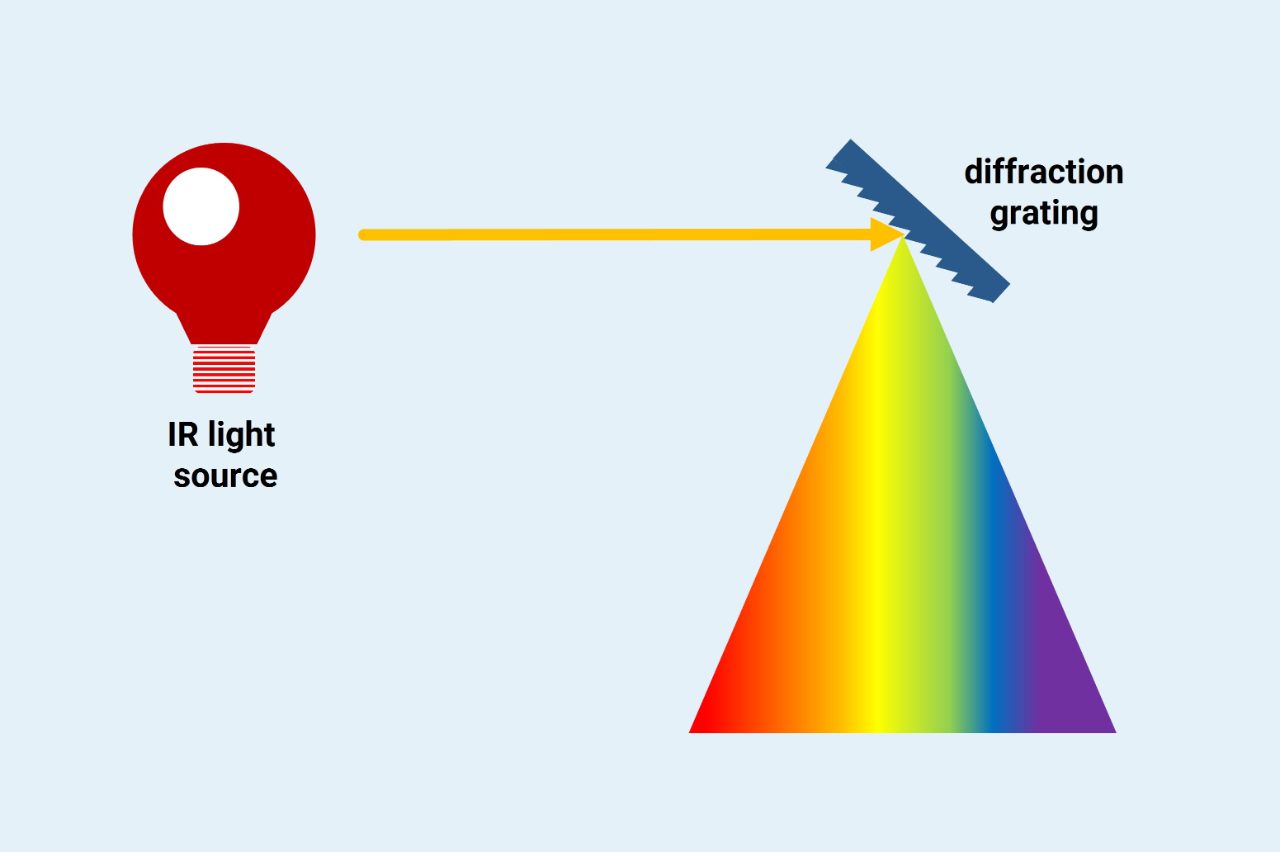
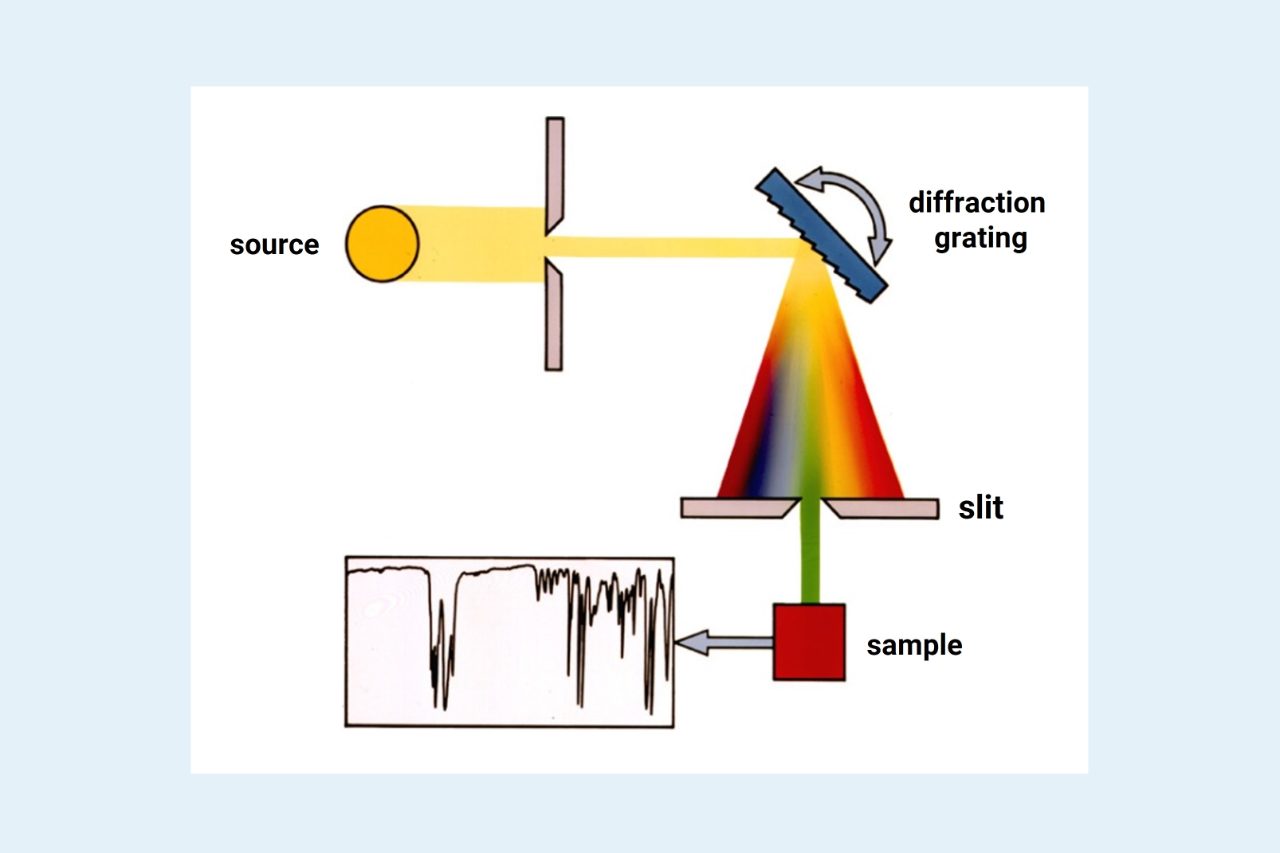
Traditional IR spectroscopy beings by shining IR light onto a diffraction grating, which separates light by wavelength. When a broad-spectrum light source shines on a diffraction grating, different wavelengths of light exit the diffraction grating travelling in slightly different directions.
This occurs because the angle of the light as it exits the diffraction grating is directly related to the wavelength of the light. Since this technique begins by separating the light, dispersing the different wavelengths in space, it is often called dispersive infrared spectroscopy.
After the IR beam is separated by wavelength, the separated beam passes through a slit to reduce the beam to single wavelength of IR light. The resulting monochromatic beam of IR light is directed to sample and the absorbance of that specific wavelength is detected.
The angle of the diffraction grating is then changed to isolate a different wavelength, and the absorbance of that wavelength is measured. This process is repeated until the absorbances of all wavelengths of IR light are checked. The resulting data can then be plotted to obtain the IR spectrum.
Introducing Fourier-transform infrared (FT-IR) spectroscopy
FT-IR revolutionized IR spectroscopy by making the technique much more straightforward to perform. Dispersive IR spectroscopy takes quite a long time as each wavelength of IR light must be checked individually. FT-IR on the other hand can check all wavelengths of light very rapidly, considerably speeding up the process. FT-IR accomplishes this using a technique called interferometry which takes advantage of the properties of waves and how they interact with each other to get information from a sample.
Interactions of (infrared) light
Infrared light, like all electromagnetic radiation, travels in waves with peaks and troughs. Where these peaks and troughs occur in space is called the phase of the wave. Two waves may have different phases, which is called the phase difference.
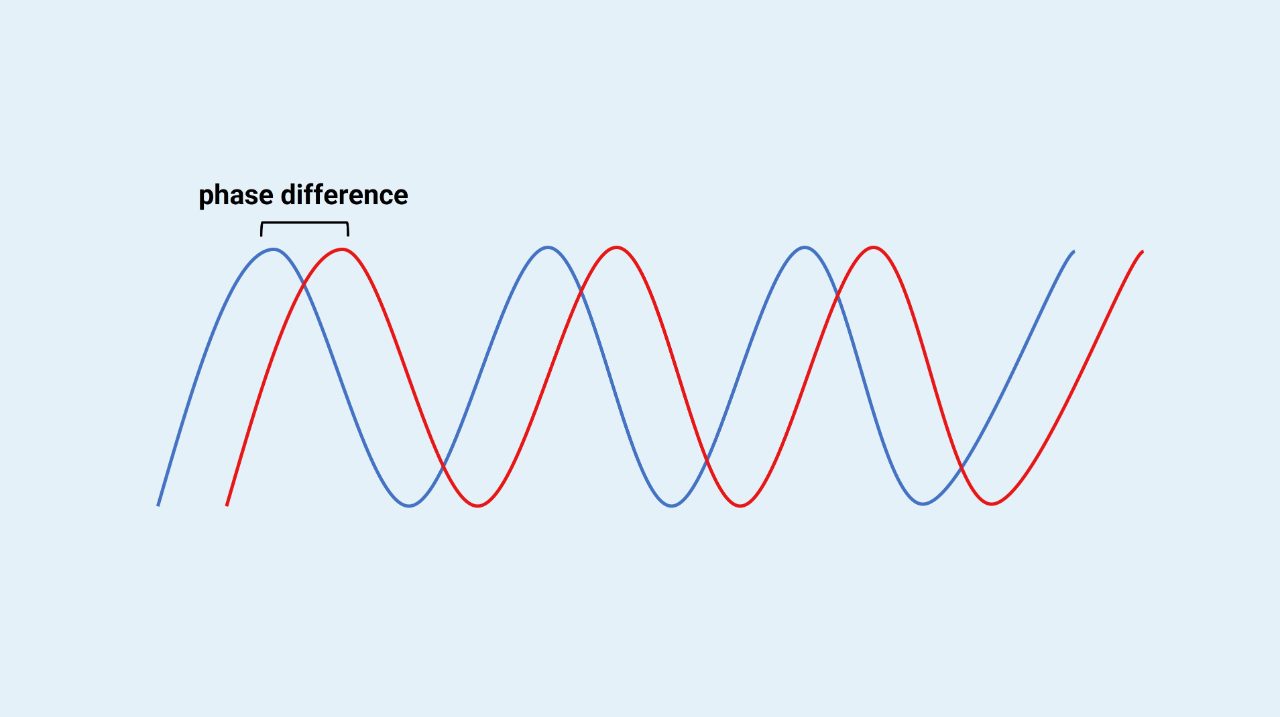
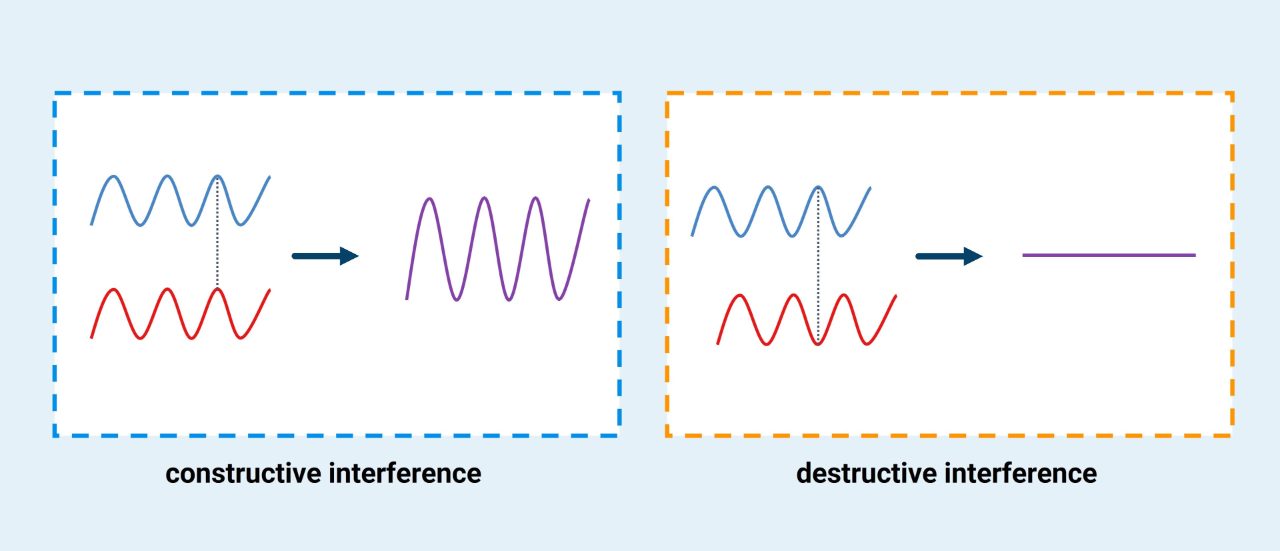
The phase difference between two waves dictates how they interact, which is called interference. If the peaks and troughs of the two interacting waves match up, the waves are said to be in phase, and the resulting interference is called constructive interference.
If the peaks of one wave match up with the troughs of the other wave, the waves are out of phase and the result is destructive interference instead. Waves that are not completely in phase or out of phase can also interact in a way that depends on the phase difference between the two waves. The specific way the waves interfere is called an interference pattern.
Inside the FT-IR spectrometer
FT-IR uses an interferometer, such the Michelson type interferometer, to cause the IR light to interfere with itself. Inside the interferometer, the IR light beam is split in two with a beam splitter, then directed to two mirrors. The beams bounce off the mirrors and then meet again, where they are recombined.
If the two beams of light travel the same distance to the mirrors and back again, the beams will be in phase when they recombine which creates constructive interference. However, one of the mirrors in a Michelson Interferometer can move, which means the beams can travel different distances to the mirrors which creates a phases difference between the waves when they recombine. The phase difference can be changed by changing the position of the moveable mirror.
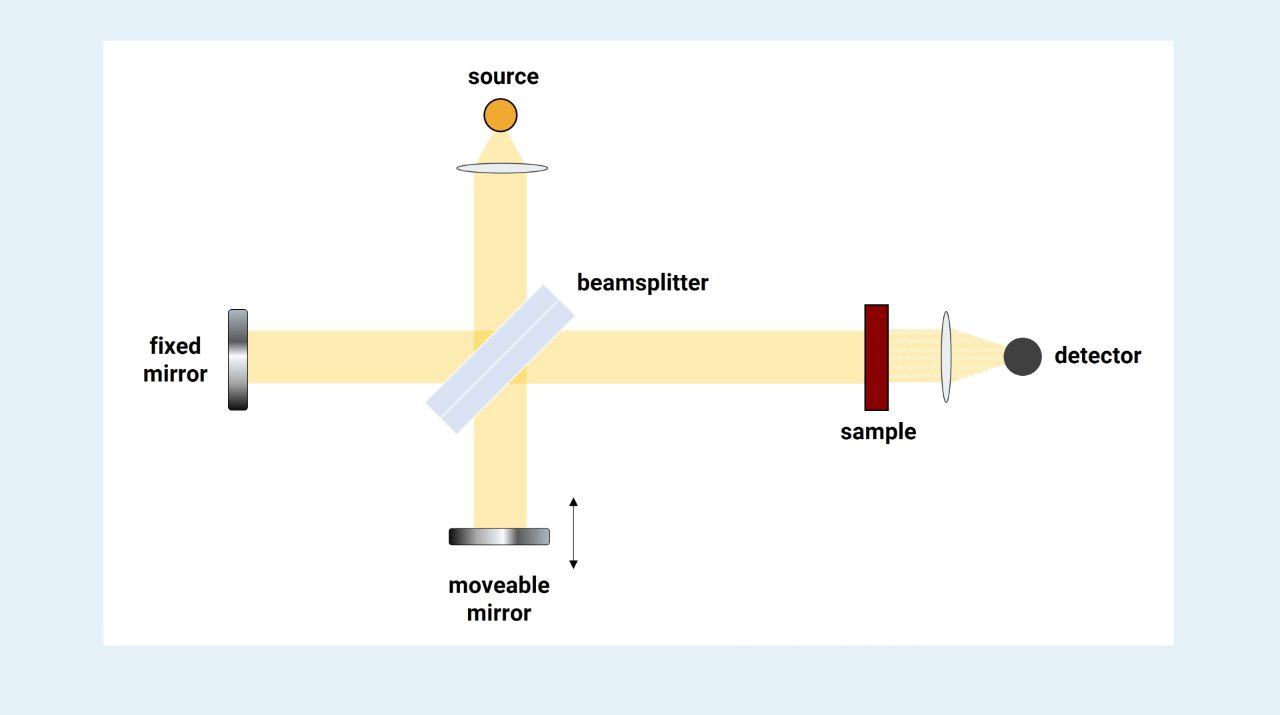
After the light is recombined, it is directed to the sample and then detected. Then the mirror is moved to change the phase difference between the beams, which results in a different interference pattern when the beams recombine. Each interference patten causes different wavelengths of IR light to be present in the recombined beam. The mirror can be moved quickly through different positions, resulting in the rapid detection of IR absorbance for all wavelengths of IR light.
After all the data is collected, it can be plotted which results in an interferogram. The interferogram does show how the sample absorbs IR light but it is very different from the IR spectrum obtained from dispersive IR spectrometry. An IR spectrum shows how strongly the sample absorbs each frequency of IR light, while the interferogram shows how strongly the sample absorbs IR light as a function of the position of the moveable mirror inside the interferometer. This means that the data from an FT-IR experiment must be processed to create a comparable IR spectrum. Essentially, the absorption of each wavelength of IR light must be extracted from the information in the interferogram.
Creating the Spectrum from the Data: The Fourier Transform
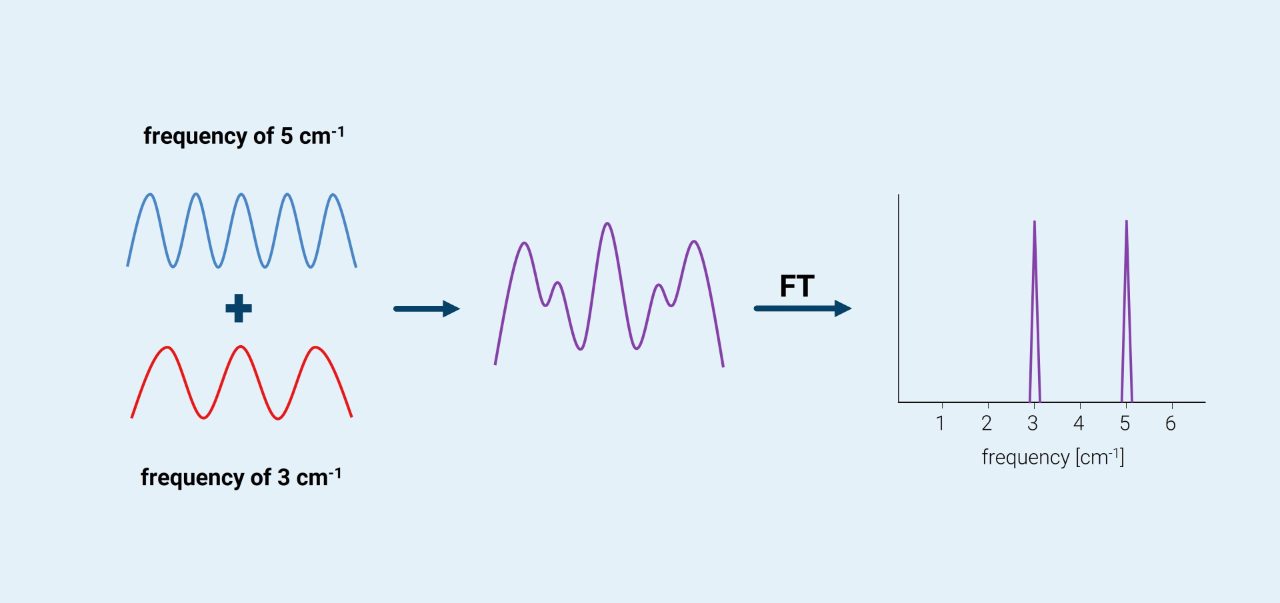
Luckily, there is a mathematical function, called the Fourier Transform, that can do this which can be performed quickly using computer software. The Fourier Transform takes data resulting from the interference of waves with different frequencies and extracts the frequencies of the original waves.
For example, if two waves with frequencies of 5 cm-1 and 3cm-1 interacted, the resulting interference pattern would look very complicated, and it would be difficult to determine which frequencies of light were originally present. When the Fourier transform is applied, the result is two signals showing the frequencies of the two original waves, one at 3 cm-1 and the other at 5 cm-1.
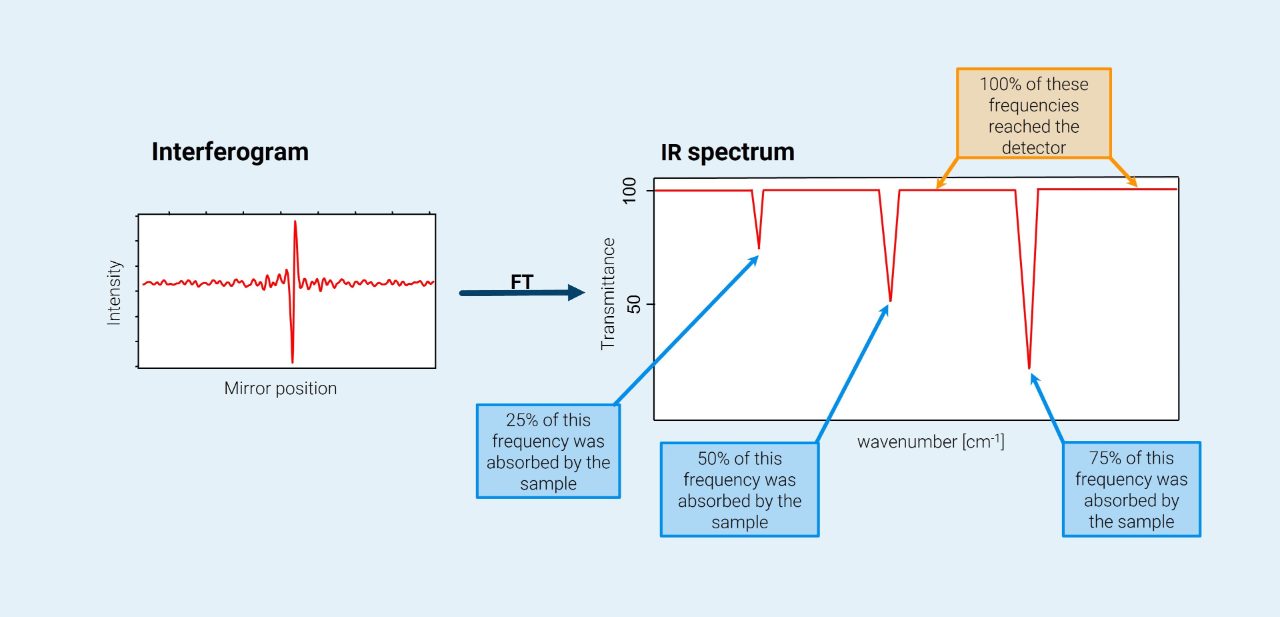
In an FT-IR experiment, the interferogram contains information about the many different frequencies of IR light that reached the detector after interacting with the sample. By applying the Fourier transform to the interferogram, the frequencies of IR light that the sample absorbed can be extracted. This results in the familiar IR spectrum.
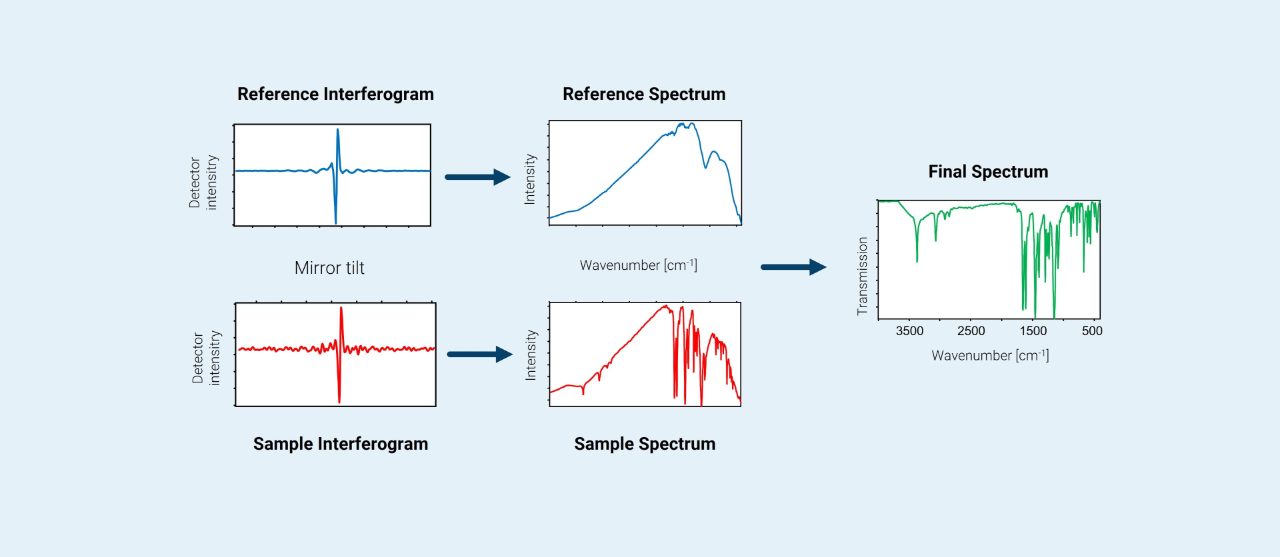
However, one additional step is performed to ensure the resulting spectrum is clean and high quality. This is done because the IR light travelling through the sample may also interact with compounds in the environment, such as carbon dioxide or water, and the IR light that is absorbed by those compounds can show up on the spectrum. To avoid this, a reference interferogram is created by measuring the IR light absorbed without the sample present. The Fourier transform is then used on the reference interferogram to create a reference spectrum. Then, the sample IR spectrum can be divided by the reference IR spectrum to obtain the final IR spectrum.
This process yields a high-quality spectrum with excellent signal to noise ratio that can be obtained very quickly, offering clear advantages over dispersive IR spectroscopy. While the inner workings of an FT-IR spectrometer are complex, the technique itself is extremely easy to perform, making FT-IR an ideal chemical analysis technique for a wide range of applications.