Switching Spectroscopy Piezoresponse Force Microscopy (SS-PFM)
Switching Spectroscopy Piezoresponse Force Microscopy (SS-PFM) mode enables highly accurate nanoscale characterization of the properties of ferroelectric materials, expanding upon standard Piezoresponse Force Microscopy (PFM) by greatly improving the sensitivity and accuracy of measurements. This mode:
- Eliminates the electrostatic artifacts that can influence signals measured by traditional PFM modes while achieving comparatively higher sensitivity.
- Provides hyperspectral maps of ferroelectric key parameters, revealing information about the XY heterogeneity of a sample and its correlation with other properties with an otherwise unattainable level of detail.
- Enables quantification of key parameters of the ferroelectric hysteresis loop and comparison of material performance across instruments, labs, and probes.
Used alone or in conjunction with other AFM operational modes, SS-PFM provides new insights into the material microstructure/polarization switching relationship, supporting next-generation ferroelectric materials research.


Achieve Higher Sensitivity for Ultimate Low Signal Performance
The signal levels in PFM are generally small, with typical amplitudes <10 pm/V. This is at the limit of what an AFM can detect. To address this, one of two approaches are generally taken:
- Increasing the AC stimulation voltage, which would increase the PFM signal, or
- Mechanically amplifying the small PFM signal using the contact resonance of the cantilever.
For many samples, arbitrarily increasing the AC stimulation voltage is not a practical approach. Sample domains will flip (pole) if coercive bias is exceeded; the measured amplitude will not be accurate. This is especially true for thin films where the coercive bias is often lower.

To characterize low response ferroelectrics without domain flipping, SS-PFM:
- Improves the signal-to-noise ratio by applying the AC voltage near the contact resonant frequency of the cantilever and measuring the response.
- Provides accurate measurements of both amplitude (A) and quality factor (Q) of the resonance to enable quantification of the response (A/Q). Note that accurate quantification of CR amplitude requires calculation of the resonant shape factor (Balke, Nanotechnology, 27, 42, 2016).
- Achieves more accurate measurements of A, Q, and phase by using frequency sweeps and lock-in amplifiers to measure response, allowing longer integration times for ultimate low signal performance.
Perform Accurate Hysteresis Loop Measurements
Eliminate Artifacts
Standard PFM allows the measurement of ferroelectric behavior with nanoscale resolution, but measured signals can be influenced by electrostatic forces on the cantilever, as well as ferroelectric response. These can cause errors in hysteresis loop quantification, and can even misidentify non-ferrous materials as ferroelectric. The electrostatic artifact can be significantly decreased by positioning the beam-bounce laser at the lever's electrostatic blind spot (ESBS) while using sub-resonance PFM (Killgore, Nanoscale Advances, 4, 8, 2022).
SS-PFM mode provides:
- Both off-field and on-field loops, separating read and write measurements with SS-PFM scripted spectroscopy.
- Examination of electrostatic artifacts by acquiring data at different read voltages as well as different write voltages (Balke, Nanotechnology, 27, 42, 2016).
- Compatability with either resonant PFM for improved response or sub-resonant PFM with laser at ESBS for more quantitative measurements (Killgore, Nanoscale Advances, 4, 8, 2022).
- Unambiguous phase and correct direction of hysteresis loop (and characterization sign of electrostrictive coefficient) with DCUBE-CR-PFM (Neumayer, Journal of Applied Physics, 128, 17, 2020).

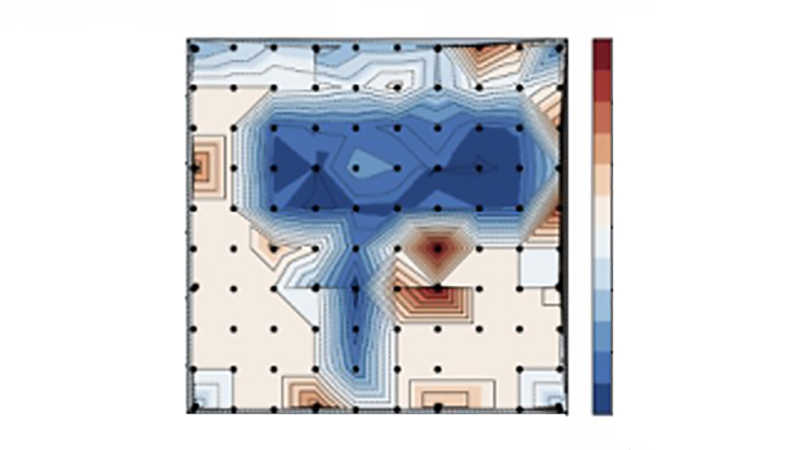
Map Ferroelectric Parameters
By collecting and analyzing an array of SS-PFM spectra, it is possible to generate maps of the key piezoelectric parameters, demonstrating the variation in the ferroelectric properties across the XY plane with nanoscale resolution.
SS-PFM delivers:
- Highly sensitive and repeatable point measurements of the key ferroelectric parameters from the hysteresis loop.
- Quantitative information—inaccessible via simpler imaging modes—through hyperspectral analysis of script data.
- Maps of ferroelectric material properties, which can be correlated with properties drawn from other maps (piezoelectric map, chemical map, etc.).

Avoid Contact Mode for Repeatable Results
Standard PFM operates in contact mode, which is not suitable for samples that are susceptible to damage or displacement by the AFM tip dragging across the sample surface during the scan. Softer probes could partially mitigate this issue, but are more prone to electrostatic artifacts in the PFM measurements.
Like Bruker's unique DCUBE-PFM modes, SS-PFM avoids dragging the tip on the surface. This eliminates the harmful lateral forces that plague conventional contact mode based approaches. When combined with PeakForce Tapping and MIROView for pre-scanning and navigation, contact mode can be avoided completely.
SS-PFM mode supports:
- Low-impact scans of delicate samples like polymers, fibers, and nanoparticles.
- Enhanced tip lifetime when working with hard samples.
- More consistent PFM images without compromising signal measurement accuracy.

Ease of Use and Flexibility in Experimental Design and Analysis
Innovation with Advanced Software and Analysis
Bruker's state-of-the-art, easily accessible software and analysis tools provide the flexibility researchers need.
- Our easy-to-use script generator can create the switching waveform script from seven key parameters. Advanced users can also create unique scripts in XML.
- Open-source Python-based analysis code enables researchers to see exactly how analysis works and develop innovative approaches to analyzing SS-PFM data.
- For researchers developing their own electronics, a Signal Access Module (SAM 6) allows hardware access to raw signals and can also provide high voltage for samples with large coercive biases.

Seamless Integration with the New NanoScope 6 Controller
PFM-type experiments are particularly sensitive to background and crosstalk influences. Integration with the new NanoScope 6 controller reduces these influences, providing highest performance background and crosstalk via optimized lock-in amplifiers and signal routing.
This benefits many AFM operational modes, yet it provides unique advantages for PFM-type modes (like SS-PFM) including:
- Simpler analysis due to improved signal to noise.
- Clean, accurate measurements; even with low level signals at high frequencies.


REFERENCES:
- N. Balke, S. Jesse, P. Yu, B. Carmichael, S. V. Kalinin, and A. Tselev, “Quantification of surface displacements and electromechanical phenomena via dynamic atomic force microscopy,” Nanotechnology, vol. 27, no. 42, 2016, doi: 10.1088/0957-4484/27/42/425707
- J. P. Killgore, L. Robins, and L. Collins, “Electrostatically-blind quantitative piezoresponse force microscopy free of distributed-force artifacts,” Nanoscale Advances, vol. 4, no. 8, pp. 2036–2045, 2022, doi: 10.1039/D2NA00046F
- S. M. Neumayer et al., “Piezoresponse amplitude and phase quantified for electromechanical characterization,” Journal of Applied Physics, vol. 128, no. 17, p. 171105, Nov. 2020, doi: 10.1063/5.0011631