Application Note: Improving the Accuracy of Nanomechanical Measurements with Force-Curve-Based AFM Techniques
The structure and mechanical properties of sub-micron features in materials are of particular interest due to their influence on macroscopic material performance and function. Atomic force microscopy has the high resolution and force control to directly probe the mechanical properties of a wide range of these materials.
This application note discusses the development and implementation of several new features that improve the flexibility, accuracy, and productivity of atomic force microscopes (AFMs) in measuring such important material properties as modulus and adhesion.
Introduction
Single-point measurements that monitor the force exerted on the sample versus the Z-piezo position of the cantilever are one of the most popular routes to obtaining nanomechanical information by atomic force microscopy. These measurements are commonly referred to as force curves or force spectroscopy. The force curves can be fit with a variety of contact mechanics models to extract useful properties of the sample, such as stiffness (modulus) and adhesion. These measurements are widely used and have been available since the earliest days of atomic force microscopy, however they suffer from many challenges including slow acquisition speed for mapping and the need for calibration of multiple parameters associated with the atomic force microscope (AFM) cantilever.
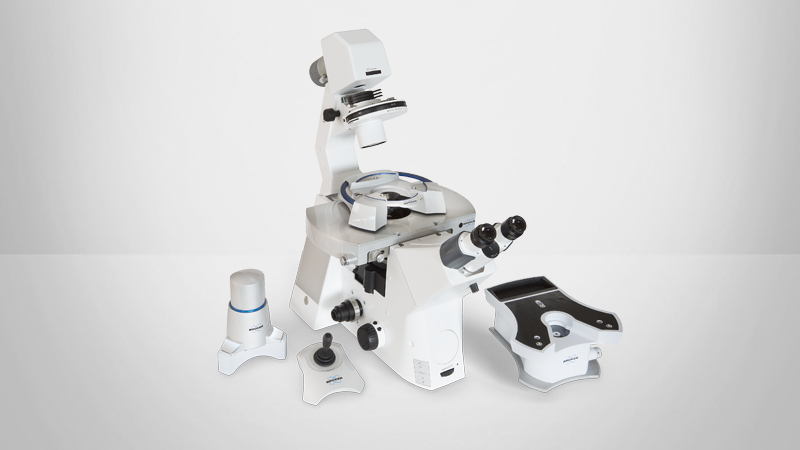
Addressing the speed problem, FASTForce Volume™ has been introduced on Bruker Dimension Icon®, Dimension FastScan®, BioScope Resolve®, and MultiMode® AFM systems to improve force spectroscopy measurements. Building on the conventional force curves, FASTForce Volume can make the same measurement but at much higher ramp rates, resulting in a tenfold decrease in acquisition time. For example, a force curve map of 128x128 pixels previously took 30 minutes, but now only takes about 3 minutes. The same maps of modulus, adhesion, and height in real time are still performed, but at a faster speed, which enables higher measurement throughput.
Another, even faster, approach to force-curve mapping is PeakForce Tapping®. Since its introduction in 2009, PeakForce Tapping has become one of the most popular tools for AFM measurements available. It is a straightforward, easy-to-understand method that requires minimal setup beyond cantilever installation and laser alignment, and it is applicable to almost any surface and any material. When coupled with ScanAsyst®, which optimizes the critical operating parameters, it is one of the easiest atomic force microscopy methods to set up.
PeakForce Tapping is a non-resonant method based on force curves conducted with direct force control at ultralow forces. This technique provides a number of well-known advantages including high resolution, minimal lateral forces, and minimal wear on the tip. Capabilities to characterize other material properties have been successfully built onto the PeakForce Tapping platform. These include methods for characterizing both electrical properties (PeakForce TUNA™, PeakForce KPFM™, PeakForce sMIM™) and mechanical properties (PeakForce QNM®).
PeakForce QNM builds on PeakForce Tapping by analyzing the force curves in real time to extract relevant material properties, such as the DMTModulus (modulus by fitting to the DMT model), adhesion, indentation, and deformation. PeakForce QNM, like other AFM methods, has been subject to challenges in calibrating the system and with modeling the behavior of the sample under load by the AFM tip, which can limit the accuracy and repeatability of nanomechanical measurements. Bruker has developed a series of significant advances in both hardware and software that provide major improvements in the performance and productivity of PeakForce QNM and FASTForce Volume.
Probe manufacturing and the calibration of spring constant and tip shape
One of the greatest challenges in acquiring quantitative AFM nanomechanical measurements has been probe tip shape. Tip geometry and size figures prominently into the contact mechanics used to model tip-sample interactions. One of the most popular contact mechanics models used to model AFM tip-sample interactions is the classical Hertzian model (or Hertzian-based DMT, which includes some adhesion outside the tip-sample contact) in which there is a direct, well-known relationship between the load exerted on the sample (F) by a spherical probe with radius (R):
(where E* is the reduced modulus, and d is the deformation of the sample). Both the tip radius and tip shape appear explicitly in this equation, the latter as the exponent 3/2 on the deformation (d), which depends on the tip geometry. Both are highly variable in commercial AFM tips typically used for imaging.
Bruker now supplies pre-calibrated probes with rounded, well-defined, tips that provide confidence in the diameter and tip shape. These probes are offered in a range of spring constants from 0.25N/m to 200N/m to access measurements on a wide variety of samples. Their rounded tips are individually measured via SEM to ensure a nominal radius of 30nm, which smoothly transitions into a cone with a half angle of 25 degrees. This provides a controlled contact area for various indentation depths up to 100nm.
The spring constant of each individual probe is also pre-calibrated with a laser doppler vibrometer (LDV) to provide the most accurate measurement available for this important cantilever parameter and to obviate the user from having to do this step. Thus, the only remaining unknown parameter in Equation 1 is the photodiode sensitivity, which can be calibrated either through a thermal tune or by conducting a force curve on a stiff sample, such as sapphire. The pre-calibrated parameters, including the spring constant, resonance frequency, quality factor, tip radius, and tip half-angle, are easily read into the system by scanning the QR code on each cantilever box. The user simply needs to select which probe is being used in the experiment and all the parameters are appropriately populated into the system calibration and control parameters file.
Z calibration
One of the challenges of implementing PeakForce QNM has involved the Z piezo calibration. PeakForce Tapping (and PeakForce QNM) uses a sinusoidal Z motion where the Z piezo position is defined as:
where the amplitude (A) and phase (φ) can vary with frequency and depend on both the system and precise configuration. New parameters (Sync Distance QNM for phase and PFT Amplitude Sens for amplitude) have been introduced to manage these parameters. The calibration process of these new parameters can be done with a few clicks of the mouse. The dialog used to conduct this calibration is shown in Figure 2. On a stiff sample like sapphire, a user-specified number of force curves are collected and analyzed to calibrate the deflection sensitivity. Once the deflection sensitivity is measured, the bottom panel is used to calibrate the phase and amplitude parameters. A set of force curves are conducted at the frequency of the PeakForce Tapping measurement and the software automatically calculates the required QNM Sync Distance and PFT Amplitude Sensitivity. These parameters can be calculated at multiple frequencies and then stored for convenient future use. Alternatively, the PFT Amplitude can be calibrated automatically after engage by using the Z sensor in the Icon scanner.
Improved modeling in data analysis
New tip shape and contact mechanics models are now offered in the PeakForce QNM software for comprehensive modeling capabilities to cover a wide range of materials and tip-sample interactions. PeakForce QNM imaging uses the Derjaguin-Muller-Toporov (DMT) model for real-time analysis during acquisition. Thus, the resulting modulus maps are labeled “DMTModulus”. This model is appropriate for many materials and accounts for a small amount of adhesion outside of the contact. However, other models might be more appropriate for a given sample, such as soft materials with significant adhesion (e.g., JKR), or where a simpler approach (e.g., Hertz or Sneddon) that does not require adhesion is sufficient. A variety of models are now offered for off-line analysis, including Hertz, DMT and JKR for spherical or parabolic tips. Additionally, the Sneddon model is provided for pyramidal and cone-shaped tips, while a cone-sphere model is available for tips that begin with a spherical apex and transition to a conical shape.
In addition to increased variety, there are also other recently implemented software improvements available. Multiple algorithms are now offered to calculate the adhesion, as well as differing methods to fit the baseline. A new PeakForce Capture™ capability provides a way to save a force curve for every pixel in the image. PeakForce Capture data files share the same data structure as Force Volume and can be analyzed in the same view, allowing easy comparison of results from PeakForce Tapping with those from Force Volume (using the same analysis tools). This new comprehensive analysis package is offered in an easy-to-use GUI for full customization and flexibility in fitting PeakForce QNM data on a wide variety of materials, and with a variety of probes.
Improved accuracy
Using the enhancements described above, great improvement in the PeakForce QNM method for quantitative measurements has been observed across a variety of samples. Figure 3 shows a PeakForce QNM image of a three-polymer blend of polypropylene (PP), polystyrene (PS), and polyethylene (PE). The figure resembles a “snowman” where the dark head is the PE component, the bright body is PS, and the background is PP. A set of five Bruker RTESPA-300-30 probes were used to measure this sample. These probes were among the ones described above with the 30nm rounded tips and LDV pre-calibrated spring constants. No reference sample was required – the only calibration needed was provided by the QR code on the box (Figure 1) and the guided calibration dialog (Figure 2).
The chart on the bottom of Figure 3 shows a comparison of the DMT modulus (red bars) as compared with the corresponding modulus measured on a dynamic mechanical analyzer (DMA) in the blue bars. The PeakForce QNM data is an average of the data collected from the five cantilevers. Note that the DMA values have been time-temperature superposed to the high frequency of 2kHz for appropriate comparison with the AFM data.
The moduli for the PP and PS match well with their DMA counterparts and are well within the error of the measurement. The PE modulus is low compared to the DMA PE value. One possible explanation is that the adhesion on the PE is higher than on the other two components, which may complicate the measurement and subsequent modeling used for this material. Another possibility is that the PE modulus could have been affected by the processing of the blend. In summary, the AFM measurement captures correctly the trend between the three materials as well as provides excellent quantitative measurements on the PP and PS – all “out of the box” without use of a reference sample.
Bridging over a large frequency range
PeakForce QNM measurements are now possible over a range of frequencies from 125Hz to 2000Hz. This enables frequency-dependent measurements, which are particularly interesting for viscoelastic materials that can exhibit significant frequency dependence. In addition, FASTForce Volume (FFV) measurements cover the low end of the spectrum from 1Hz to over 100Hz. In total, AFM-based force-curve measurements can now bridge the large frequency range from 1Hz to 2000Hz.
An example of such a bridging experiment is shown in Figure 4 on a blend of PS and LDPE. The same area of the sample was imaged with a range of frequencies in force volume, and then was switched over to PeakForce QNM to access the higher frequencies. The modulus (fit to a DMT model) as a function of frequency is thus plotted for both samples, with the PS modulus in blue and the LDPE modulus in red. The PS modulus remains constant, while the LDPE modulus increases with frequency, highlighting the frequency dependence of the LDPE and frequency independence of PS in this range.
Another example of a bridging experiment is shown in Figure 5a where the modulus (as measured by a DMT fit) of polyvinyl chloride has been measured in the identical area from 1Hz on the bottom all the way to 2kHz on the top. All the images are shown on the identical Z scale. The data collected at 1Hz, 10Hz, and 61Hz were collected in force volume while the data in 125Hz through 2kHz was collected through PeakForce QNM. The modulus versus frequency plot is shown in Figure 5b revealing a gradual increase in modulus over this frequency range. As the frequency increases above 500Hz, there is improvement in discrimination of the structure of the PVC. This material has additives and particulates that become integrated into the sample during the synthesis and molding process, and so these patches of soft additives and the particles become more evident with high frequency.
The modulus plot in Figure 5b was generated by fitting both the retract curve (points in red) and the approach or extend curves (points in blue). Fits of individual curves are shown in Figure 5c (approach) and Figure 5d (retract). The DMT model does not take into account viscoelastic deformation, resulting in different modulus values based on fitting the approach and retract portions of the curve.
When comparing these AFM force curve experiments to bulk viscoelastic measurements, a word of caution should be considered. Some AFM-based mechanical property measurements, such as contact resonance and force modulation, tend to use small perturbations to the applied force, so a linear response can be assumed during analysis. In contrast, force-curve-based and tapping-based methods that use larger amplitudes make and break contact during the motion cycle and are, therefore, not operating in a linear response regime. Additionally, the frequency the sample experiences in these measurements is not only the ramp rate or drive frequency parameter that is set by the user. The sample experiences that frequency as well as higher order harmonics, due to motion of the tip during the interaction. Any direct comparison with other frequencydependent measurements, such as dynamic mechanical analysis (DMA), should only be done with these caveats in mind. We trust the AFM community will be revisiting this topic in the near future as nanomechanical measurements on viscoelastic samples become more quantitative and accurate.
Limits of uncertainty
Even with all the significant hardware and software improvements, AFM-based methods are inherently limited by the uncertainty of system parameters, such as tip radius, spring constant, and deflection sensitivity. An error analysis was conducted to better understand the various contributions and their magnitude to error in force volume measurements of modulus.
As described in Equation 1, the well-known Hertzian-based DMT model relates F (the load exerted by a spherical probe on a surface) to the reduced modulus (E*), probe radius (R), and amount of deformation (d=Z-D) in the sample through the following relationship:
F=Kc *D where Kc is the cantilever spring constant, and where D=SDV is the cantilever deflection and SD is the deflection sensitivity, and V is the measured deflection voltage.
The variance formula thus estimates the error in the reduced modulus, resulting in the equation below:
To estimate the error in modulus, the following (two sigma) errors were assumed in the other parameters: δR ~15%, δKc ranging from ~6%, 8%, 10%, and 16% for softest to stiffest spring constant, δSd ~5%, δV ~1% and δZ~1%.
A plot is shown in Figure 6 of the estimated error in modulus by force volume calculated for a set of four Bruker cantilevers with constant force (ScanAsyst-Air-HPI-30 [SAA-HPI-30] at k~0.25N/m; RTESPA150-30 at k~5N/m; RTESPA300-30 at k~40N/m; and RTESPA525-30 at k~200N/m). This analysis was done assuming a constant force is exerted on the sample for each of the cantilevers.
The plot reveals a baseline error of about 12%, with error varying substantially based on the cantilever coupled with the sample modulus being probed. It is well understood that the cantilever stiffness should match the contact stiffness for the cantilever to be able to appropriately sample the material. If the cantilever is too stiff relative to the sample, only the cantilever’s properties will be measured. If the cantilever is too compliant or soft relative to the sample, there will be insufficient deformation into the sample to measure its properties.
Figure 6 shows that the incorrect lever for a particular sample can significantly increase the error in the modulus measurement. For example, the softest lever (SAA-HPI-30) is appropriate for samples with a modulus of a few MPa, but generates a significant error in modulus of almost 50% if used to measure a sample with 100MPa modulus. Similar observations exist for all the levers. Generally speaking, the error in the low modulus limit is dominated by errors in the tip radius and cantilever spring constant while the error in the high modulus limit is dominated by error in deflection sensitivity (Sd) and Z piezo position. For modulus measurements at constant deformation, the error increases for soft samples due to baseline deflection noise (data not shown).
Figure 6 reveals the limitations on accuracy of the modulus measurement that can be obtained with force volume. The error increases slightly for PeakForce QNM measurement where there is more error in knowing the Z position. In this case the amount of Z position error depends on contact time and error in Sync Distance QNM. For PeakForce QNM with a contact time of 10% and Sync Distance QNM error ~0.12%, the predicted modulus errors increase by about 3% as compared to force volume error, resulting in a baseline error in modulus measurement with PeakForce QNM of about 15%.
Guidelines for implementation
The most critical experimental parameter a user needs to set in force spectroscopy measurements happens before any experiment even starts, and that is the selection of the spring constant. As discussed above, picking a lever that is too soft will result in too much compliance in the lever, poor sampling of the sample, and thus a large error in the modulus. Selecting a cantilever that is too stiff results in the same problem through not enough compliance in the lever. Figure 6 serves as a guideline for spring constant selection based on the sample modulus. For soft materials under 10MPa, a soft lever such as a ScanAsyst-Air-HPI-30, or even a RTESPA-150-30, is appropriate. In the intermediate range of 10MPa – 200MPa, the RTESPA-150-30 functions well. The RTESPA-300-30 with a 40N/m spring constant covers the important range of moduli from 200MPa to about 5GPa. As mentioned above, measurements on very soft samples start to be impractical with the stiffer probes due to increased baseline noise. Table 1 summarizes these modulus recommendations for different cantilever types.
Another important parameter to optimize is the indentation into the sample on each force curve. An indentation of 1-3nm into the sample is recommended, which can be controlled by the trigger threshold parameter. An indentation of less than 1nm means that the probe is probably not penetrating into the sample enough. Higher indentations (>100nm) risk contaminating the probe unnecessarily and also can access the part of the tip where the tip geometry is not controlled. It is important to acquire enough data points in the contact part of the curve for the contact mechanics to get a reasonable fit. This can be done by decreasing the ramp size or increasing the number of sample points per curve in force volume. In PeakForce QNM, it can be done by decreasing the PFT amplitude, decreasing the PFT frequency, or by increasing the PeakForce Setpoint.
Conclusions
PeakForce QNM and FASTForce Volume provide convenient and highly productive force-curve-based platforms for nanomechanical measurements. Significant improvements have been made in the last few years to improve the flexibility, accuracy, and productivity of these important tools to measure material properties, such as modulus and adhesion. Bruker AFMs now feature new and easy-to-follow calibration steps combined with pre-calibrated, well-defined AFM tips for superior accuracy in measurements. New software capabilities in modeling and analysis expand the utility of the measurement to a wide variety of samples. Finally, probing the various properties as a function of frequency is now possible over a wide range, broadening horizons to fully explore properties of viscoelastic materials.
Authors
- Bede Pittenger (Bruker Nano Surfaces)
- Dalia Yablon (SurfaceChar)
©2017 Bruker Corporation. All rights reserved. BioScope Resolve, Dimension FastScan, Dimension Icon, FASTForce Volume, MultiMode, PeakForce Capture, PeakForce KPFM, PeakForce QNM, PeakForce sMIM, PeakForce Tapping, PeakForce TUNA, and ScanAsyst are trademarks of Bruker Corporation. All other trademarks are the property of their respective companies. AN149, Rev. A0.
