Tech Note: Next-Generation AFM Force Mapping of Challenging Samples with SmartMapping
Improving the ease and efficiency of large-area sample mapping
Atomic Force Microscopy (AFM) is a high-resolution imaging technique that delivers 3D topographic profiles of sample surfaces, while characterizing their nanoscale biomechanical properties. Performing AFM measurements over large surface areas on rough and highly corrugated samples, like living cells and tissues, can be challenging. Furthermore, traditional AFM maps are typically limited to quadratic shapes, which can lead to the collection of irrelevant information and inefficient data acquisition.
This technical note presents the SmartMapping feature and its key innovative functionalities that address these challenges, thereby enhancing AFM performance and efficiency. SmartMapping simplifies AFM measurements by allowing the selection of multiple, user-defined mapping areas around the sample, which are then mapped sequentially in an automated process. SmartMapping enables fully autonomous, long-term experiments and significantly advances the flexibility and ease of measuring challenging samples.
Readers can expect:
- An overview of SmartMapping and its advanced features
- An outline of key technical innovations, automation features, and batch data processing capabilities
- A brief overview of applications illustrating its capabilities on a range of soft, large-area, and topographically complex samples, such as hydrogels, cells, tissues, and spheroids
KEYWORDS: BioAFM; Atomic Force Microscopy; Cell Biology, Spheroids; Hydrogels; Nanomechanical Mapping
Atomic force microscopy (AFM) is an invaluable technique for determining the nanoscale mechanical properties of a diverse scope of samples, ranging from hard materials to soft and challenging biological matter. It offers unparalleled high-resolution capabilities, delivering critical insights into material behavior, in particular, in the complex and heterogeneous structures of polymers, composites, and biological samples. AFM generates detailed quantitative maps of sample properties, such as Young’s Modulus (stiffness), adhesion force, and viscoelasticity, crucial properties in the analysis of mechanical variability at small scales.1
AFM is also a key technique for determining the biomechanical properties of living cells, tissues, and biomaterials, significantly enhancing the investigation of cell behavior, disease progression (e.g., in cancer, fibrosis), and the effects of therapeutic agents.2 In addition, AFM can be used to measure molecular-level forces, advancing our understanding of protein folding, biomolecular interactions, and DNA mechanics.3 AFM achieves nanometer resolution over micrometer or even millimeter-sized regions, which is particularly relevant for samples like hydrogels, cell layers, and biological tissues. Furthermore, it requires minimum sample preparation and measurements can be performed under near-physiological conditions.4
Several challenges arise, however, when performing mechanical mapping over large surface areas, in particular when investigating rough, soft, or highly deformable samples. Even well-prepared samples can exhibit significant height variations when examined over hundreds of micrometers. The Z-piezo of an atomic force microscope, which tracks topography, typically operates within a range of 15 microns, which can easily be exceeded when measuring biological samples. In addition, the lateral scanning capability of an atomic force microscope is generally restricted to approximately 100 microns. Although it is possible to stitch together multiple smaller scans to cover a larger area, this approach inherently compromises the accuracy of the absolute topographical information.5
This technical note discusses how Bruker’s SmartMapping feature addresses these challenges. It offers additional key functionalities that greatly enhance the performance of atomic force microscopes for biological studies (BioAFMs), simplifying the selection of scanning areas and significantly increasing the efficiency of the measurements.

Advanced Mapping Capabilities for Challenging Samples
SmartMapping marks a significant advancement in the efficiency, flexibility, and ease of performing AFM measurements. It combines five innovative mapping features in one mode to:
- Map sample topographies larger than the Z-scan range of the BioAFM:
Ideal for measuring rough and highly corrugated samples - Map areas larger than the XY-scan range of the BioAFM:
Effective for mapping large samples areas - Select flexible, freehand drawn areas around a sample for automated mapping:
Valuable for selecting specific regions of interest, cell types, or characteristics - Automated correction of cantilever drift:
Necessary for optimal cantilever deflection readout during long-term experiments - Batch acquisition of multiple maps:
Essential for automated collection of multiple, predefined maps and streamlined data acquisition
To tackle samples with irregular, rough topographies that exceed the natural Z-scan range of the BioAFM, SmartMapping combines the high-resolution piezo scanner with the head’s motorized vertical adjustment, enabling large vertical adjustments for the sample height. This is achieved by analyzing the acquired force curves in real time, and when the limit of the piezo is approached, a motor adjustment is triggered.
For lateral mapping beyond the native XY-scan range of the atomic force microscope, SmartMapping merges motorized stage movements with the high-resolution piezo scanning into a unified map. The acquisition time is also optimized by balancing the fast positioning of the BioAFM head with the generally slower translation of the motorized stage. This coordinated approach ensures efficient coverage of larger areas without compromising spatial resolution.

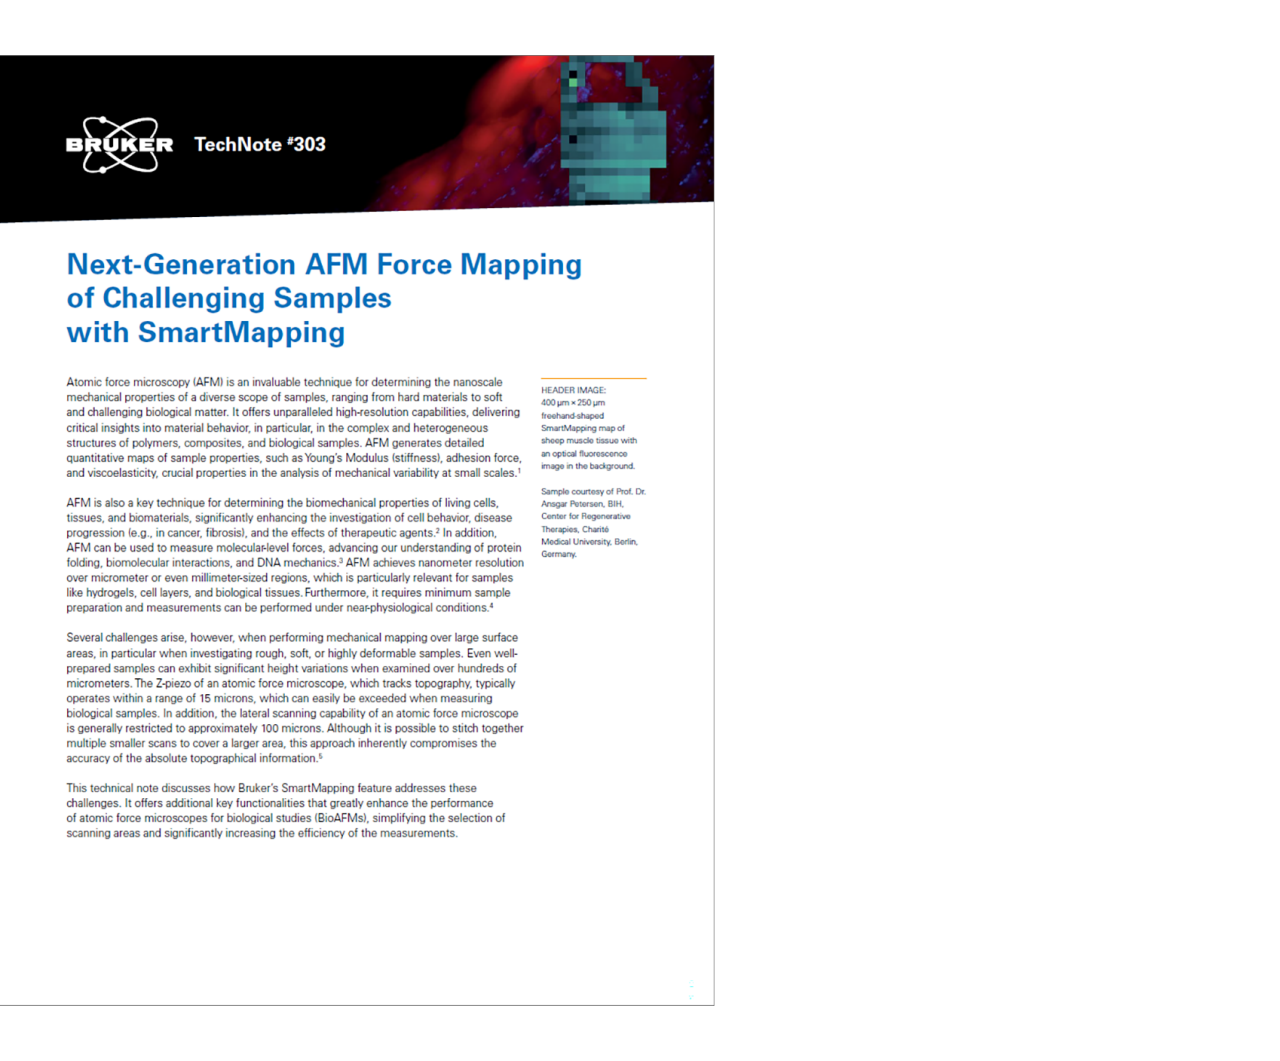
Traditional force maps are typically limited to quadratic shapes, which can lead to the collection of irrelevant information and inefficient data acquisition, in particular when investigating non-quadratic samples, such as cells. SmartMapping addresses this limitation by allowing the user to select arbitrarily shaped mapping areas directly on the optical image and thereby focus on specific regions of interest on the sample (Figure 1).
On compatible BioAFM heads, SmartMapping automatically adjusts the cantilever deflection system, compensating for signal offsets that may arise from factors such as temperatureinduced bending of the cantilever. In addition, users can define multiple distinct scan regions around the sample, which are then mapped sequentially in an automated process. Together, these capabilities support fully autonomous long-term experiments, minimizing the need for user intervention.
Application Examples
The following examples demonstrate the versatility of SmartMapping in BioAFM measurements on a range of soft, large-area, and topographically complex samples, such as hydrogels, cells, tissues, and spheroids. As SmartMapping is highly adaptable, it is also wellsuited for a broad range of non-biological materials.
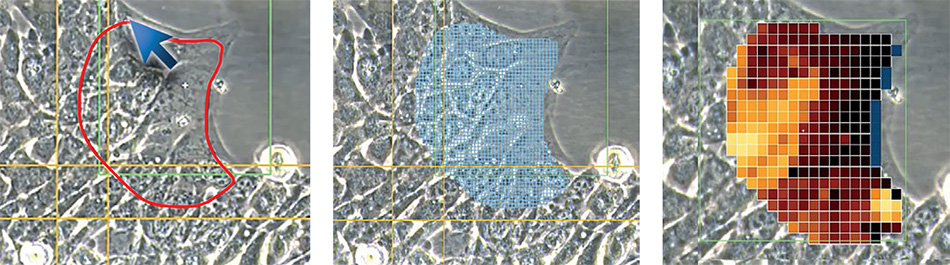
The data presented here were acquired using a NanoWizard® V BioAFM equipped with a motorized stage and a Bruker SAA-SPH-5UM hemispherical probe. To maintain a temperature of 37°C, a PetriDishHeater was used during the mapping of living cells.
Large-Area Mapping of Hydrogels
Hydrogels play a pivotal role in biomedical research owing to their soft nature, high water content, and biocompatibility. Accurate measurement of their mechanical properties, in particular stiffness, is essential, as their functionality is closely tied to their elastic and viscoelastic properties.
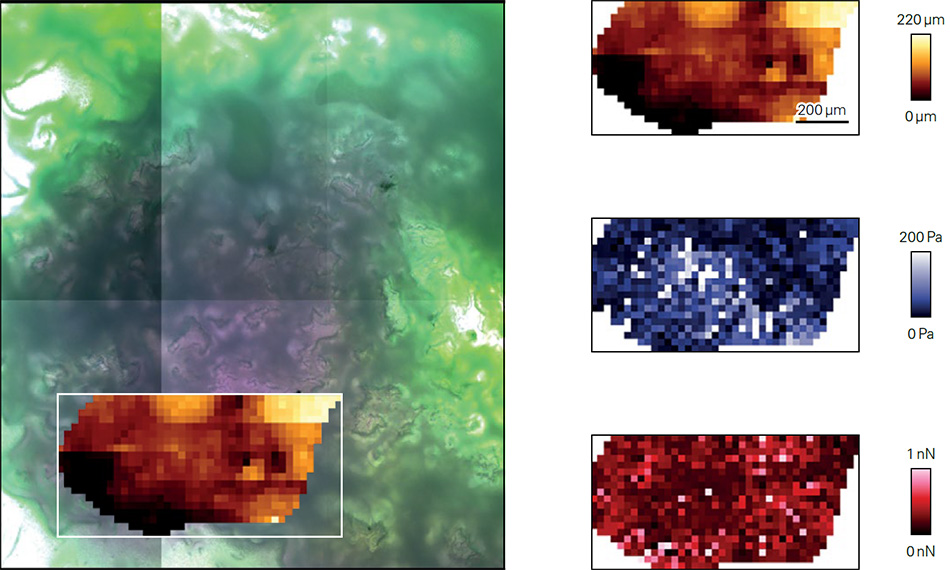
In this example, a commercial 1 kPa polyacrylamide hydrogel with an area of 1 cm × 1 cm was mapped automatically (Figure 2). While AFM is typically regarded as a nanoscale technique, this example highlights the capability of the SmartMapping feature to extend measurements to centimeter-scale areas. Topography, adhesion, and apparent stiffness maps were generated in real-time, and Young’s Modulus was batch-calculated using the native data processing software and Hertzian model for a spherical indenter.

Mapping the Stiffness of 2D Cell Populations on Hydrogels
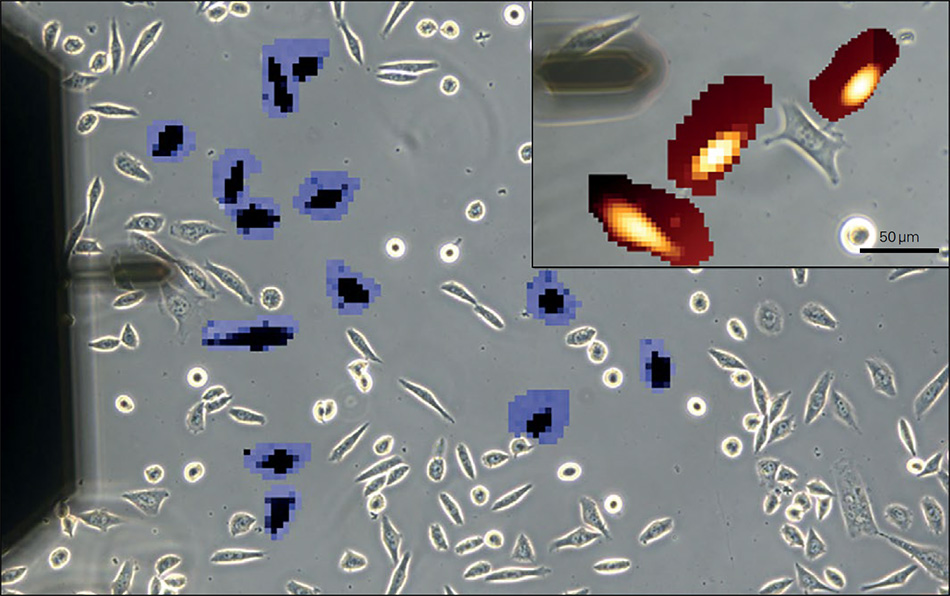
In this example, the stiffness of living cells, seeded on a 50 kPa polyacrylamide hydrogel, was analyzed. Due to the irregular and varied shapes of the cells, using a squared mapping area would include regions on the substrate that are not of interest, which increases the time required to acquire and process the data. While single-point measurements could be an alternative, it is more practical to select an area that conforms to the shape of individual cells (Figure 3).
SmartMapping’s freehand selection feature provides this flexibility, allowing the combination of freehand drawn shapes with quadratic boxes, lines, and single points as needed. The resolution can also be adjusted to improve the capture of specific areas of interest (see Figure 3 inset).
Mapping of Spheroids
Cell-derived spheroids, or three-dimensional (3D) clusters of cells, are attracting significant attention due to their ability to mimic cellular behavior in a way that more realistically reflects a physiologically relevant environment than traditional 2D cell cultures. Spheroids are utilized in various applications, including tumor modeling in cancer research, drug testing in toxicology, tissue engineering in regenerative medicine, and the study of cell-cell and cell-matrix interactions.
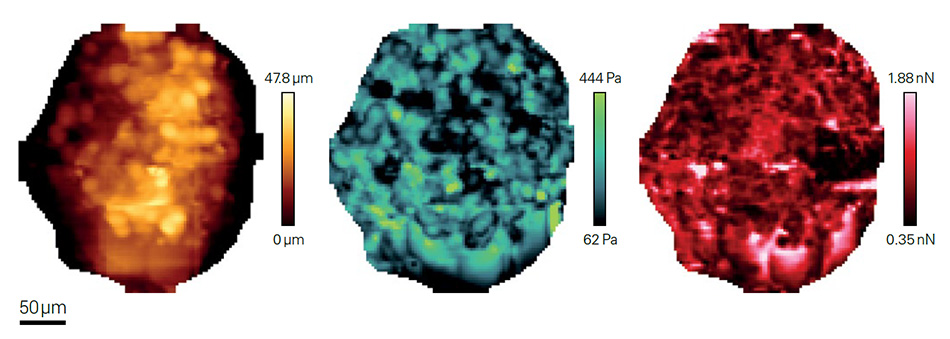
Probing the stiffness of spheroids is important, but can be challenging with conventional atomic force microscopy, as spheroids typically have diameters greater than 100 micrometers, exceeding the typical Z-range of AFM instruments. SmartMapping, however, is an ideal tool for working with these structures. Figure 4 illustrates a fully automated map of the topography, adhesion, and Young’s Modulus of a spheroid, obtained using SmartMapping.
Mapping Living Tissue
In this final example, a neuroblastoma tumor sample taken from an adult zebrafish was examined (Figure 5). After dissection, the specimen was embedded in 3% low-melting agarose, cut with a vibratome into 600 micrometer thick slices, affixed to a petri dish, and measured in PBS using SmartMapping.
In addition to being extremely soft and sticky, nervous tissue samples can also exhibit significant surface roughness, even when sectioned correctly. This roughness can result from the attachment process itself, as tissue-specific adhesives can affect the sample’s topography. These features can hinder the acquisition of accurate mechanical data and present a challenge when trying to successfully examine large sample areas. To overcome this, additional features like the automated adjustment of the Z-position and laser alignment have been implemented in SmartMapping that facilitate accurate large-area force mapping.
Outlook
The use of AFM in the characterization of the mechanical properties of biological samples has long been a cornerstone of biomedical and biomaterial research. The introduction of the SmartMapping feature marks a significant advancement in this field. By seamlessly integrating multiple mapping options with automated Z-piezo adjustments, SmartMapping enhances the precision and efficiency of sample analysis.
SmartMapping opens new avenues for studying samples once considered challenging or even impossible to analyze with AFM, paving the way for more comprehensive and insightful research outcomes. In addition, advanced automation features and batch data processing capabilities significantly increase the speed and ease of AFM measurements, maximizing throughput and the generation of statistically relevant datasets that are essential in biomedical and clinical research.
Acknowledgements
We would like to express our gratitude to Jordan Turney of Swansea University, UK, for his valuable input applying the SmartMapping feature to the measurement of spheroids and his contribution towards this note.
Discussions and critical review of the document by Thomas Henze (Bruker BioAFM) is gratefully acknowledged.
Authors
Alexander Dulebo, Dimitar Stamov, and Joan Carles Escolano
Bruker BioAFM
References
- Krieg M, Fläschner G, Alsteens D, Gaub BM, Roos WH, Wuite GJL, Gaub HE, Gerber C, Dufrêne YF, Müller DJ (2019), Atomic force microscopy-based mechanobiology, Nat Rev Phys 1 (1), 41–57, https://doi.org/10.1038/s42254-018-0001-7/
- Fuhs T, Wetzel F, Fritsch AW, Li X, Stange R, Pawlizak S, Kießling TR, Morawetz E, Grosser S, Sauer F, Lippoldt J, Renner F, Friebe S, Zink M, Bendrat K, Braun J, Oktay MH, Condeelis J, Briest S, Wolf B, Horn L-C, Höckel M, Aktas B, Marchetti MC, Manning ML, Niendorf A, Bi D, Käs JA (2022), Rigid tumours contain soft cancer cells, Nat Phys 18 (12), 1510–1519, https://doi.org/10.1038/s41567-022-01755-0/
- Bao G, Suresh S (2003), Cell and molecular mechanics of biological materials, Nat Mater 2 (11), 715–725, https://doi.org/10.1038/nmat1001/
- Tschaikowsky M, Neumann T, Brander S, Haschke H, Rolauffs B, Balzer BN, Hugel T (2021), Hybrid fluorescence-AFM explores articular surface degeneration in early osteoarthritis across length scales, Acta Biomater 126 315–325, https://doi.org/10.1016/j.actbio.2021.03.034/
- Käs JA, Fuhs T, Müller T, Körnig A (2019), Mapping large areas of life science samples. Wiley Anal. Sci.