Purity of Enantiomers
Purity of Enantiomers
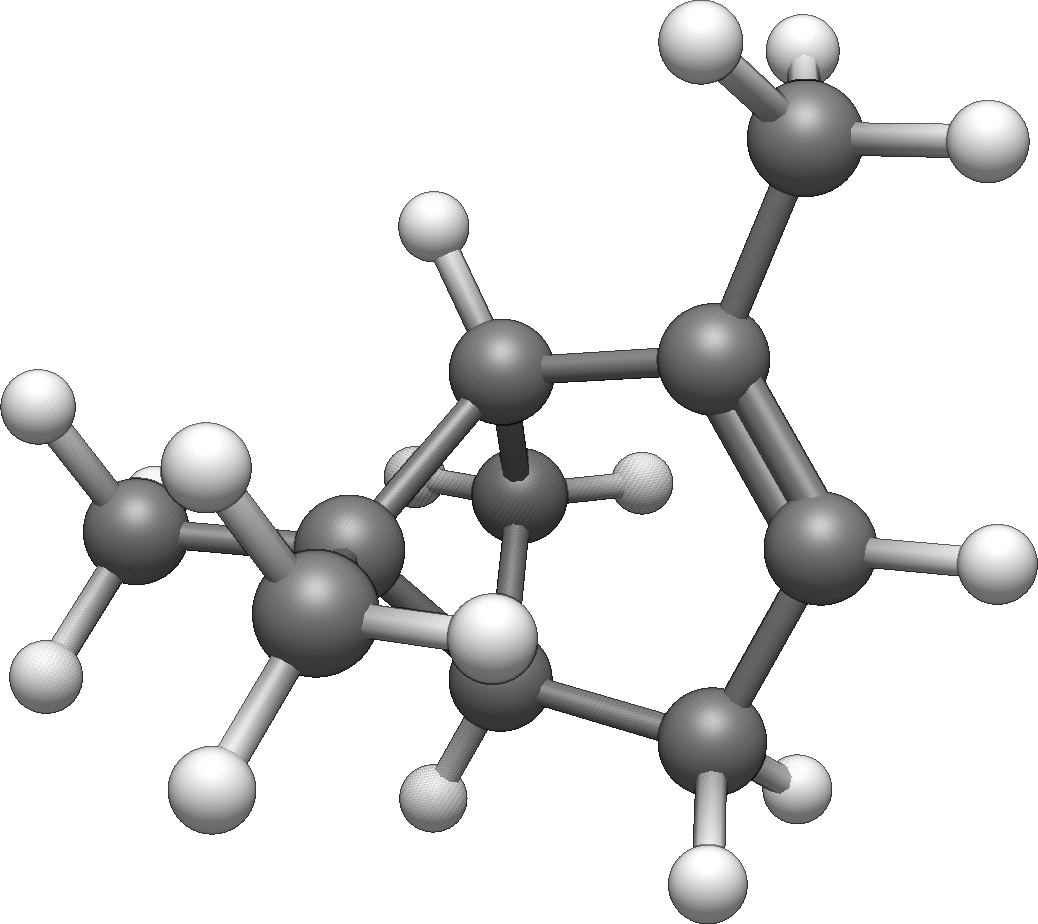
In the right figure VCD (upper) and absorption spectra (lower) of α-pinene in various optical purities are presented which were acquired in a 50 µm KBr liquid cell. (1R)-α-pinene is the blue, (1S)-α-pinene the red VCD spectrum. The colored spectra in between depict the VCD signal from mixtures of both enantiomers in different ratios. From blue to red the VCD spectra of α-pinene with enantiomeric excesses from +100, +75, +50, +25, +10, -10, -25, -50, -75 and -100 are shown. All absorption spectra are congruent.
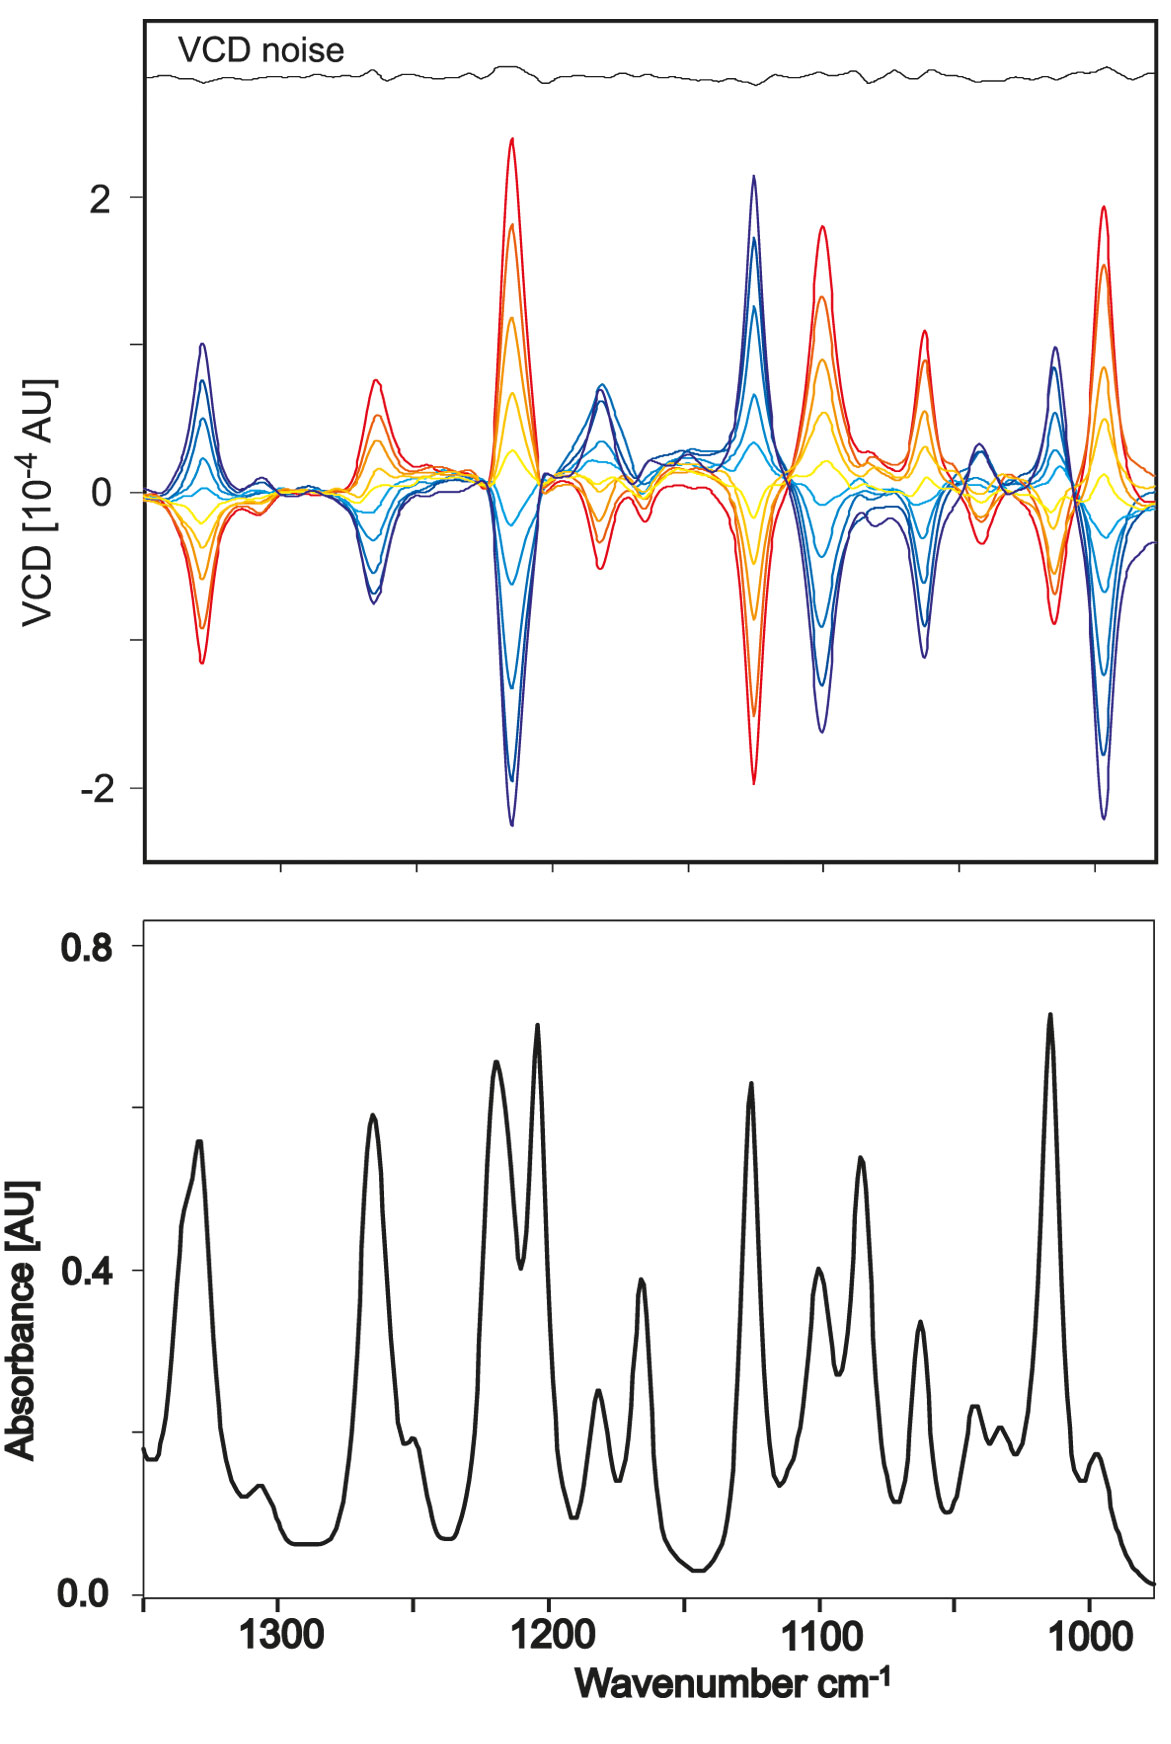
The upper right figure shows clearly: despite of identical absorption spectra both enantiomers (two molecules behaving like mirror and mirror image) result in VCD spectra with opposite sign. VCD spectroscopy allows for a distinction of enantiomers which have by nature the same physical properties. Furthermore optical purity, i.e. the ratio of both enentiomers, can be determined quantitatively. Optical purity is defined as enantiomeric excess:
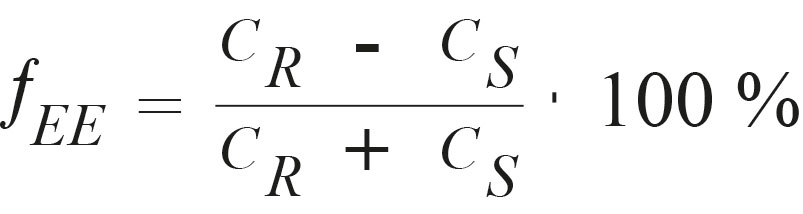
wherein cR denotes the concentration of (1R)-α-pinene and cS the concentration of (1S)-α-pinene. In case of a racemate, i.e. a mixture with equal amount of (1S)- and (1R)-α-pinene, the enantiomeric excess fEE = 0. Consequently the optical activity is lifted and the VCD spectrum is zero in the complete spectral range, too.
Chemometric techniques included in OPUS allow for the determination of unknown optical purity from samples after appropriate calibration with quantitative algorithms.


