AFM-nDMA
How do nanoscale phases differ from bulk? What are viscoelastic properties right near an interface or in an interphase? How does this affect load transfer, as a function of temperature? Nanoscale viscoelastic measurements that are quantitative and can answer these questions have been a long-standing and elusive goal for AFM.
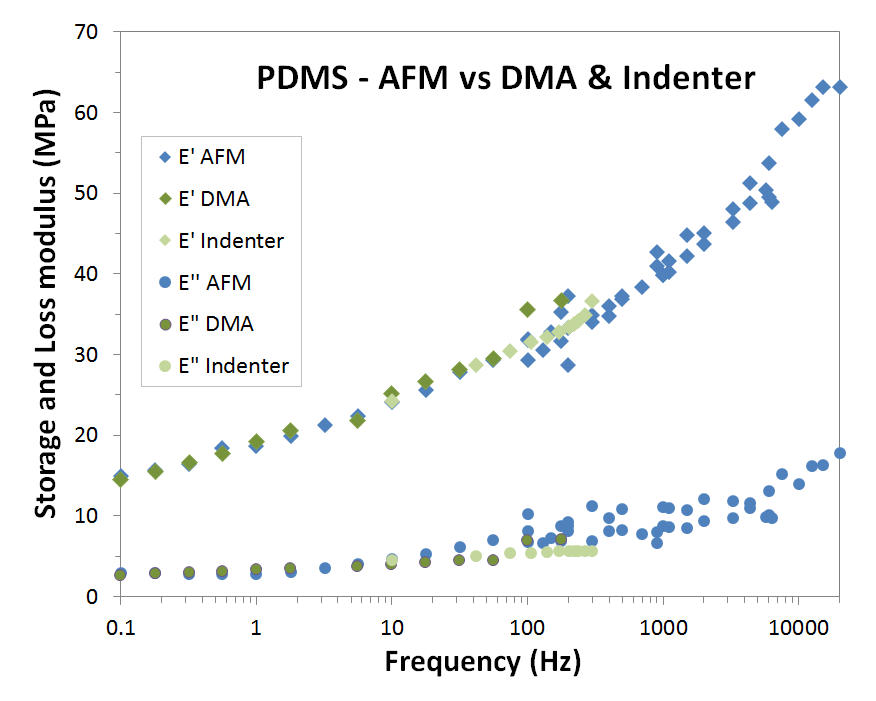
While tracking the tip-surface interaction in AFM provides ample opportunities to sense sample stiffness and viscous drag, traditional AFM approaches have been plagued by nonlinearities in the measurements, use of irrelevant frequencies, effects of adhesion that are not accounted for, and subsequent need to ‘recalibrate’ results. AFM-nDMA™ eliminates all these issues for the first time and provides results that directly match those from bulk DMA and indenter-based nano-DMA.
Accurate Moduli and Loss Tangent at Bulk DMA Frequencies – a First for AFM
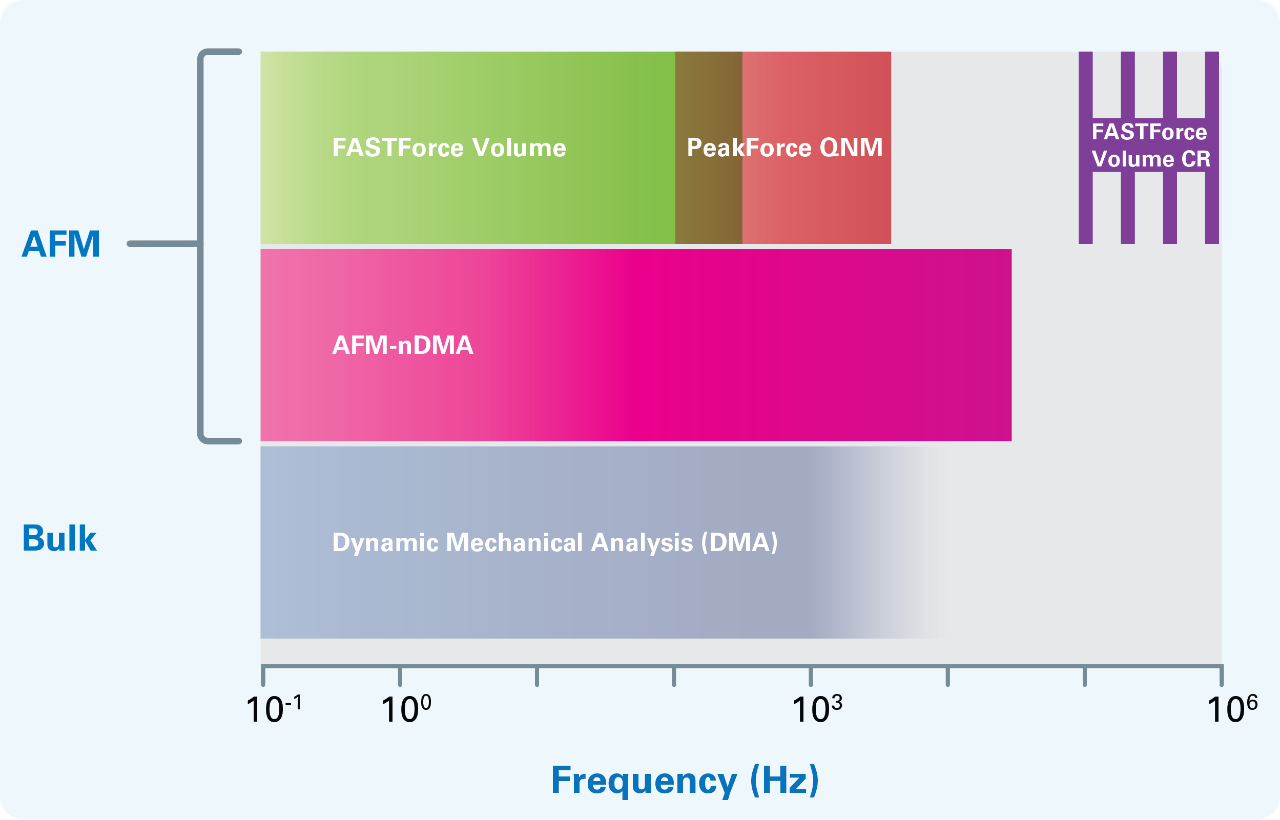
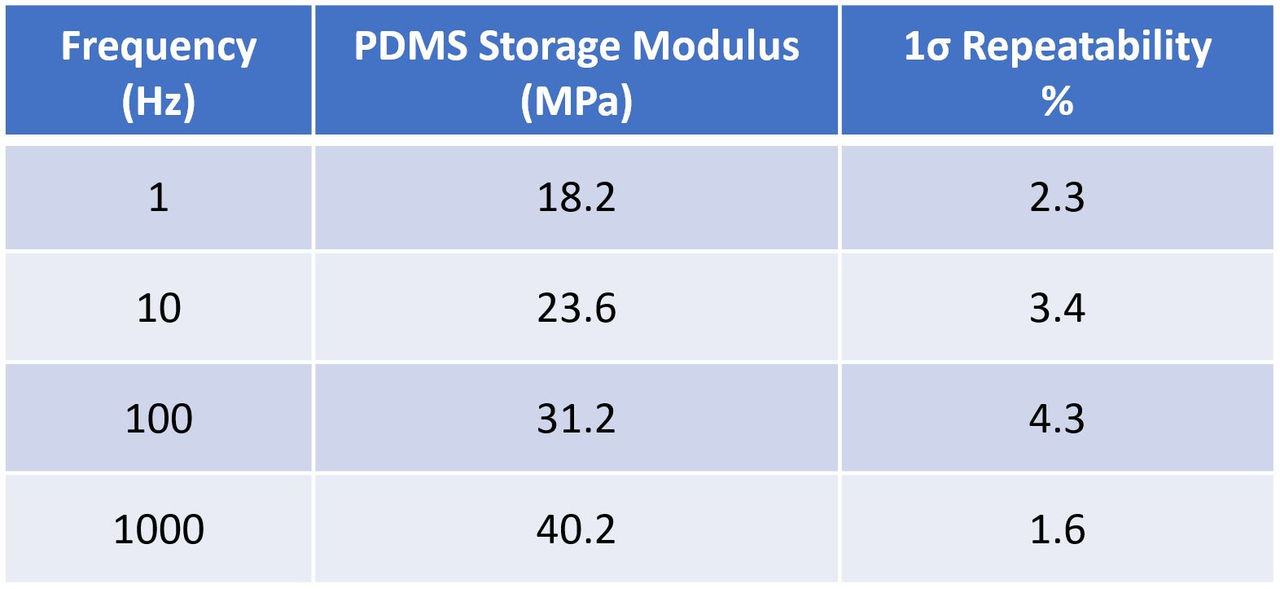
AFM-nDMA uses several Bruker proprietary technologies including dual channel demodulation, phase drift correction, and reference frequency normalization, to provide measurements of storage modulus, loss modulus, and loss tangent, in the rheological frequency range of 0.1Hz to 20kHz – directly matching the range of bulk DMA and indenter-based measurements.
With sub-nm amplitudes employed while in contact, AFM-nDMA works at small differential strain – in the linear regime. This contrasts with traditional AFM approaches that rip the probe out of the surface on every cycle, a nonlinear process that makes phase shift highly subject to variations in adhesion.
In addition, the AFM-nDMA measurement is embedded in a force distance curve employing Bruker’s proprietary low-force trigger technology, avoiding lateral forces, and enabling repeatable results and high spatial resolution.
Absolute Calibration with Quantified Load and Adhesion – No Need for a Reference Sample
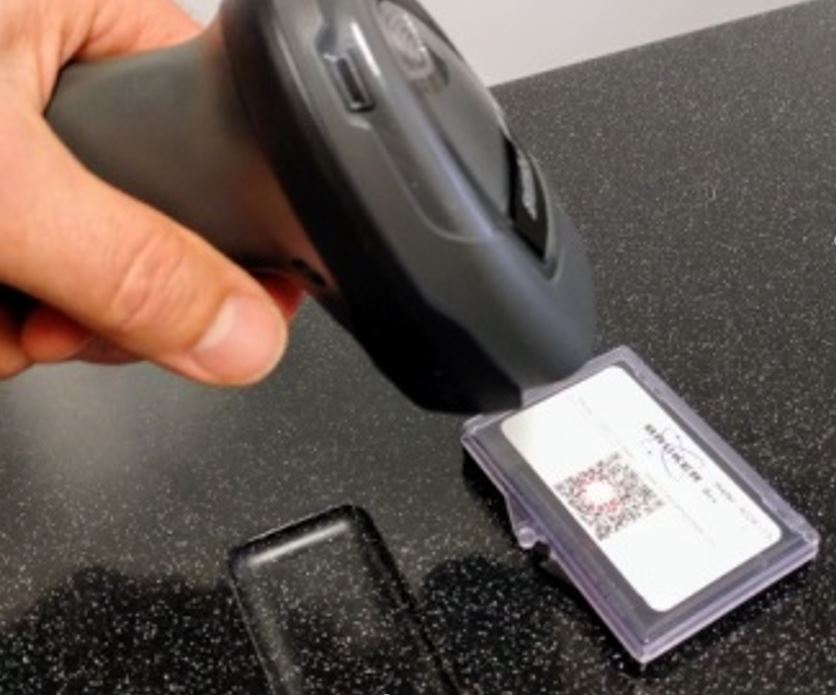
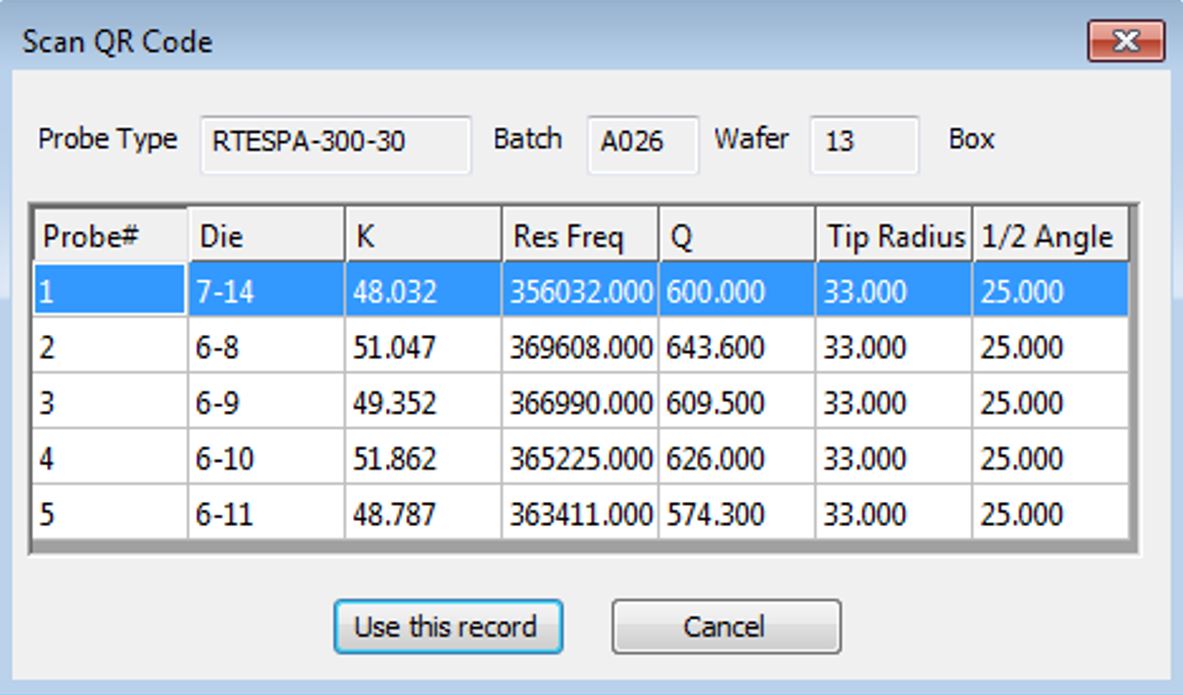
The use of precalibrated probes, their integration into the workflow, and an intrinsically accurate measurement enable a path to calibrated data that could not be simpler: Read the QR code, confirm the probe number, and measure. No reference sample is needed and none should be. All parameters are known and there is nothing to hide via “recalibration”. The force curve-embedded measurement takes place at known and controlled preload and even the effects of adhesion are automatically measured and accounted for in the analysis. Eliminating the need for a reference sample not only makes the process much faster and more convenient, it also avoids limitations and the danger of tip contamination.
Addressing the Smallest Nanoscale Domains with the Highest AFM Resolution on Polymers
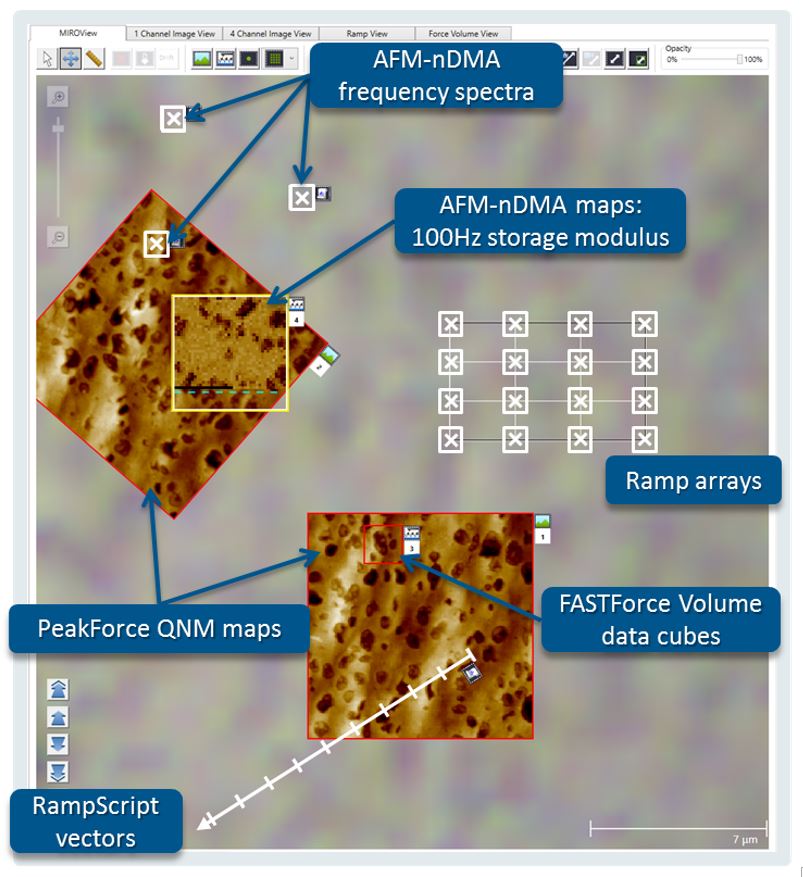
Along with PeakForce QNM-HA and FASTForce Volume, AFM-nDMA is integrated into MIROview for comprehensive characterization of the smallest nanoscale domains. As highlighted in hundreds of publications, PeakForce QNM provides the highest resolution on polymers. PeakForce QNM images have resolve submolecular structure in polymers, and even individual molecular defects in organic crystals, in air, in images of sample modulus, adhesion, and other properties.
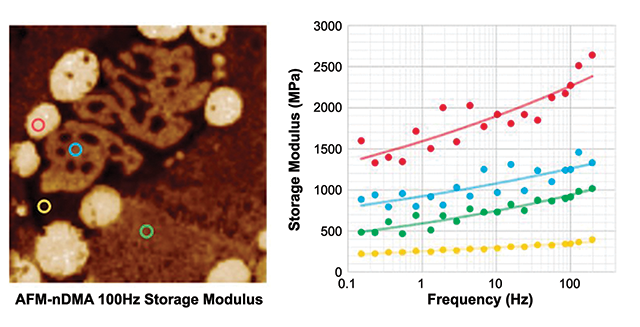
The addition of AFM-nDMA complements this information in two ways. First, by providing additional maps of storage modulus, loss modulus, loss tangent, along with 15 other nanomechanical data types, AFM-nDMA vastly expands the available the available property maps for identifying domains of interest. Second, AFM-nDMA allows for multi-frequency point measurements spanning the entire 0.1Hz to 20kHz frequency range, thereby providing comprehensive viscoelastic characterization of targeted nanoscale domains.
For the First Time, AFM-based Polymer Master Curves that Match Bulk Results
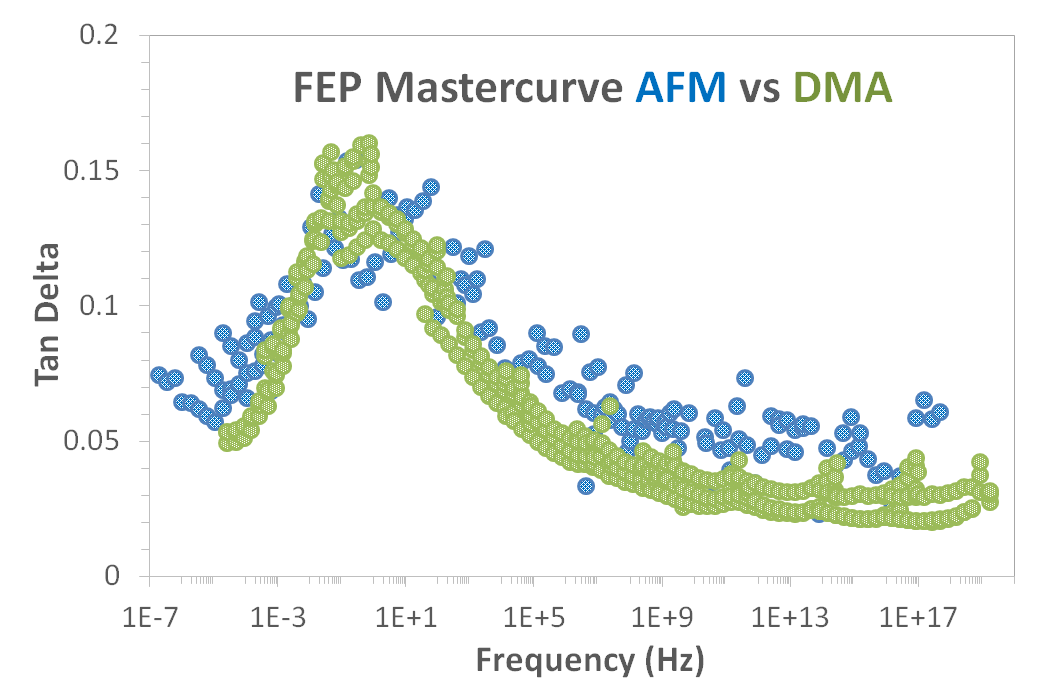
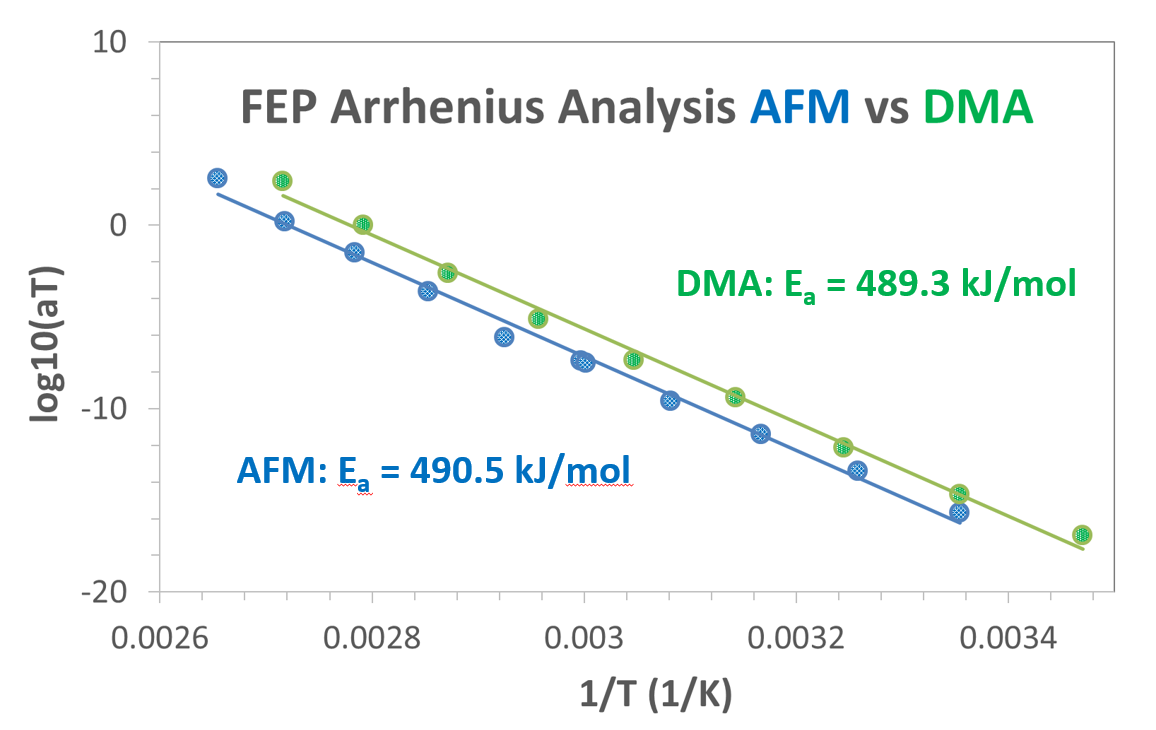
AFM-nDMA results match bulk DMA – not just at one frequency but over the entire rheological frequency and temperature range. The accuracy of the data allows for complete viscoelastic analysis of the nanoscale domain, including construction of a time-temperature superposition (or master curve), frequency dependence of transition temperatures, and analysis for activation energy.
AFM-nDMA is accurate. In the example shown here, a master curve was generated for fluorinated ethylene propylene (FEP), spanning 25 orders of magnitude in frequency. The resulting activation energy matches the result from the bulk measurement within 1%. And AFM-nDMA is a complete solution. The ability to create master curves, as well as WLF and Arrhenius analysis are included with its software. With AFM-nDMA, for the first time, AFM is equipped to truly quantify nanoscale viscoelasticity.
Discover Nanomechanical Effects that Conventional AFM Approaches Miss
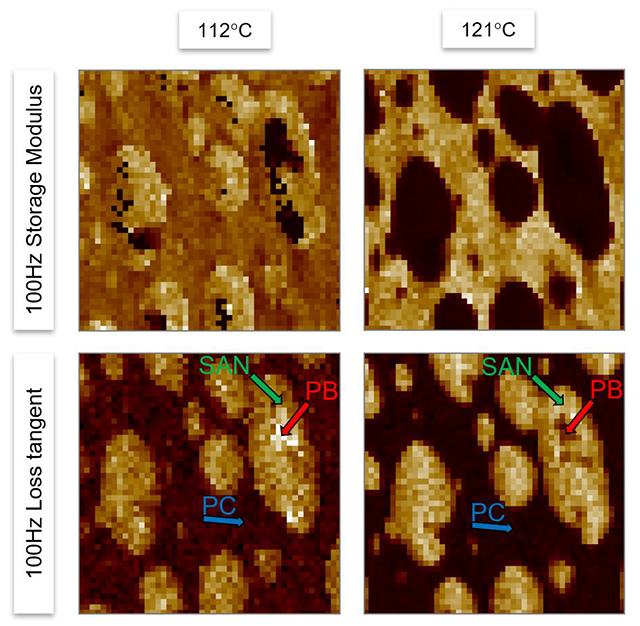
Heterogeneous samples show drastic viscoelastic effects as one component crosses Tg, affecting load transfer at the interface. AFM-nDMA not only reveals these effects, it allows for the first time to quantify them, answering the questions posed above: How do nanoscale phases differ from bulk? What are viscoelastic properties right near an interface or in an interphase? How does this affect load transfer, as a function of temperature?
AFM-nDMA is featured on the following Bruker AFMs:

Your download is now available.
Note: If you exit this page, you may not be able to reopen this download window without re-submitting the form.
