Phase Identification and Separation with Confidence: EDS-Assisted EBSD for Complex Carbide Coatings
In multiphase materials, different phases often share identical or very similar crystal structures that cannot be distinguished by EBSD alone. Combining EDS elemental mapping with EBSD crystallographic analysis adds compositional information to the structural data, so these phases can be identified and separated reliably.
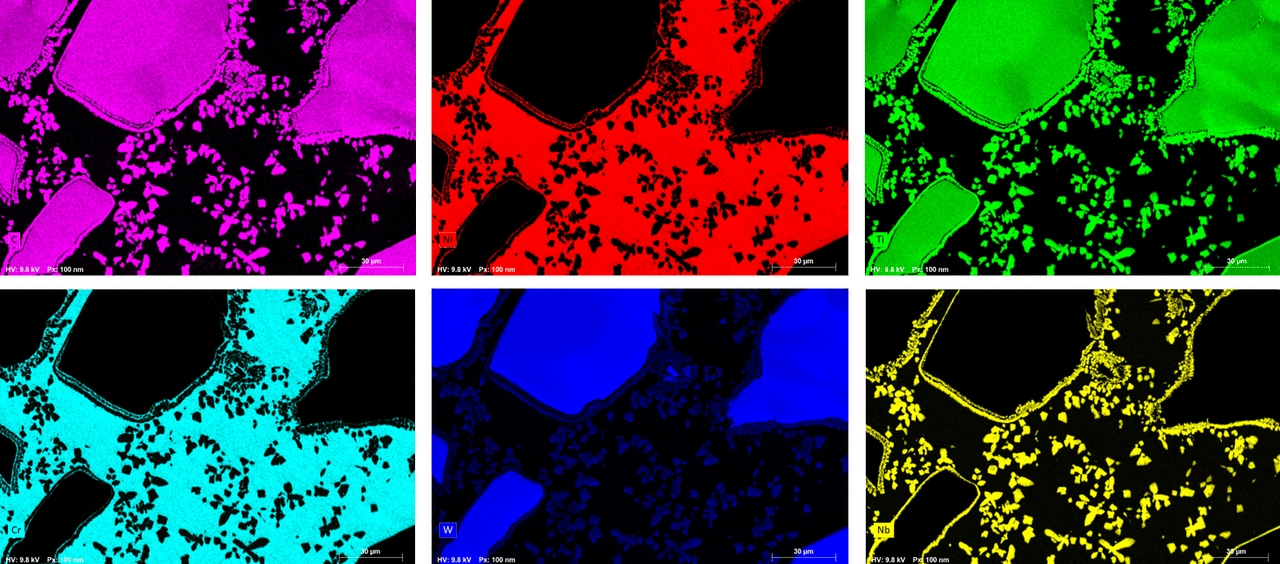
This is illustrated on a NiCr-based carbide coating, prepared by mechanical polishing. In a first step, ARGUS orientation contrast (Fig. 1) images are acquired to locate the individual phases, either from their atomic contrast or from the hardness differences visible in the orientation contrast image. Because of the surface topography and the fine carbide size, the atomic contrast image alone is not conclusive, so EDS is used to reveal three chemically distinct phases.
For this purpose, a simultaneous EDS and EBSD measurement is acquired, here using an eWARP EBSD detector and an XFlash® 760 EDS detector, with both signals stored in a single dataset.

Figure 1: ARGUS orientation contrast - different phases are expected based on the distribution of the atomic contast and different hardnesses. These phases are then identified using Advanced Phase ID within the commercially available databases (ICSD, COD, American Mineralogist, Bruker database).
Note that creating a user database is also possible.
The resulting elemental distribution is shown in Fig. 2 (see additional figures). Using the AUTOPHASE function in ESPRIT three phases NiCr, TiWC, and TiNbWC, are easily identified and separated (Fig. 3).

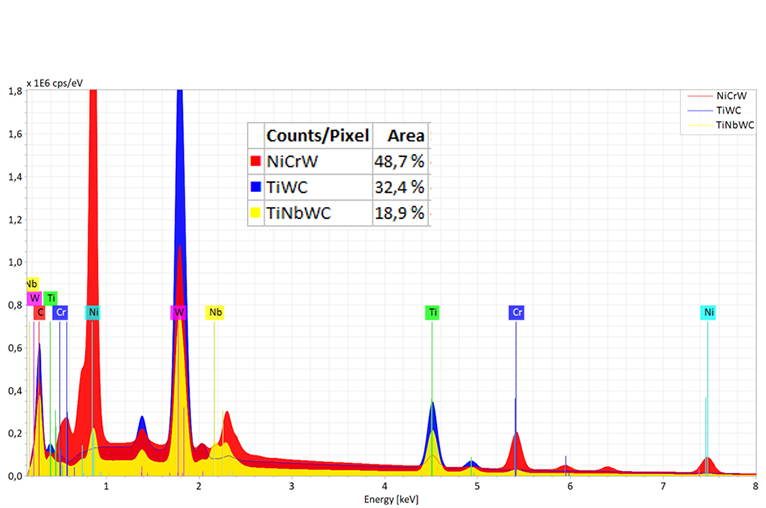
In a second step, the corresponding crystallographic phases are identified with Advanced Phase ID in the ESPRIT software, by selecting an EBSD pattern and its corresponding EDS spectrum, for each phase. The EBSD phase details are presented in Fig. 4.
The TiNbWC carbide phase is not contained in the commercial database, so niobium was added to the phase definition directly by the user in ESPRIT.
Because all three phases share the same FCC space group, while corresponding lattice positions are occupied by different atomic species, EBSD mapping alone leads to misindexing between the phases (Fig. 5).
These FCC phases do show subtle differences in Kikuchi band intensities and widths, but separating them with Hough-based indexing and kinematic simulation is practically impossible. They can in principle be distinguished by dynamical simulation of the bands and their internal intensity features, or by pattern matching, yet both routes are time consuming and demand considerable expertise in the parameters involved. Combining EBSD with the elemental distribution is a much faster and simpler alternative.
In this approach, the phase distribution is determined by reanalysing the dataset with EDS and EBSD information together. At every measurement point, the software first quantifies the EDS spectrum to determine the local composition, then uses that composition to select the most likely candidate phases from the EBSD phase list. The Kikuchi bands are indexed against these candidates only, which markedly improves phase discrimination and indexing reliability. The analysis can run live during acquisition or offline afterwards, at rates above 1200 pps.

Figure 5: EBSD phase map of a NiCr-based carbide coating sample without EDS-assistance. Phase misindexing is clearly visible.
More information available in additional figures section.
The resulting EDS-assisted EBSD phase map (Fig. 6) shows the three phases correctly separated and identified. Epitaxial growth describes the ordered growth of one crystalline phase on a crystalline substrate, where the new phase adopts the orientation of the underlying crystal instead of nucleating randomly. It is favoured when both lattices have the same or a closely related structure and similar lattice parameters, since the resulting low interfacial energy makes oriented nucleation energetically preferable.
Here, because TiWC and TiWNbC share the same crystal structure (typically the NaCl-type FCC carbide, space group Fm-3m), TiWNbC can nucleate and grow epitaxially on TiWC, as inferred from the orientation distribution map in figure 7. The two carbides are then aligned not only in structure but also in orientation, which is a further reason why EBSD alone cannot separate them and why the complementary elemental information is essential.
This combined approach improves the reliability of the phase analysis and of the microstructural characterization as a whole. It also makes quantitative results accessible: phase fractions and distributions, grain structure, and even the texture of each phase individually (Fig. 7).

Figure 6: The three phases, which share the same crystal structure, are distinguished by EBSD with EDS support based on their differing chemical compositions.
More information available in additional figures section.

Figure 7: Microstructure analysis of both carbide phases, TiWC and TiWNbC.
Pole figures available in additional figures section.
Additional Figures:



Learn More About eWARP
Discover how the eWARP detector redefines EBSD performance under challenging, real-world conditions, combining unmatched acquisition speed with high-fidelity signal quality.