
Microplastics Analysis Using FT-IR, IR Laser and Raman Spectroscopy
Reliable Microplastics Identification for Research and Routine Testing
Microplastics are found in water, soil, sediments, food, consumer products and industrial environments. As regulatory requirements and research activities continue to expand, laboratories need analytical methods capable of delivering accurate polymer identification, particle counts and size distributions.
Bruker supports microplastics researchers and testing laboratories worldwide with a complete portfolio of spectroscopic solutions. Whether your focus is high-throughput screening, sub-micron particle analysis or standards-compliant reporting, we help you find the approach that best fits your analytical requirements.
Our solutions enable reliable analysis of:
- Polymer identification
- Particle counts
- Particle size distributions
- Shape, fiber and fragment classification
- Weathered and degraded polymers
- Mixed-material samples
- Regulatory reporting requirements
Analyze and detect microplastics in:
- Drinking, waste, and surface water
- Marine and ocean samples
- Sediments and soil
- Food and beverages
- Consumer products
- Industrial process streams
- Airborne particle monitoring
IR Laser Imaging:
High-Throughput Particle Analysis

FT-IR Microscopy & Imaging:
Detailed Particle Analysis

Raman Microscopy & Imaging:
Nanoscale Particle Analysis

High-Throughput Particle Analysis: IR Laser Imaging
How Microplastics are Analyzed by ILIM

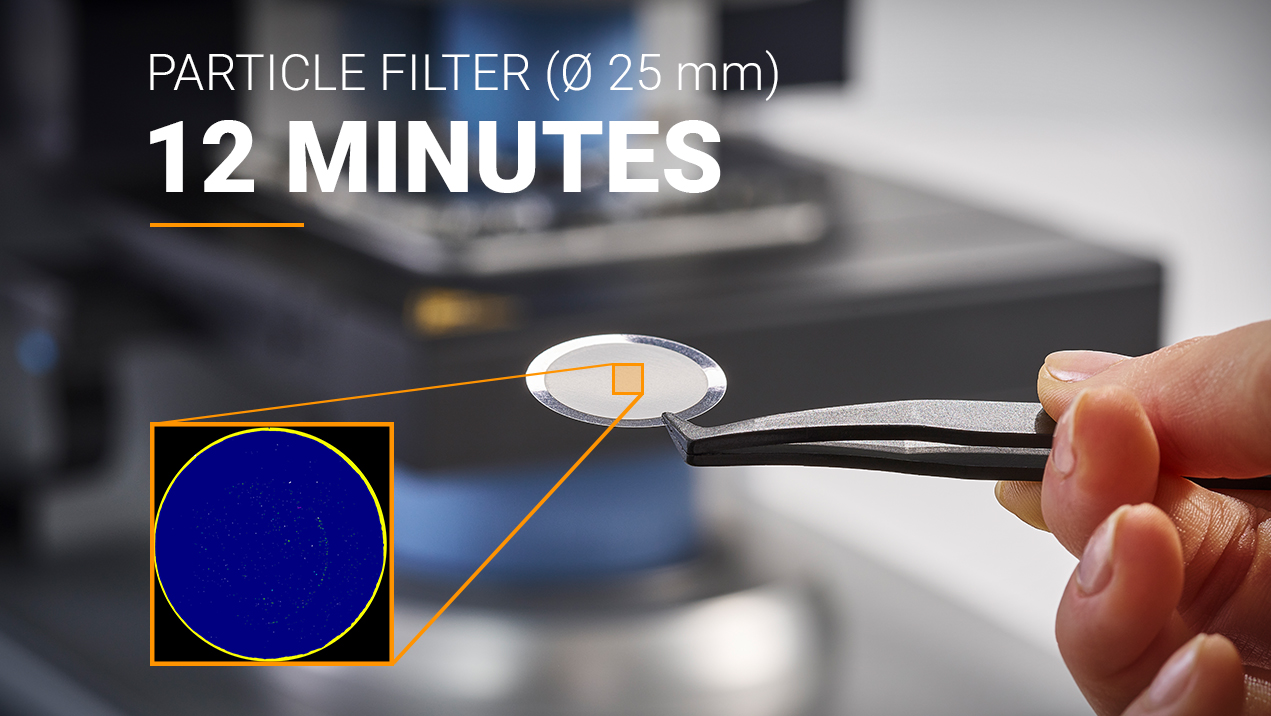
IR Laser Imaging Analyzes Full Filters in under 30 Minutes.
Routine, full‑filter microplastics workflow, capturing complete 25 mm filters with a total turnaround time below 30 minutes. As an imaging approach, measurement time does not depend on particle count. You get a predictable throughput whether the filter is lightly or heavily loaded.

How Many Particles? Which Polymers? What Sizes and Shapes?
Built to report which polymers are present, how many particles, and their size/shape distribution. Imaging-based infrared microscopy assigns a chemical identity to each detected particle and converts full‑filter spectral data into a particle list with polymer class, dimensions, and morphology.

An Easy End-to-End Solution with excellent Reporting
Start it, walk away, and receive a particle list with polymer ID, size/shape metrics, confidence measures, plus summary statistics and maps. Automated acquisition and integrated AI‑driven evaluation convert large spectral datasets into report‑ready outputs.
The Benefits of ILIM
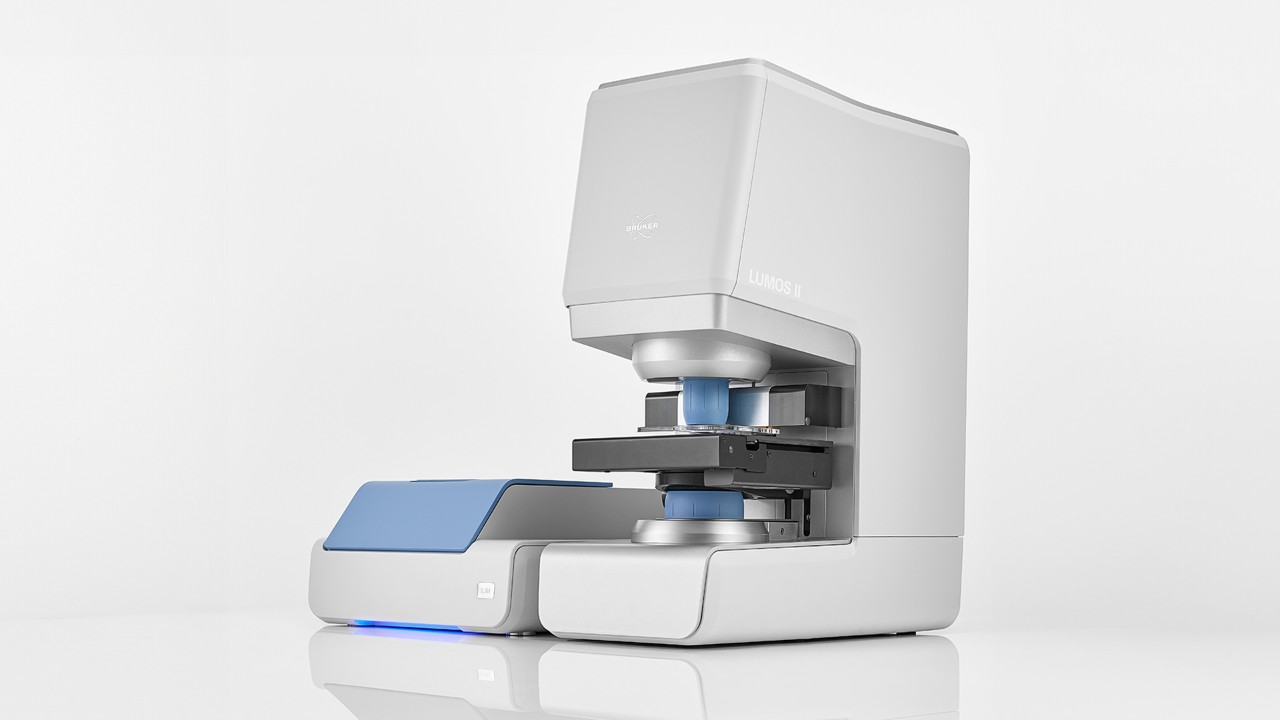
- The fastest full-filter IR imaging. ILIM enables high-throughput microplastic analysis by delivering complete analysis of 25 mm filter samples in less than 30 minutes, independent of total particle load. This includes both spectral acquisition and automated data evaluation. This speed is made possible by a tunable IR laser source and the largest field of view currently available for IR microscopy (2.2 x 2.0 mm2).
- Reduced selection bias. Particles are detected, identified, and characterized based on their unique chemical signature. That means transparent, dark, or visually ambiguous particles are still captured, supporting statistically representative particle counts, size classes, and polymer composition.
- Start the experiment and walk away. ILIM is designed for fully automated operation, with guided software workflows (ParticlePlus™) and automated system validation. This supports consistent, reproducible results across operators, samples, and projects, making ILIM well suited to large-scale routine microplastics analysis.
The LUMOS II IR Laser Imaging Microscope
Detailed Particle Analysis: FT-IR Microscopy and Imaging
How Microplastics are Analyzed by FT-IR

FT-IR gives you the analytical depth when you need it.
FT-IR imaging delivers detailed, reliable results, making it a trusted approach for high-quality particle identification and characterization. FT-IR provides rich spectral information for confident polymer identification and detailed particle characterization.

How Many Particles? Which Polymers? What Sizes and Shapes?
Built to report which polymers are present, how many particles, and their size/shape distribution. Imaging-based infrared microscopy assigns a chemical identity to each detected particle and converts full‑filter spectral data into a particle list with polymer class, dimensions, and morphology.

Simplifying data evaluation and presentation.
Start measurements with ease and obtain particle lists including polymer ID, size and shape metrics, confidence values, as well as summary statistics and maps. Automated acquisition and integrated AI‑driven evaluation convert large spectral datasets into report‑ready outputs.
The Benefits of FT-IR
- Reduces selection bias and supports reliable, auditable data. Hyperspectral imaging eliminates the need for an optical detection step and enables full-filter analysis according to ISO 16094-2. This approach reliably captures transparent particles, overlapping particles, and fibrous materials, ensuring complete and comprehensive characterization.
- Excels under challenging conditions. Maintains reliable performance even in the presence of moderate sample matrix contributions or minor contaminants resulting from imperfect sample preparation. With coverage of the full MIR spectral range, it provides strong analytical depth for confident polymer discrimination.
- Offers flexible sampling capabilities. It can handle tasks ranging from standard analysis to advanced studies of individual particles at the highest spatial resolution with its automated µ-ATR crystal. Access to various FT-IR libraries allows confident identification of unknown materials and unexpected contaminants.
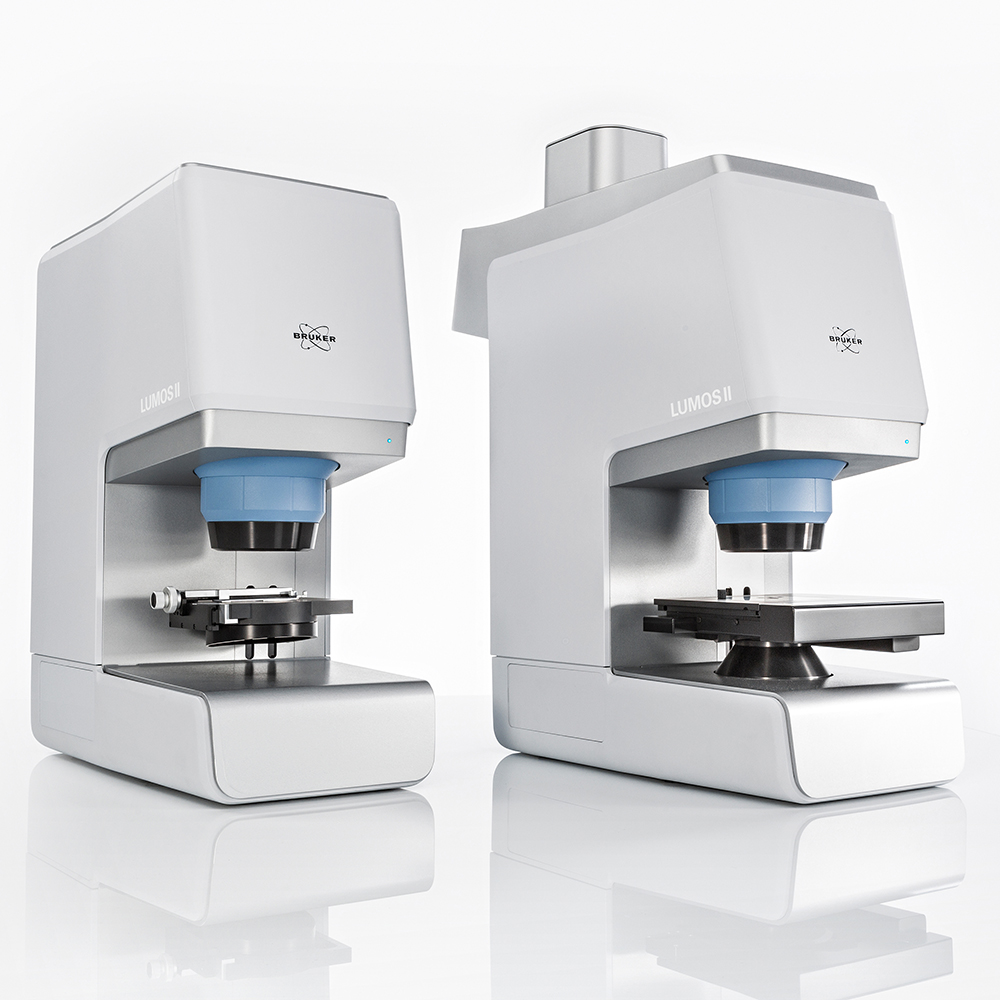
The LUMOS II FT-IR Microscope
High-Resolution Particle Analysis: Raman Microscopy and Imaging
How Microplastics are Analyzed by Raman

Advanced scanning
Apply advanced scanning technologies to particle analysis. Sometimes a single point per particle is not enough. Whether you want an average particle spectrum to tackle heterogeneities or high-resolution imaging to resolve agglomerates, our microscopes offer an automated approach thanks to patented technology.

Integrated evaluation
Integrated tools streamline particle analysis from measurement and identification through statistical breakdown and reporting. Our software distills raw data into presentation-ready results.
The Benefits of Raman
- The smallest particles are of greatest concern. Particle analysis in the few- to sub-micron size fraction is challenging, as the diffraction limit narrows the choice of analytical methods. Raman can go where IR cannot follow: expand your microplastics research into the nano domain.
- Fillers, additives, and inorganics pose an analytical challenge. Raman microscopy provides complementary information to characterize these components.
- Raman imaging enables powerful, innovative sampling concepts. Random scanning helps you find particles even in strong matrix environments. Raman line imaging can generate chemical images of extended areas and resolve agglomerates. Smart averaging automatically scans each particle and creates an average spectrum to cope with inhomogeneities.
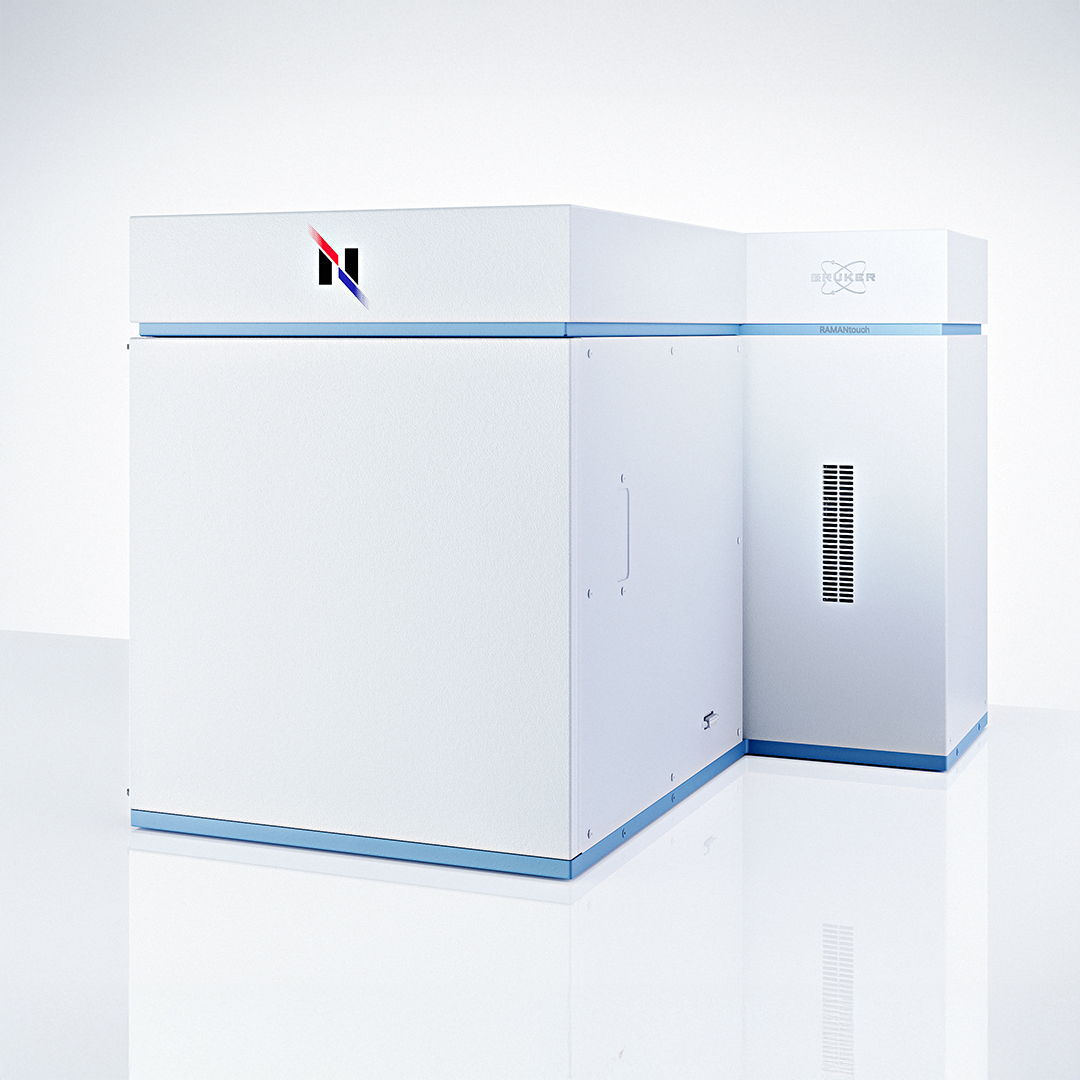
The Nanophoton RAMANtouch Raman Microscope
Application Examples: ILIM vs. FT-IR vs. Raman

Microplastics in Drinking Water Samples by IR Laser Imaging
Analysis of a 20 L drinking water sample on an Anodisc filter. Quick turnaround times of 30 minutes or less are demonstrated.

Microplastics in Wastewater by IR Laser Imaging
Demonstrates rapid, automated characterization of microplastics in wastewater samples using IR Laser Imaging and AI-driven particle analysis.

Microplastics in Marine Water Samples by FT-IR Imaging
Shows how FT-IR imaging enables automated detection, identification, and quantification of microplastics in seawater samples.

Microplastics in Animal Tissue by FT-IR Imaging
Highlights the use of FT-IR imaging to identify and characterize microplastics extracted from mussel tissue for environmental monitoring studies.

Microplastics in Chicken Liver Tissue by Raman Microscopy
Demonstrates the direct detection and chemical identification of polyethylene microplastics in liver tissue using high-resolution Raman microscopy.

Micro- and Nanoplastics Analysis by Raman Microscopy
Comparison of particle-by-particle Raman analysis and Raman imaging for reliable identification and characterization of micro- and nanoplastics.
Frequently Asked Questions About Microplastics Analysis
This FAQ gives you direct answers to the questions that matter most: which technique fits your application, what regulations require, and where the trade-offs lie. And if you need more depth the full guide is one click away.
The Basics
Microplastics analysis is the scientific process of detecting, identifying, counting, and characterizing plastic particles smaller than 5 mm in our environment, food, water, or in biological samples. A complete analysis determines not just whether microplastics are present, but how many, what size, what shape, and especially, what polymer type they are.
Visual inspection alone cannot distinguish a synthetic polymer particle from a natural one like cellulose or a mineral fragment. However, this information is very important for identifying, for example, the sources and origin of the particles. Chemical identification, for example using spectroscopy, is essential for confirming polymer identity and distinguishing plastic particles from visually similar natural or mineral particles
Microplastics have been detected in ocean water, deep-sea sediments, Arctic ice, agricultural soil, indoor air, tap water, bottled water, human lung tissue, blood, and placental tissue. Microplastics have been reported in marine and freshwater environments, soils, air, food and drinking water, as well as in biological samples.
Nanoplastics are commonly described as plastic particles below 1 µm. Their small size makes characterization particularly challenging. Raman microscopy offers higher spatial resolution than conventional IR microscopy and is therefore particularly useful for analyzing very small plastic particles.
Methods and Approaches
The two main approaches are mass-driven analysis and particle-driven analysis. Mass-driven methods such as pyrolysis-GC/MS quantify polymer concentration by mass but destroy the sample, so they cannot provide particle counts, sizes or morphology. Particle-driven methods, such as IR or Raman microscopy, identify and characterize individual particles while preserving particle-level information.
For drinking-water microplastics analysis, Commission Delegated Decision (EU) 2024/1441 recognizes vibrational spectroscopy methods including μ-FTIR, μ-Raman and equivalent approaches such as QCL-IR. This means laboratories can select the technique that best matches their requirements for particle size, throughput and analytical detail.
The three techniques are FT-IR microscopy, IR Laser Microscopy, and Raman microscopy. All three methods combine a microscopic approach with a spectroscopic technique to measure a molecular vibration spectrum of a particle. Each offers different trade-offs in spatial resolution, throughput, spectral range, and sample compatibility.
Subsampling means analyzing only a representative fraction of a sample or filter instead of the complete filter. It is often used to reduce measurement time in particle-based spectroscopic workflows, especially when particle loads are high. However, because particles may be distributed unevenly across a filter, subsampling can introduce additional uncertainty through spatial bias, handling losses, overcrowding, or measuring too few particles.
Subsampling can reduce measurement time, but the measured fraction may not fully represent the complete filter. Uneven particle distribution, clustering, edge effects and handling losses can affect reported particle counts, polymer composition and size distributions. Bruker’s full-filter IR imaging workflows avoid this additional sampling step. With ILIM, complete 25 mm filters can be analyzed in less than 30 minutes, including spectral acquisition and automated data evaluation, enabling high-throughput analysis without relying on subsampling.
Comparing Technologies
FT-IR microscopy combines infrared spectroscopy with microscopy to identify and characterize individual microplastic particles. It is an established choice for routine microplastics analysis, offering reliable polymer identification, particle sizing and automated filter analysis. μ-FTIR is explicitly recognized for drinking-water microplastics analysis in EU Commission Delegated Decision (EU) 2024/1441.
IR Laser Imaging Microscopy (ILIM) uses a tunable quantum cascade laser (QCL) for rapid hyperspectral IR imaging. Its key advantage is exceptionally fast chemical mapping of large filter areas, making it particularly attractive for high-throughput microplastics screening. QCL-IR is explicitly referenced in EU Commission Delegated Decision (EU) 2024/1441 as an equivalent vibrational spectroscopy approach.
Raman microscopy combines Raman spectroscopy with optical microscopy to identify and characterize particles based on their molecular composition. In microplastics analysis, it is particularly useful for very small particles because of its high spatial resolution, reaching around 1 µm and, under optimized conditions, into the submicron range. Raman can also provide valuable information on pigments, fillers and inorganic components, making it a strong choice when small-particle analysis or detailed compositional information is required. μ-Raman is explicitly recognized for drinking-water microplastics analysis under EU Commission Delegated Decision (EU) 2024/1441.
Sample Preparation and Filters
Sample preparation is the greatest source of variability between laboratories. Inadequate removal of organic and inorganic matrix material leads to false identifications and unreliable results. Contaminants can be tolerated to a certain extent and detected as such by the software. However, if the microplastic particles are obscured or masked by these contaminants, even the software cannot compensate for what arrives on the filter.
Filter choice depends on the measurement technique. Anodisc (aluminum oxide) filters are widely used for IR transmission. Silicon membrane filters provide broad mid-IR spectral access and are also compatible with Raman. Gold-coated polycarbonate filters are well suited to Raman and IR transflection measurements. PTFE, metal mesh, and nitrocellulose filters have significant limitations for imaging workflows but could be used for single point measurements with ATR.
Silicon membrane filters are compatible with both IR transmission and Raman measurements. Gold-coated polycarbonate filters work for Raman and IR transreflectance measurements. Anodisc filters fluoresce under laser excitation, show a rough surface at high magnifications, and are therefore not suitable for Raman.
Data Evaluation and Software
For imaging approaches, automated software like Bruker's MPID converts millions of raw spectra into a particle list with identity, size, shape, and count for every detected particle. Manual evaluation is not feasible at scale. can improve classification robustness compared with conventional library matching, particularly for weathered or contaminated samples.
Environmental particles are degraded by UV exposure, chemical weathering, and contamination. These changes shift spectra away from clean reference standards in ways that simple template matching cannot reliably accommodate. A neural network trained on real-world degraded spectra maintains accuracy where library matching fails.
A confidence score measures how closely the spectral feature vector of an identified particle correlates to a verified reference spectrum for that polymer class. It allows analysts to set a threshold, accepting only high-confidence identifications, to control the trade-off between sensitivity (detecting more particles) and specificity (avoiding misclassification).
Regulations and Standards
The key regulatory and standardization documents are EU Directive 2020/2184, which establishes the EU drinking-water framework; Commission Delegated Decision (EU) 2024/1441, which specifies vibrational spectroscopy methods including μ-FTIR, μ-Raman and equivalent approaches such as QCL-IR; ISO 24187:2023, which establishes general principles for microplastics analysis across environmental matrices; and ISO 16094-2:2025, which covers vibrational spectroscopy methods for drinking water and waters with low suspended-solids content. ASTM WK87463 is currently under development as a test method for identifying and quantifying microplastics in water using IR spectroscopy.
EU Commission Delegated Decision (EU) 2024/1441 does not require one specific vibrational spectroscopy technique. It permits methods such as μ-FTIR, μ-Raman, and equivalent techniques such as QCL-IR (IR Laser Imaging) for the compositional analysis of microplastic particles and fibres. The most suitable technique therefore depends on factors such as particle size, sample type, throughput, and analytical requirements.
ISO 24187:2023 establishes general principles and minimum requirements for microplastics analysis across environmental matrices. ISO 16094-2:2025 provides more specific requirements for particle-based microplastics analysis using vibrational spectroscopy in drinking water and waters with low suspended-solids content. Laboratories working with these water samples should therefore consider both standards.
Get in touch with our experts for Microplastic Analysis
Directly talk to our application experts to support your work.