Vision64 Software
Bruker’s Vision64® software has become well known for its powerful all-in-one data collection, analysis, and visualization. It incorporates many breakthroughs in functionality and usability of stylus and optical profilometers, which significantly improve ease-of-use, time to results, analysis accuracy, sample versatility, and more.

Improving Stylus and Optical Profiler Functionality and Usability
Data Collection
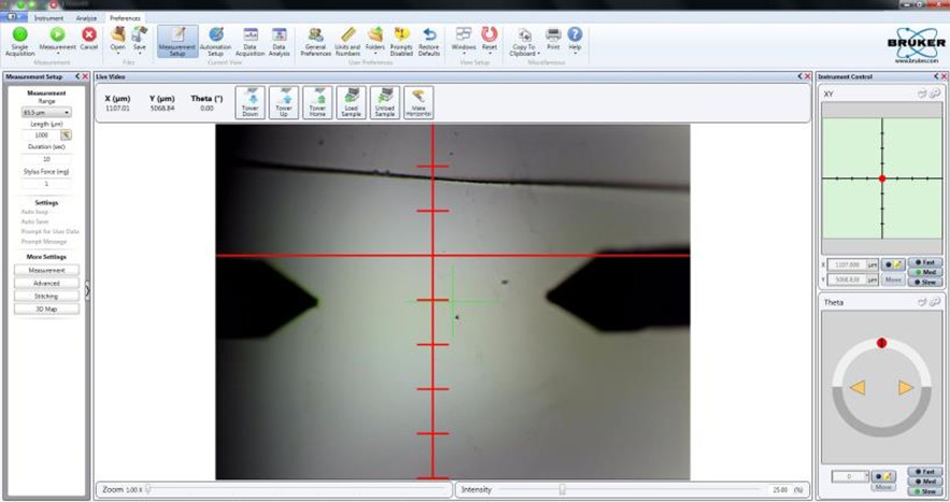
The measurement tab in Vision64 features an intuitive visual workflow and user-defined automation capabilities.
Dataset Analysis
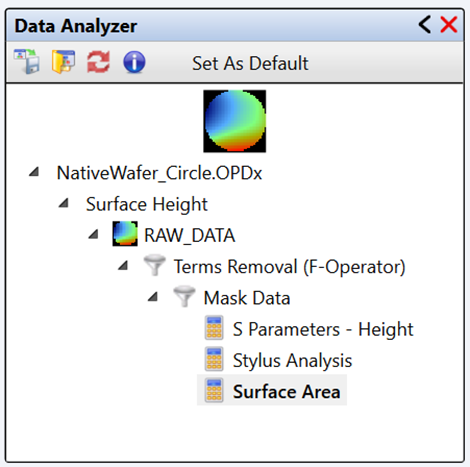
The data analysis tab includes an Analysis Toolbox with preconfigured, editable analysis and filtering operations. Each operation can be added to the Data Analyzer tree, where they are applied, in order, to the dataset.
Results Visualization
Visualization options include 2D contour plots, 3D contour plots, and user-defined height traces. Other attributes of Vision64 and similar packages, such as Vision64 Map, include streamlined data collection, enhanced toolsets for creating stunning 3D visuals, and direct compatibility with the latest metrology standards (e.g., ISO, ASME, DIN, JIS, etc.).

Frequently Asked Questions About Vision64 Software
The standard Vision64 included with Bruker white light interferometers and stylus profilers is an all-in-one data collection, analysis, and visualization software. It features:
- Off-line analysis
- Recipe portability with import/export
- Production mode
- Stitching workflows
- Batch analysis
- Automation
- Control and analysis of PSI, VSI, and USI modes
Vision64 Map is an optional add-on for Vision64 that enables more comprehensive 3D surface visualization and analysis. Vision64 Map is available with a number of optional modules that make it even easier to customize your analyses and reports to your specific applications. Modules include, but are not limited to:
- Advanced 2D Surface Texture
- Advanced 3D Surface Texture
- Advanced Contour
- 2D Automotive
- Statistics (2D/3D)
- 3D Fourier and Wavelets
Based on Digital Surf’s industry-leading Mountains® Technology, the Vision64 Map software provides a variety of palettes, user-definable views, and lighting to enable more flexible representation of sample surface texture and topography. The software also expands reporting capabilities with automated data reporting in 11 languages and analysis modules that enhance or enable:
- Data segmentation
- 2D/3D advanced filtering options
- Standards-compliant analyses
- Statistical analysis
- MATLAB compatibility
- Plotting options
- Overlay analysis
- Sub-surface extraction
- …and more
If you have a complex workflow, analysis, or visualization problem, contact us about Vision64 Map modules that can meet your needs!