Microplastics Analysis
What Are Microplastics?
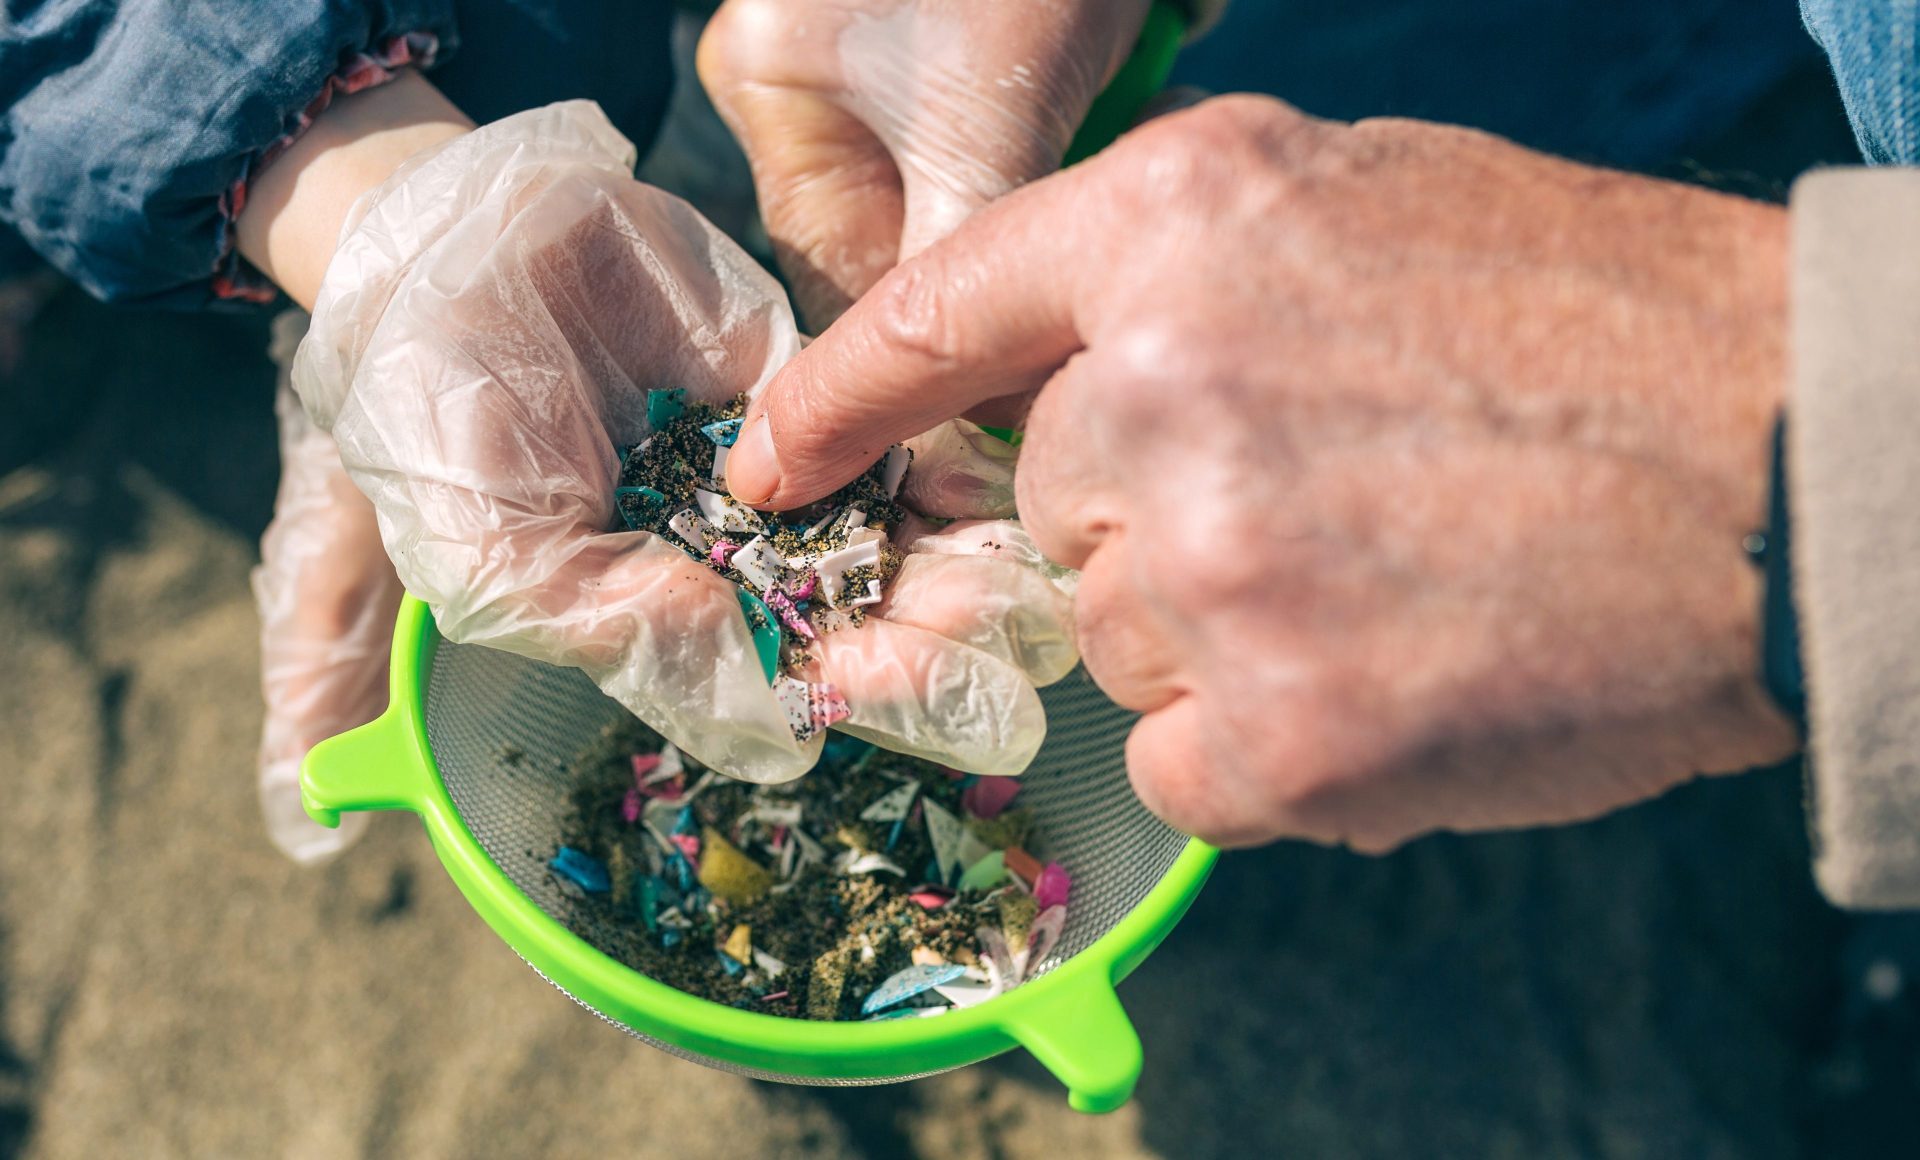
According to definition, polymer particles with a diameter of less than 5 mm are referred to as microplastic (MP) particles. Depending on their origin, they are further subdivided into primary and secondary particles. They are found in riverbeds, the arctic ice, natural fertilizers, soils and even drinking water show noticeable amounts of MPPs. During the last decades, microplastics have even found their way into the human food chain. In short, the ubiquity of microplastic particles makes them an enormous challenge to our environment.
Where Do Microplastics Come From? How Do Microplastics Affect Us?
Microplastic particles can be categorized into primary and secondary particles. Primary MP particles (MPPs) are those which have been specifically produced for industrial use, for instance as peeling particles in cosmetic products.
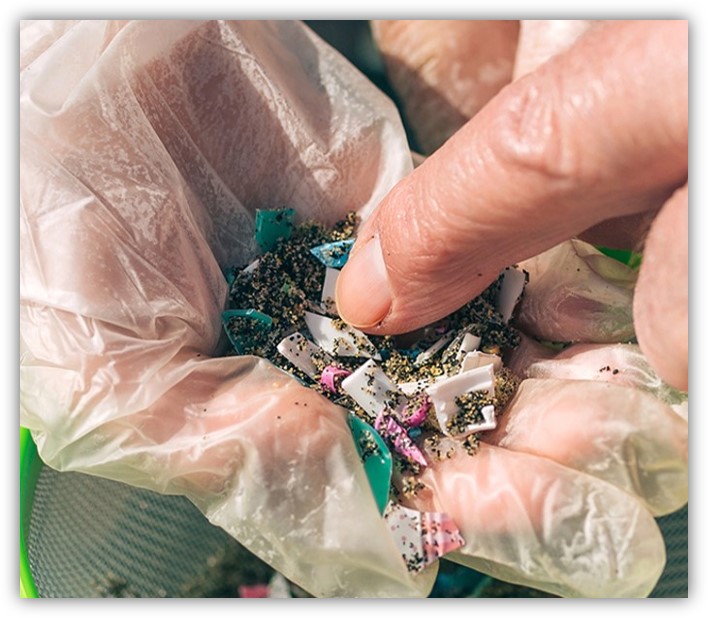
Secondary MPPs are formed by physical, biological and chemical degradation of macroscopic plastic parts and are the main source of micro particles released into the environment. They are mainly formed by the degradation of improperly disposed plastic waste, tire abrasion and washing of synthetic textiles.
While the threat to marine life is mostly understood, its full extent cannot be assessed at present. However, uptake by marine organisms and fish leads to contamination of the human food chain by microplastics. As MPPs may contain problematic plasticizers and can also adsorb other organic pollutants, the long-term effects are fairly unpredictable.
How Are Microplastics Analyzed and Detected?
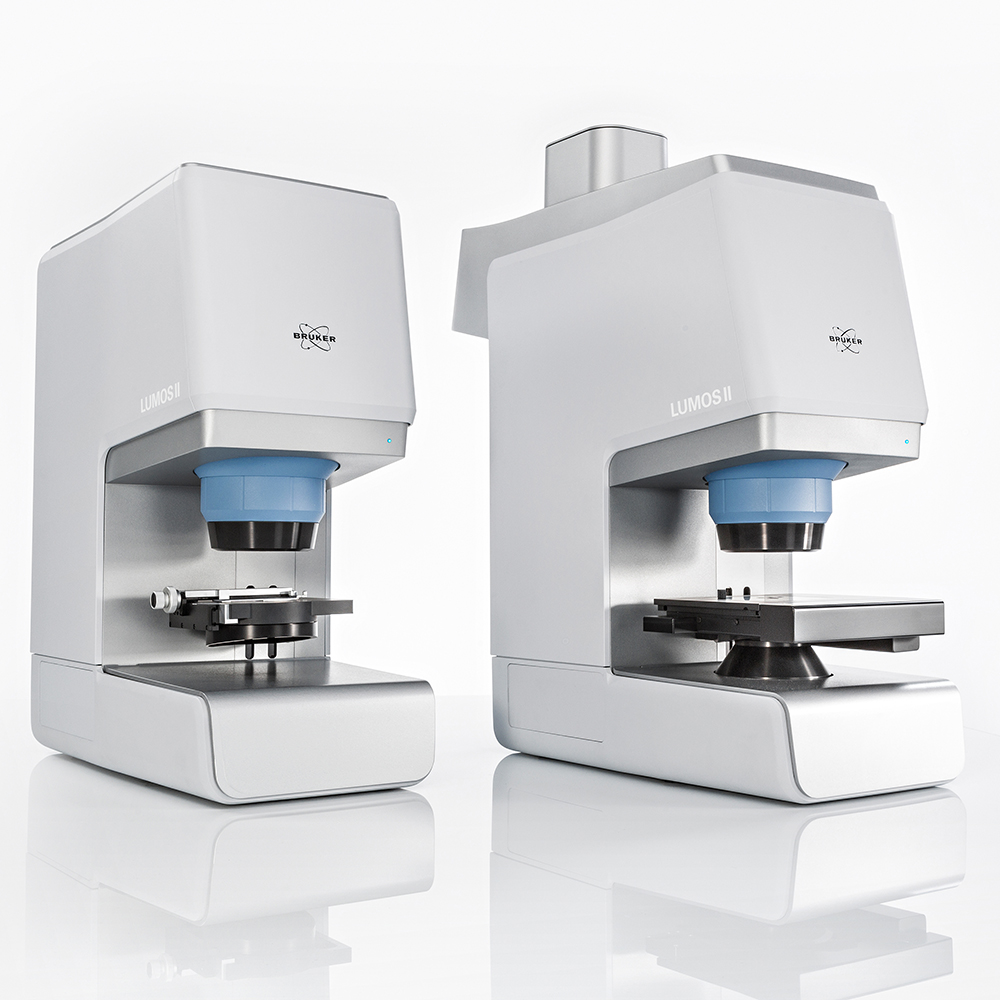
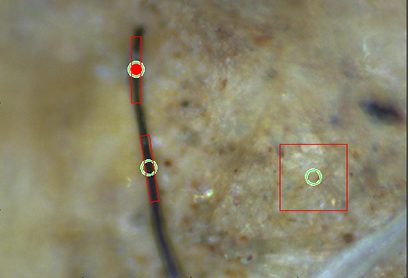
While light microscopy is a fundamental method to detect microplastics, the approach does not provide the chemical information necessary to identify the polymers involved. This identification however is vital to investigate the influence and origin of the found microplastics. For this very reason, microplastic experts are turning to µ-FT-IR imaging in combination with machine learning evluation tools. As a result, complete characterization of particles is possible, human error is eliminated, and reliable, reproducible results are obtained. FT-IR is mentioned in both, the new ISO 24187 and ISO 4484-2.
What is the Best Way to Analyze Microplastics?
The typical workflow of microplastics analysis:
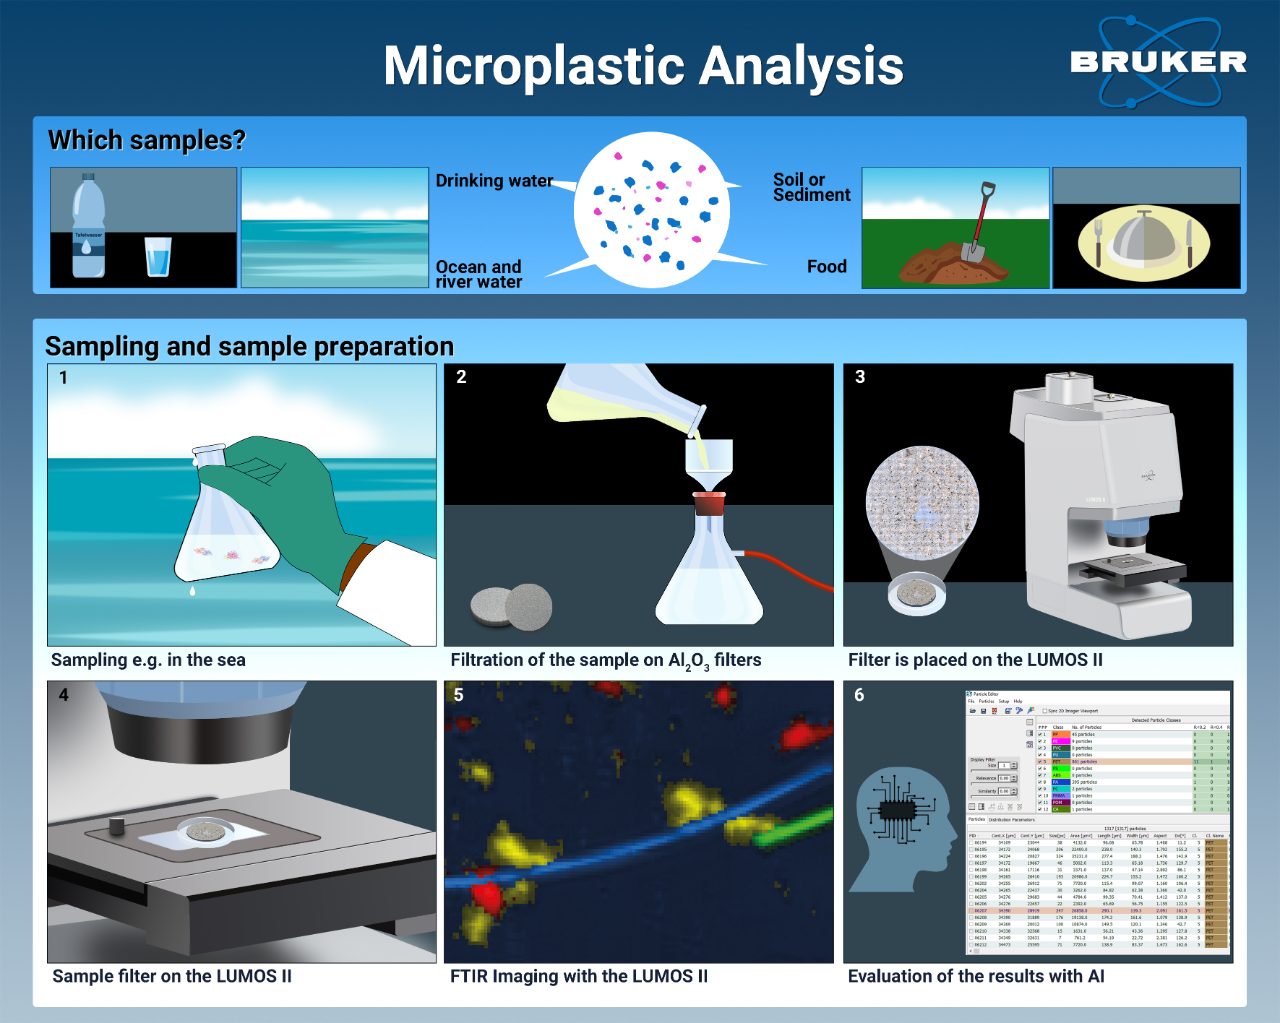
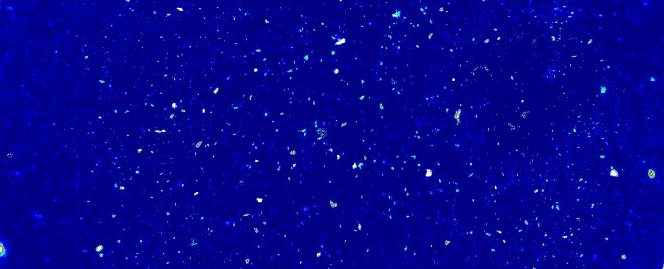
The chemical analysis usually starts with a liquid sample that was prepared differently depending on its origin. This sample is filtered onto an IR-transparent substrate and measured in its entirety by FT-IR imaging to capture all particles present on the filter. The Chemical Image is then analyzed automatically with a robust machine learning algorithm.
FT-IR microscopy is the most common approach found in microplastic research. The workflow is super simple and the results provide high precision and, most of all, reliability. Especially FT-IR imaging by focal-plane array detectors is the state-of-the-art solution. If you want to know more about our FT-IR instrument setup, take a look at our FT-IR microscopes.
Why FT-IR imaging for microplastics analysis?
The Strengths of FT-IR Imaging
Infrared (IR) radiation interacts with the microplastic particles, creating characteristic IR absorption patterns. These patterns are then used to identify the particles. If you want to catch up on the basics of FT-IR, click here.
By far the biggest benefit of FT-IR is its exceptional reliability and easy application. Any kind of plastic particle (dark coloured, filled, fluorescent, ...) can be analyzed requiring minimal user effort.
True imaging detectors unlock the potential of FT-IR
But - when you combine FT-IR with a Focal-plane array (FPA) detector things get really interesting. The result is a very powerful imaging tool capable simplifying microplastics analysis to routine levels. To learn about FT-IR imaging, click here.
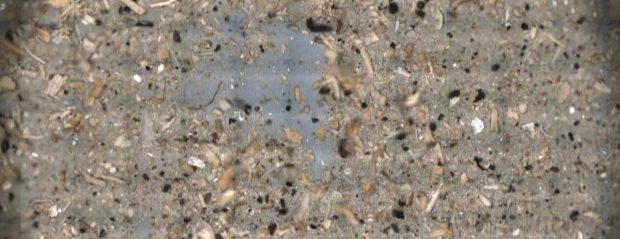
It comes down to a fully automated approach that can tolerate a lot of contamination on the filter (e.g. from a sediment) without any negative impact on the measurement results. Ultimately, FT-IR imaging ensures that no particle remains undetected, providing utmost reliability and measurement speed.
The secret to microplastics is the right compination of hard- and software
Besides the analytical method, the software is crucial to analyze microplastics. Traditionally, microplastics spectral reference libraries and provide statistical analysis of size, number and identity. But there is a limit to what such libraries can offer. If you need a very reliable and robust analysis, you must greatly increase the number of spectra within the library, which slows down the analysis considerably.
But in order to make microplastic analysis scalable and routine, data analysis must become faster and, above all, more intelligent. Using huge libraries is simply not practical when time is of the essence. That's why researchers have developed new methods that use machine learning, which fully exploit the immense potential of chemical imaging.
The following international directives and standards apply FT-IR in the analysis of microplastics:
- EU Directive 2020/2184
- ASTM WK87463
- ISO 4484-2:2023
- ISO 24187:2024
- ISO 16094:2025
Guide to FT-IR Analysis of Microplastic Particles
We have already mentioned, that researchers and microplastics experts around the world count on FT-IR imaging. The reason for this is for one the straightforward, easy workflow, as well as the unmatched reliability, speed and precision that is offered by the technology. In the following, we will provide deeper insights into the basics of the analysis in the lab.
Step #1: Sample Preparation
After taking a sample, it might have to undergo pre-treatment, depending on the contamination from the source, and is atferwards filtered unto compatible filer materials. Very clean samples like drinking water are usually filtered directly onto a suitable filter. But environmental samples like ocean water, river sediments or soil may contain sand or plant material and must be prepared prior to FT-IR analysis.
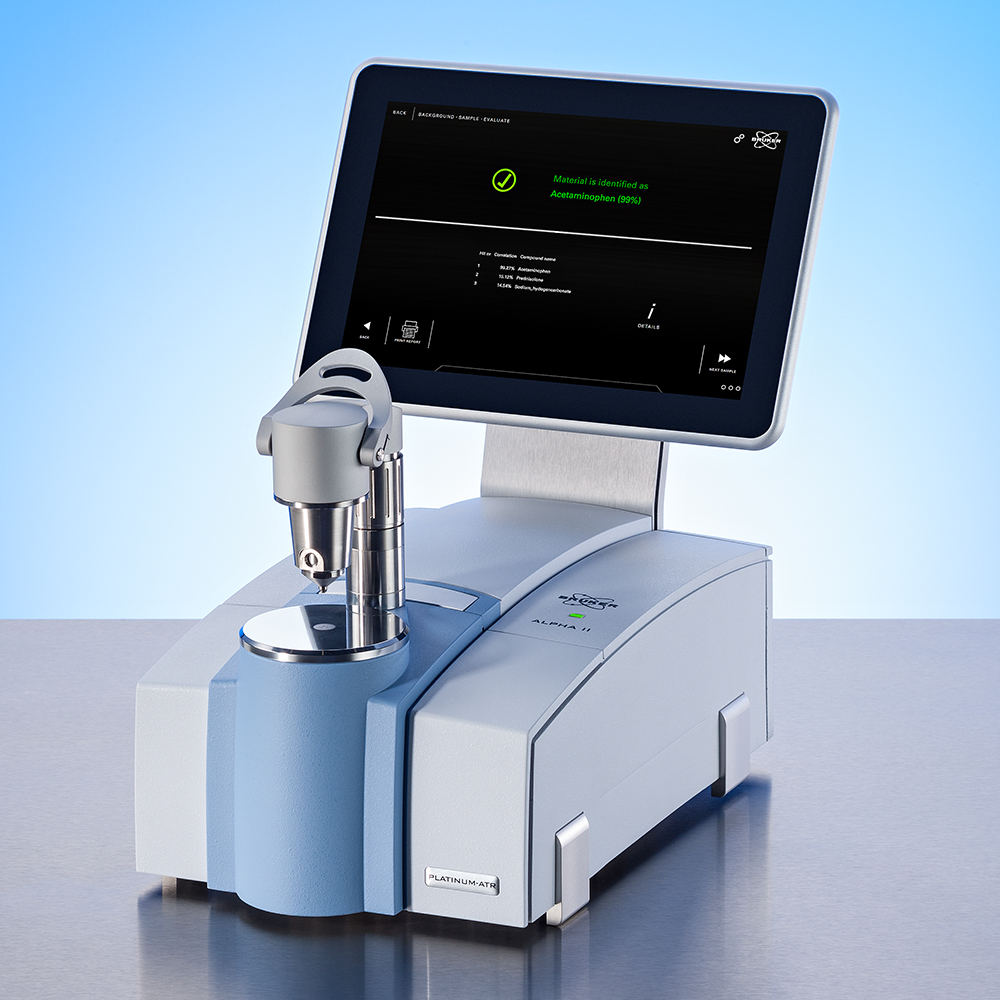
To remove larger, non-micro particles, mutiple, differently-sized filters are used. These bigger particles are later analyzed by macroscopic FT-IR spectrometers like the ALPHA II. After this, the samples are treated with salt solutions of different concentrations, which is called density separation. During the process, sand and other non-plastic particles sink to the bottom and can be easily removed afterwards.
But what about more complex samples like fish or mussels? Such samples need an as complex treatment to remove all organic matter that is left after dissection. Typically, enzymatic digestions, acidic or alkaline treatment is performed prior to filtration.
Step #2: Filtration
We previously mentioned that aluminum oxide filters are the best choice for microplastics analysis. But of course there are other materials available, like silicon, PTFE, or gold-coated polycarbonate filters which all have distinct advantages and disadvanatges. However, since aluminium oxide filters have become the standard for FT-IR analysis of microplastics, we will also adhere to those standards in our website and videos.
Step #3: FT-IR Imaging Analysis
Out of the three avilalbe measurements modes of FT-IR (transmission, reflection and ATR) transmission is the most suited for a fast and hassle-free analysis. Why? Well, ATR is a contact based method and particles can stick to the crystal which requires a user to clean it, making it unsuitable for automation. In reflection, thicker particles are hard to measure and produce spectral artifacts, making it less reliable. Finally, analysis in transmission is contactless and will give good spectra in a short amount of time.
Step #4: Particle Classification and Data Evaluation
The use of machine learning in the analysis of microplastics is on the rise. With it, researchers have found a reliable way to make data evaluation easy to use for anyone. Bruker provides the MP-ID Microplastics Identifier.The MP-ID is a software that automatically analyzes whole FT-IR images of microplastic samples within a few minutes. It yields a comprehensive statistics of all particles present on the filter and classifies them by number, identity and size. All with just one click.
The classifying algorithm is was trained by real world data that has been evaluated by different microplastic experts. In short, it brings you their combined knowledge into your lab and at your fingertips. Hence, the Microplastics Finder is the optimal tool for routine analysis of microplastic samples and one of the most promising candidates for future standardizaton. The goal is, to guarantee comparability between different laboratories, researchers and analytical insitutes around the world, eleminating human bias altogether.