OPUS Packages: VIDEO & 3D
VIDEO
OPUS/VIDEO is a software package for comfortable IR- and RAMAN-microscopic analysis. The user interface guides the operator step-by-step intuitively through the process of data acquisition.
OPUS/VIDEO Features:
- Individual Video Wizards provide optimal workflows for microanalysis using the Bruker microscopes LUMOS II, HYPERION, SENTERRA II and RamanScope III.
- Clear User Guidance through the steps of micro-spectroscopic analysis.
- Visual microscopic Image Acquisition and live view.
- Live View of Spectra before measurement.
- Automated Mapping measurements of irregular, line and rectangular grids.
- Central Data Storage of spectra, IR/Raman images, visible images and annotations within one common file.
The intuitive Video Wizard presents at each analytical step only those functions which are appropriate to use next, ensuring a comfortable workflow and high efficiency.
The typical measurement procedure consists of the following steps:
- Visual Sample Inspection for acquisition of single and assembled visual overview images.
- Selection of Measurement Settings, such as the measurement mode (ATR, transmittance, reflectance, Raman).
- Interactive Definition of Measurement Positions.
- Sample Measurement resulting in a single file including all relevant data such as visible images, spectral data and information about the sample and the experiment. The file is directly loaded and presented in the Chemical Imaging window of OPUS/3D.
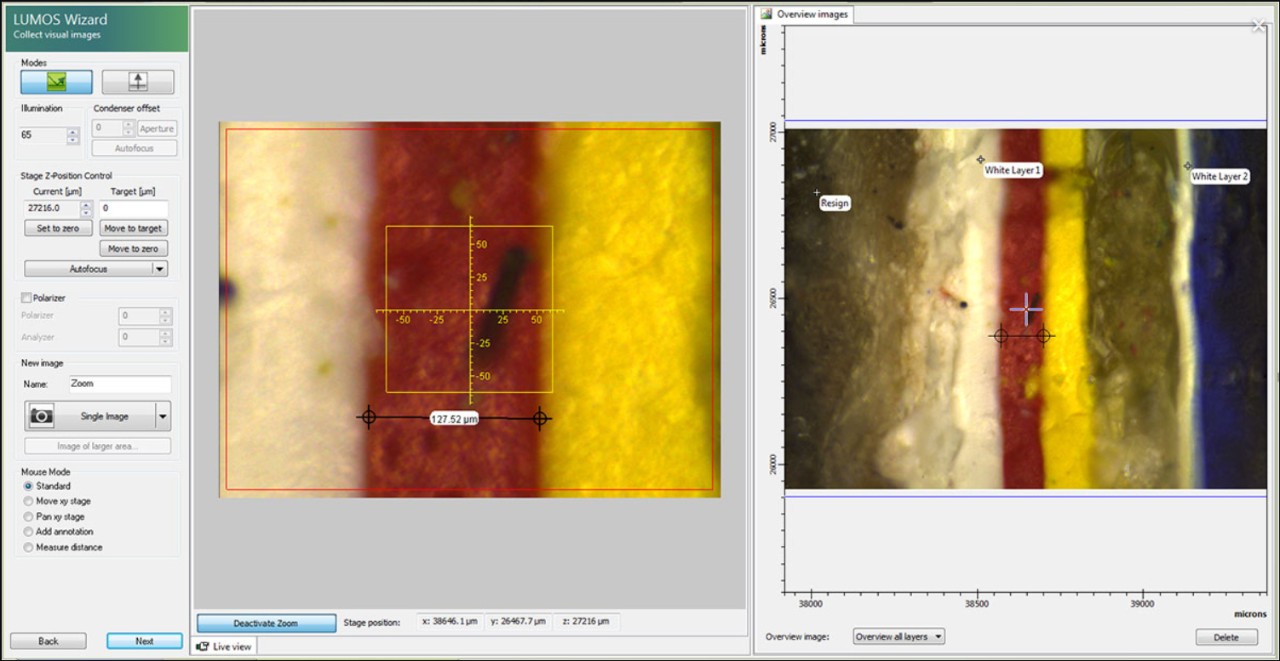
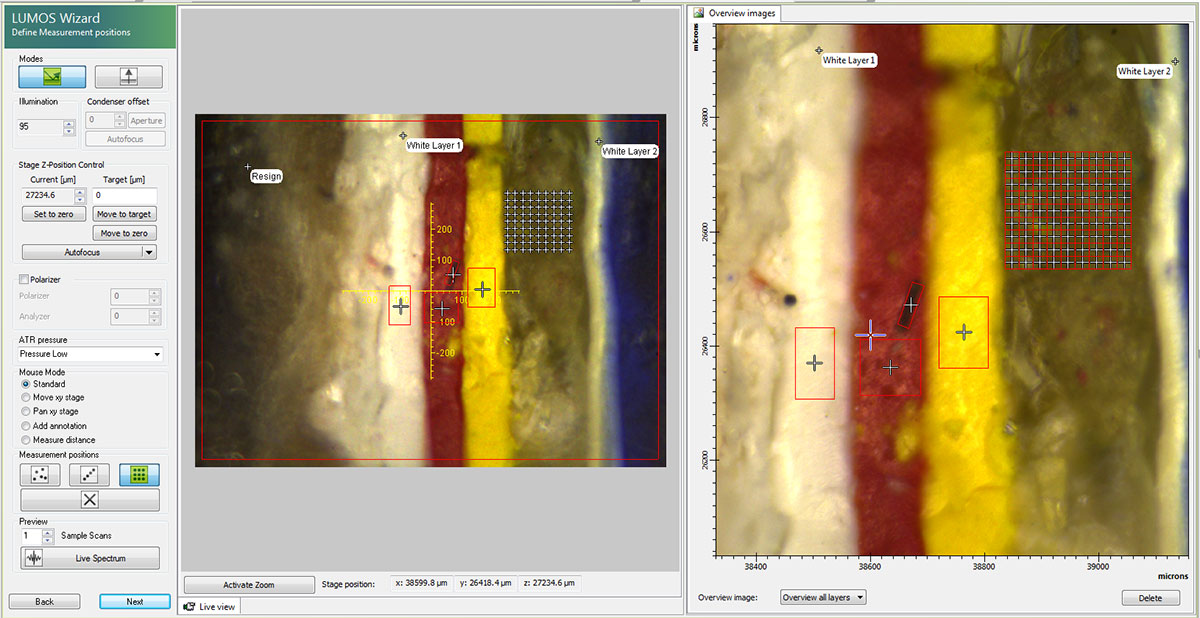
OPUS Package: VIDEO
Visual sample inspection for acquisition of single and assembled visual overview images.
Interactive definition of measurement positions.
Chemical Imaging
OPUS/3D is a modern and intuitive spectral imaging software package for comfortable 3D data processing, evaluation and visualization. For visual and spectral data from micro-spectroscopic analysis e.g. with the Bruker microscopes LUMOS II, HYPERION, SENTERRA II and RamanScope III, the OPUS/3D Chemical Imaging window provides powerful tools and functions.
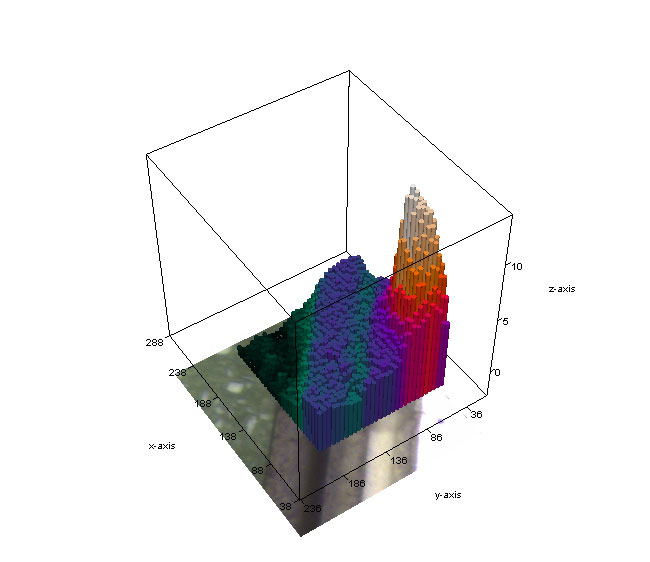
- Broad Variety of 2D and 3D Views for the display of chemical images resulting from regular (line, rectangular) and irregular mapping measurements.
- View for user-selected Spectra in a 3D file.
- Identification of Sample Components by library search of individual spectra from 3D data.
- Uni- and multivariate Evaluation of 3D spectral Data. Selection of available methods:
- Integration of user-defined bands (interactive and by predefined methods)
- Peak picking
- Quantification via univariate and multivariate (PLS) calibrations
- Correlation of 3D data with single component spectra
- 3D cluster analysis
- Principal component analysis (PCA) of 3D data including calculation of
loadings and factors
- Combination of up to 8 Components in one Red Green Blue image (classical and “winner takes it all”).
- Processing of 3D spectral Data. Selection of available methods:
- Atmospheric compensation for minimized spectral interference by water vapor and CO2
- Subtraction of single and multiple spectra with automatic determination of scaling factor
- Normalization functions (minimum-maximum- and vector normalization, offset correction)
- Calculation of derivative spectra
- Conversion of spectra (Absorbance, transmittance, ATR, reflectance)
- Processing of individual Spectra inside 3D files
- Extraction of single Spectra Files from 3D Data and creation of 3D data from single files
- High Quality Export of all Views to different graphical formats, clipboard or printer
- Export to MATLAB 3D format
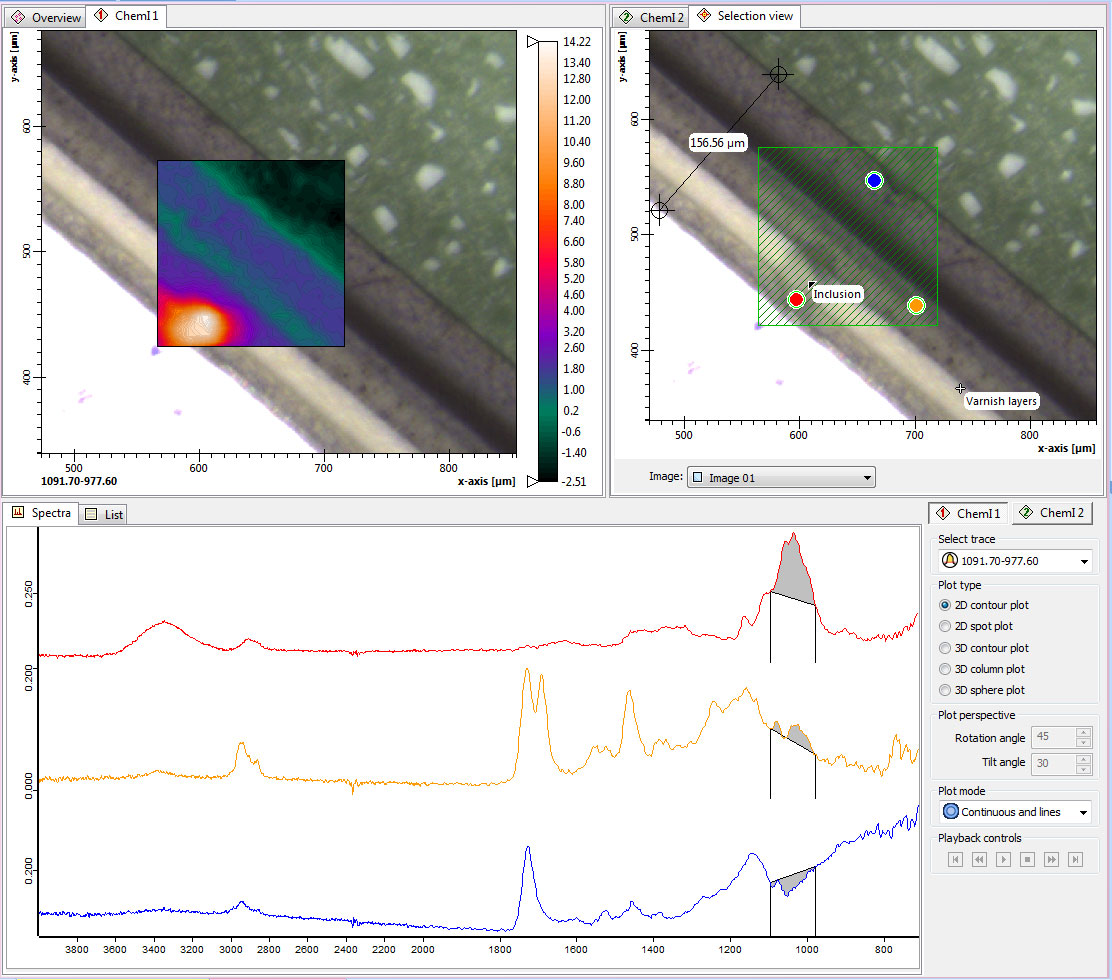
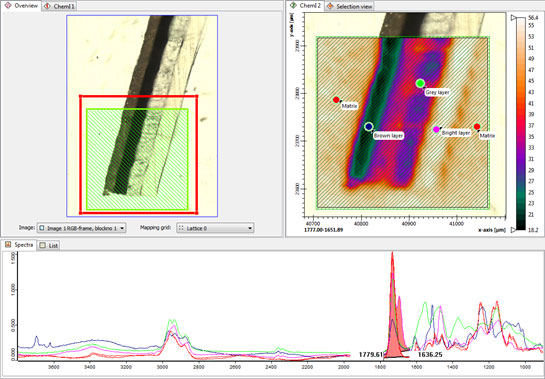
OPUS/3D Package: Chemical Imaging
View for user-selected spectra in a 3D file
Combination of up to 8 components
Export to MATLAB 3D format
Time Resolution
OPUS/3D is a modern and intuitive spectral imaging software package for comfortable 3D data processing, evaluation and visualization. For time resolved (TRS) spectral data e.g. measured with VERTEX series spectrometers via Rapid-Scan or Step-Scan technique, the OPUS/3D TRS post processing window provides powerful tools and functions.
- Choice of different 2D and 3D Views for the display of time resolved spectral data with various options for color schemes, contour levels and plot modes.
- Interactive and smooth Adjustment of angle of view and zoom.
- Complete Spectra List Window with access to all individual spectra of the 3D file.
- Separate Views for user-selected Spectra at individual times and for user selected time traces at individual spectral positions.
- Application of all Evaluation and Processing Functions to the complete 3D file, including mathematical operations between different 3D files via spectrum calculator.
- Application of various Functions to individual Spectra of the 3D File: library search, baseline correction, normalization, smooth etc..
- Extraction of single Spectra Files from 3D Data and creation of 3D data from single files.
- Advanced Extraction Functionality via included 3D plus view: sub 3D file, averaged or coadded spectra, differential absorption etc..
- Export of 3D File to ASCII format.
- High Quality Export of all Views to different graphical formats, clipboard or printer
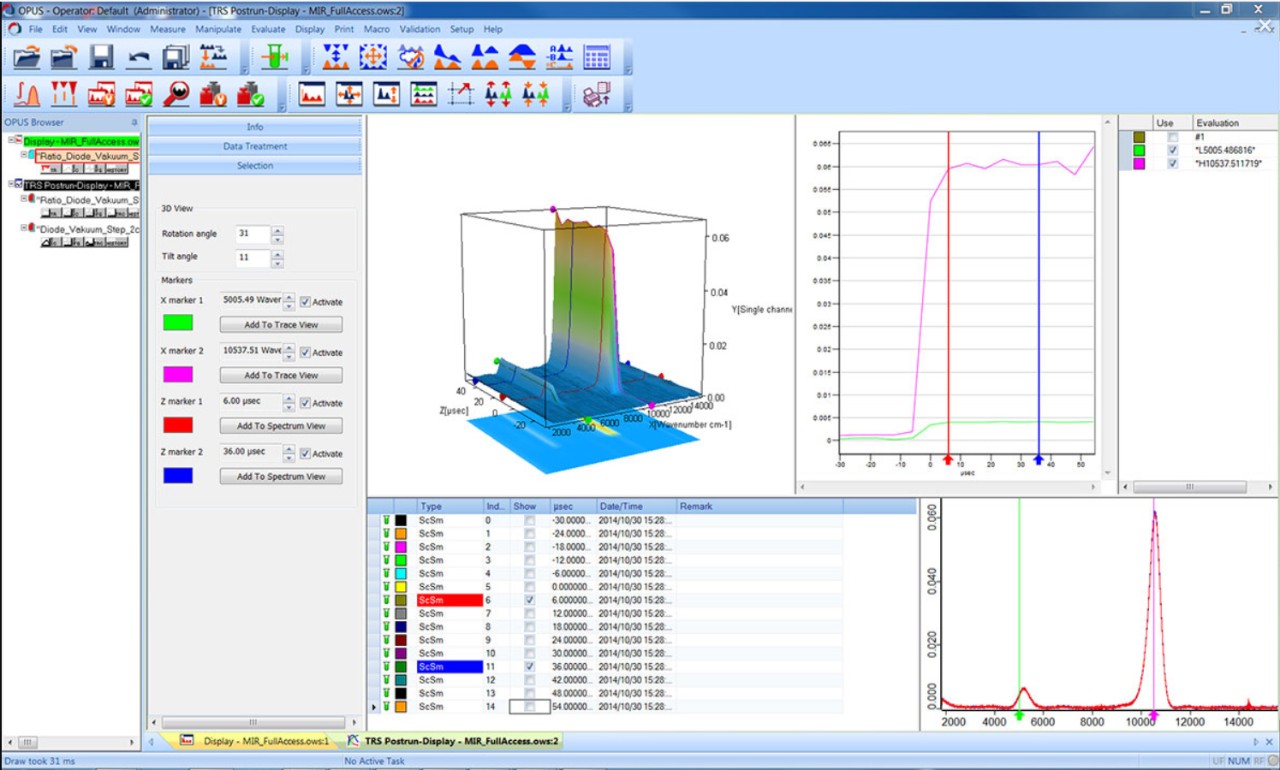
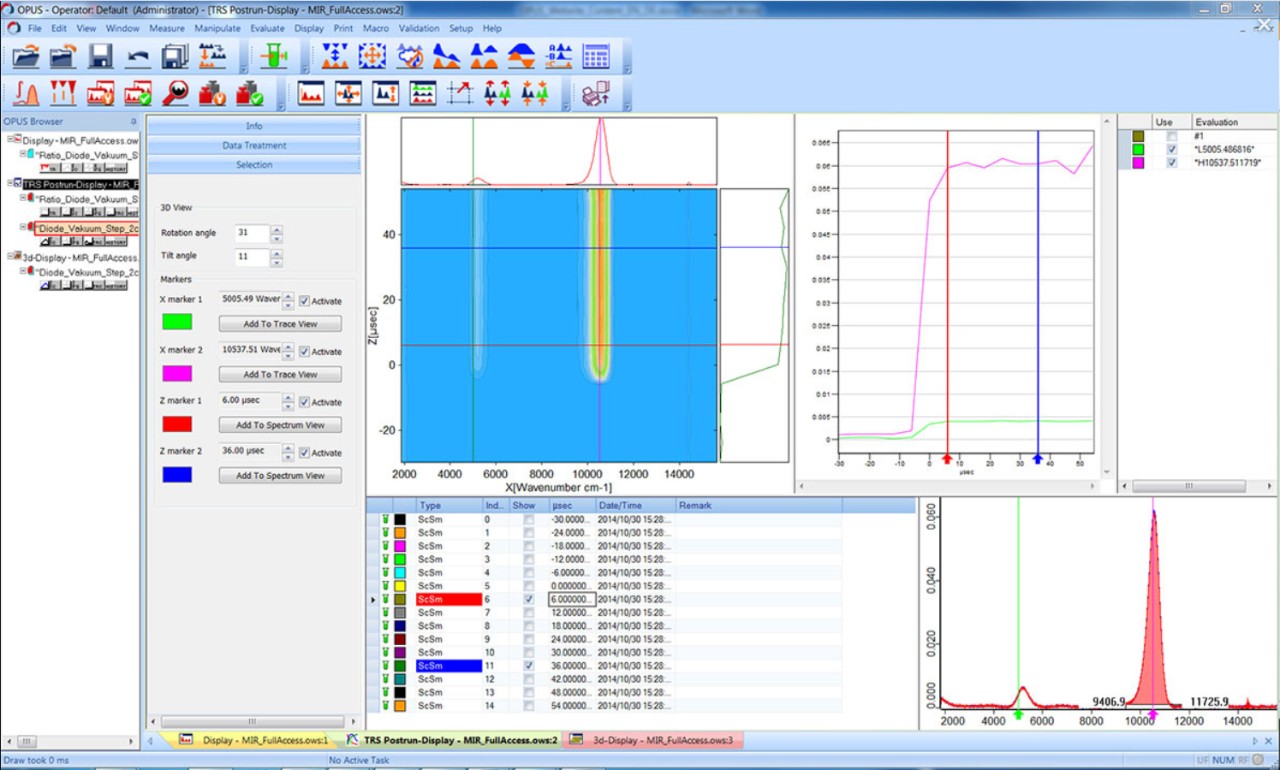
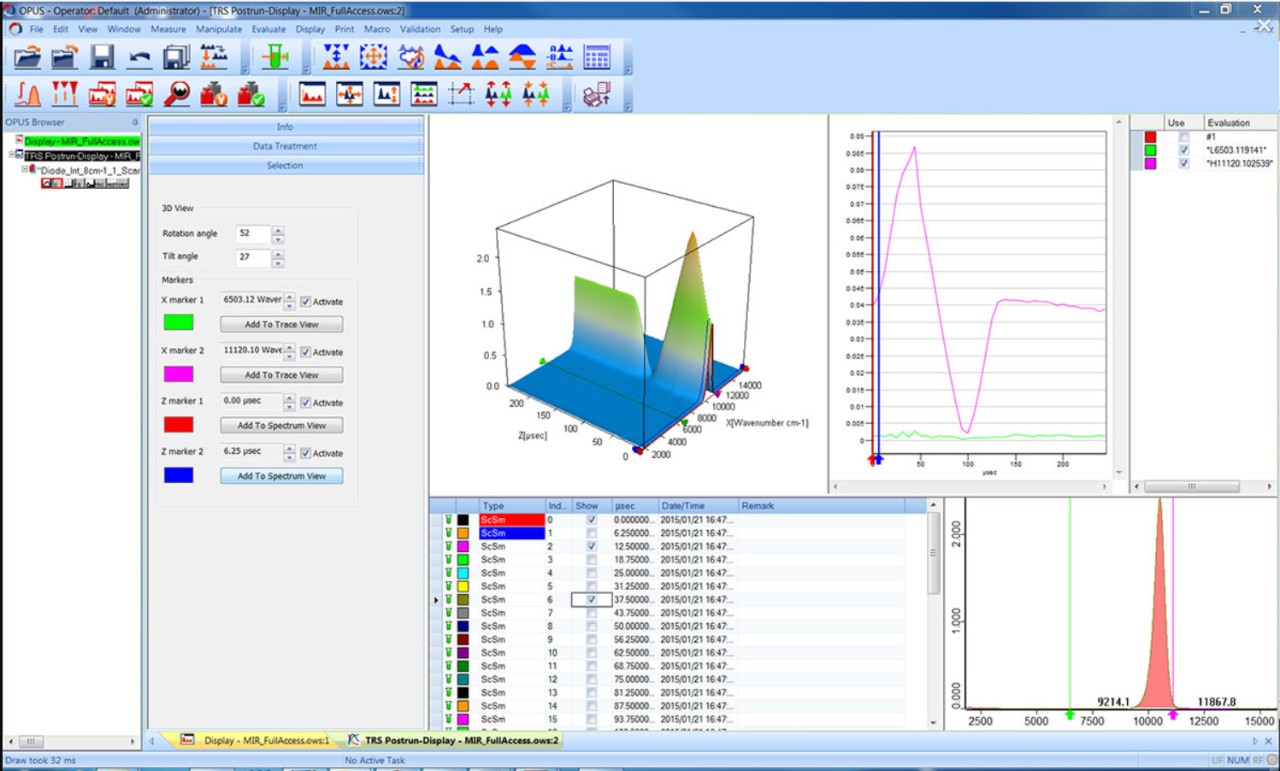
OPUS/3D Package: Time Resolution
OPUS/3D, time resolved step-scan measurement of infrared LED
OPUS/3D, time resolved step-scan measurement of infrared LED, alternative visualization via contour plot
OPUS/3D. interleaved time resolved measurement
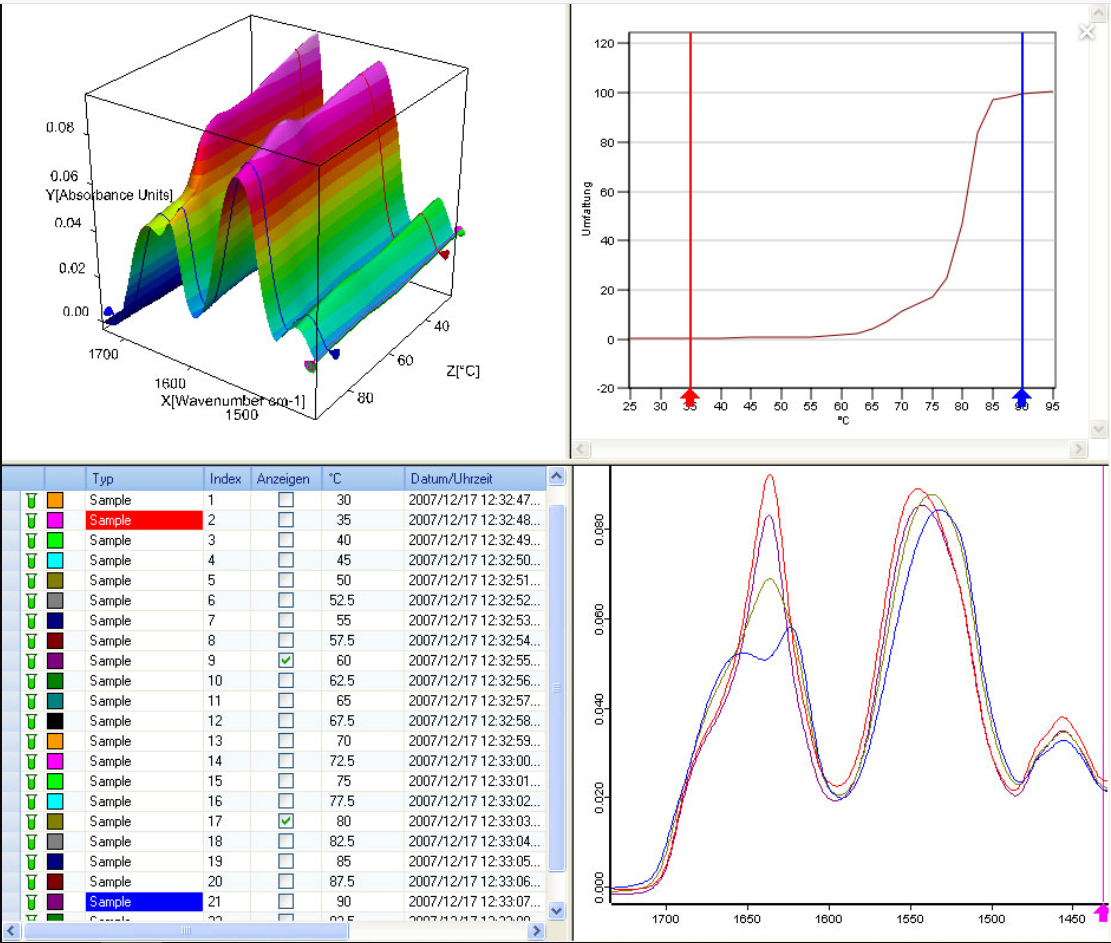
OPUS/3D, example screenshot: also data depending on other parameters than time (here e.g. temperature) can be visualized