Application Note: Advantages of Photothermal AFM-IR for Polymer Research
Gaining Valuable Nanoscale Insights into Polymers
Polymers are integral to various industries, including food packaging, tire manufacturing, adhesives, and medical‑grade plastics. Photothermal atomic force microscope‑based infrared spectroscopy (AFM‑IR) enables nanoscale chemical characterization and is particularly effective for studying polymers due to their large thermal expansion coefficients.
This application note explores the diverse applications of AFM‑IR in polymer research, including the identification of polymer species, quantification of polymer components, and characterization of functional polymeric materials. Findings from AFM‑IR studies provide valuable insights into the chemical compositions, distributions, and properties of polymers, driving the development of enhanced polymer formulations and structures with micro‑ and nanoscale features.
Readers can expect to find:
- Background on why photothermal AFM-IR is valuable for polymer research.
- Six case studies on various polymeric materials.
- Images correlating chemical data with mechanical and electrical data.
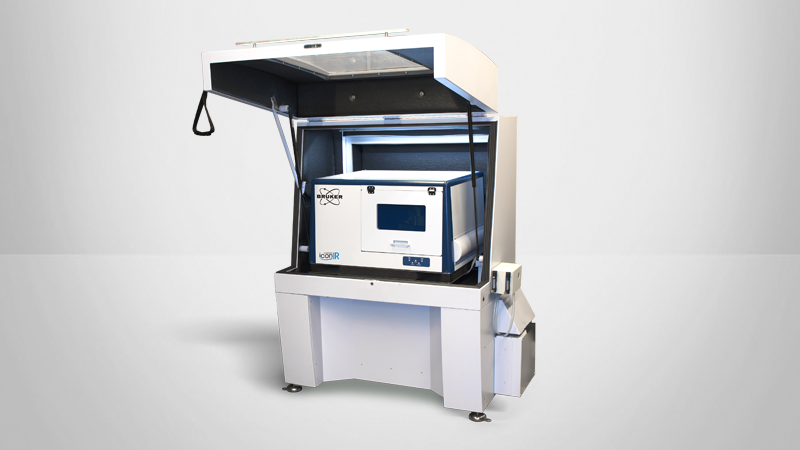
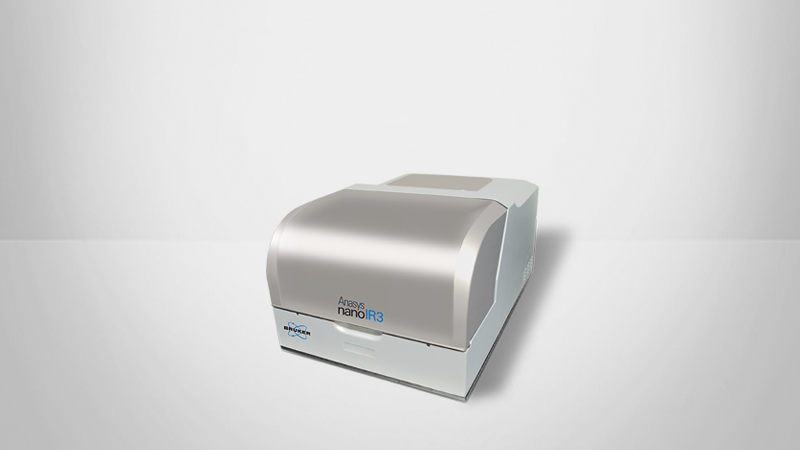
KEYWORDS: Nanoscale Infrared Spectrometers; Nanoscale IR Spectroscopy; nanoIR; AFM-IR; AN208; Bruker; Application Note; Dimension IconIR

Introduction
Polymers are integral to various industries, including food packaging, tire manufacturing, adhesives, and medical‑grade plastics. Photothermal atomic force microscope‑based infrared spectroscopy (AFM‑IR) enables nanoscale chemical characterization and is particularly effective for studying polymers due to their large thermal expansion coefficients. This application note explores the diverse applications of AFM‑IR in polymer research, including the identification of polymer species, quantification of polymer components, and characterization of functional polymeric materials. Findings from AFM‑IR studies provide valuable insights into the chemical compositions, distributions, and properties of polymers, driving the development of enhanced polymer formulations and structures with micro‑ and nanoscale features.
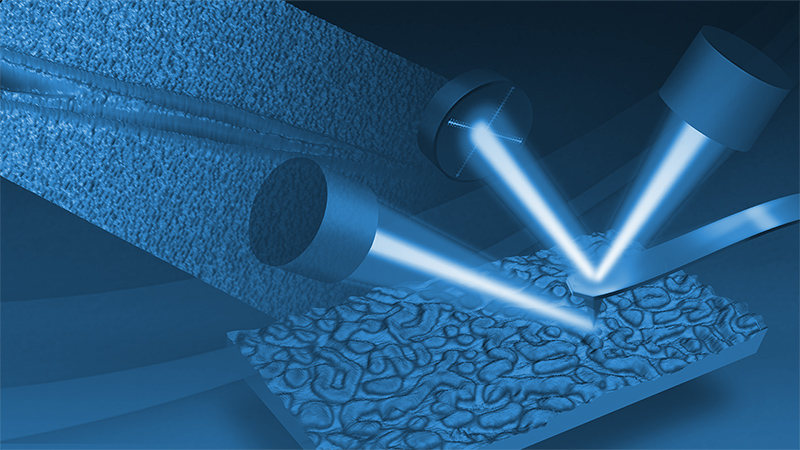
Photothermal AFM‑IR Technology
Polymer research has been transformed by the invention of photothermal AFM‑IR1 , which combines the high spatial resolution of AFM with the chemical identification capabilities of IR spectroscopy to enable nanoscale chemical characterization. AFM‑IR works by mechanically detecting the excitation of an AFM probe caused by thermal expansion of a sample upon IR absorption. The relatively large thermal expansion coefficients of polymers result in strong AFM‑IR signals, making them particularly suitable for this technique.
A wide range of polymeric materials have been studied using AFM‑IR, including multi‑layer films, polymer blends and composites, thin films and coatings, polymer fibers, polymer nanostructures, and biodegradable polymers. The demand for enhanced polymer performance in these areas has been driving the development of polymeric formulations and structures with micro‑ and nanoscale features. With high detection sensitivity (<1 nm thickness on non‑metal substrates)2 and sub‑5 nm lateral resolution, Bruker’s photothermal AFM‑IR technology has been highly effective in identifying and mapping chemical compositions in polymer blends, revealing local variations in crystallinity and their effects on macroproperties, distinguishing between surface and bulk behaviors of advanced polymers, understanding nanoscale bonding mechanisms in polymer‑metal complexes, and more.
Identification of Polymer Species on the Nanoscale
Each polymer exhibits specific characteristic absorption bands in the IR fingerprint region, enabling the identification of polymer species. Photothermal AFM‑IR spectroscopy correlates well with conventional Fourier transform infrared spectroscopy (FTIR), and the AFM‑IR spectra generated on Bruker’s nanoIR and Dimension IconIR® systems can be imported into FTIR libraries for digital searches, facilitating nanoscale chemical identification.
The AFM‑IR technique has been used to identify polymers and their distributions in diverse samples, including polymer blends, polymer components in hybrid materials such as printing ink and automobile tires, polymer contaminants on semiconductor wafers, polymers in asteroids3 , meteorite, shale rocks and bitumen, and drinking water4 . Results from AFM‑IR measurements provide important information for the search of polymeric species and guide the improvement of the manufacturing and engineering processes of polymeric products.
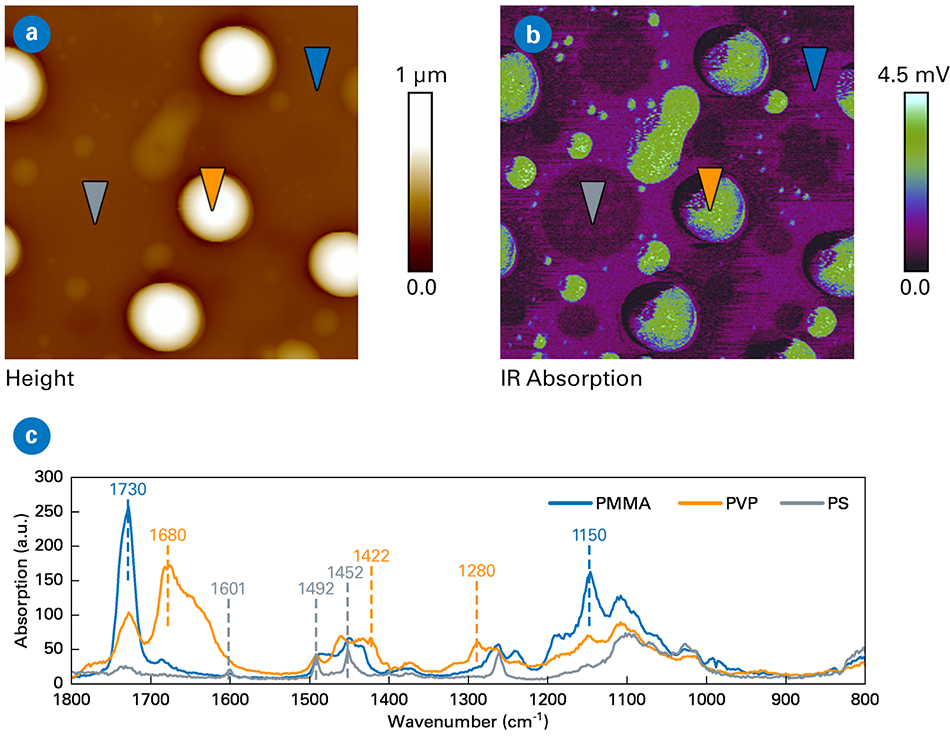
Figure 1 shows the AFM‑IR results of a polymer blend comprising three components: polystyrene (PS), polymethyl methacrylate (PMMA), and polyvinylpyrrolidone (PVP). The topography image in Figure 1a reveals distinct phases, including bright circular domains approximately 1 µm in diameter and 500 nm in height, along with smaller domains as small as 20 nm in diameter and 5 nm in height. Additionally, circular shallow holes with depths of only a few nanometers and diameters ranging from 300 nm to 1.4 µm are less conspicuous. The third phase is the flat, continuous matrix.
Figure 1c displays the AFM‑IR spectra collected from three different locations, labeled in the topography image by colored markers corresponding to the spectra of the same color. The domains, holes, and matrix are identified as PVP‑, PS‑ and PMMA‑dominant regions, respectively, based on their characteristic IR absorption bands: PS (1452, 1492 and 1601 cm‑1), PMMA (1150 and 1730 cm‑1), and PVP (1280, 1422 and 1680 cm‑1). IR absorption images were captured at several wavenumbers, with the image at 1422 cm‑1 shown as an example in Figure 1b, clearly highlighting both large and small PVP domains.
Quantification of Polymer Composites
An important aspect of polymer blends is the percentage of each component in different domains, as the chemical composition significantly influences the overall performance of the blend. With AFM‑IR, researchers can use bulk FTIR to calibrate their data and get quantitative information on mass mixtures.
Pioneering work by Su and colleagues demonstrated the capability of AFM‑IR spectroscopy to quantify the concentrations of polyethylene (PE) and polypropylene (PP) components in the three nanoscale domains—matrix, intermediate layer, and core—of high-impact polypropylene (HIPP).5 In another work, AFM‑IR spectroscopy was employed to quantify interface thickness and diffusion gradient across the interface of a polyamide/polypropylene (PA/PP) laminate.6
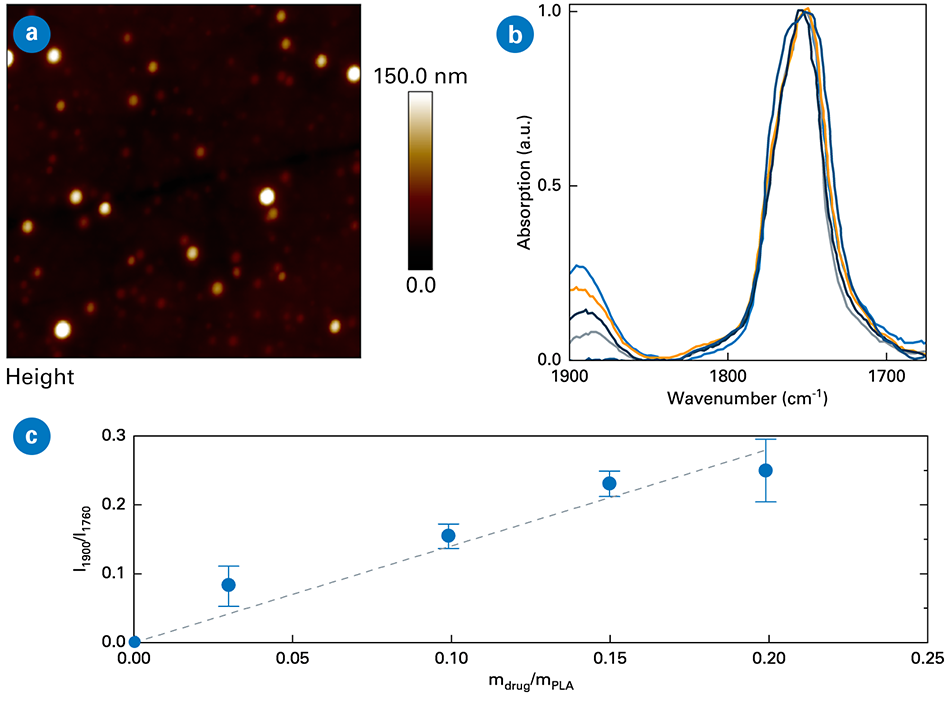
A more recent study employed AFM‑IR to quantify drug loading in polymeric nanoparticles.7 Poly(lactic acid) (PLA) nanoparticles were used as nanocarriers of Re(I) tricarbonyl‑diselenium, an anticancer drug. Figure 2a shows the topography image, revealing PLA nanoparticles ranging in size from tens to a couple hundred nanometers. Drug loading and distribution within individual nanoparticles were investigated. First, a calibration curve was established using conventional IR microspectroscopy with PLA/drug homogeneous films of known compositions. Local AFM‑IR spectra as well as IR mappings of PLA and drug were then obtained for individual nanoparticles.
Figure 2b displays AFM‑IR spectra collected from various nanoparticles, showing characteristic absorption bands at 1760 cm‑1 for PLA and 1900 cm‑1 for the drug. The intensity ratio of these bands correlated with the drug‑to‑PLA weight ratio (Figure 2c), with drug loadings varying from 0 to 21 wt% among the nanoparticles. IR mapping further identified drug distribution within individual nanoparticles. This study demonstrates the use of AFM‑IR for reliable quantification in the quality control of nanomedicines.
Characterization of Functional Polymeric Materials
AFM‑IR has been applied to characterize numerous functional polymers, providing insight into their nanoscale chemistry‑structure‑property relationships. This knowledge is essential for improving existing polymer manufacturing processes to enhance performance and for developing novel polymers with desired functionalities. The three examples below represent a small sampling of what has become a common application for AFM‑IR.
Biodegradable polymers
Biodegradable polymers, such as polylactic acid (PLA), have the potential to become sustainable alternatives to traditional fossil‑based polymers. Pure PLA has a high crystallinity, which makes it difficult to foam. Blending PLA with other polymers, such as biodegradable poly(3‑hydroxybutyrate‑co‑3‑hydroxyvalerate) (PHBV), is a promising approach to improve its foaming behavior, which is important for insulation and cushioning capabilities. AFM‑IR was used to study the morphology, inhomogeneous distribution, and related foaming and crystallization behavior of this biodegradable polymer blend, in which the PHBV content was varied from 0 to 40%.8
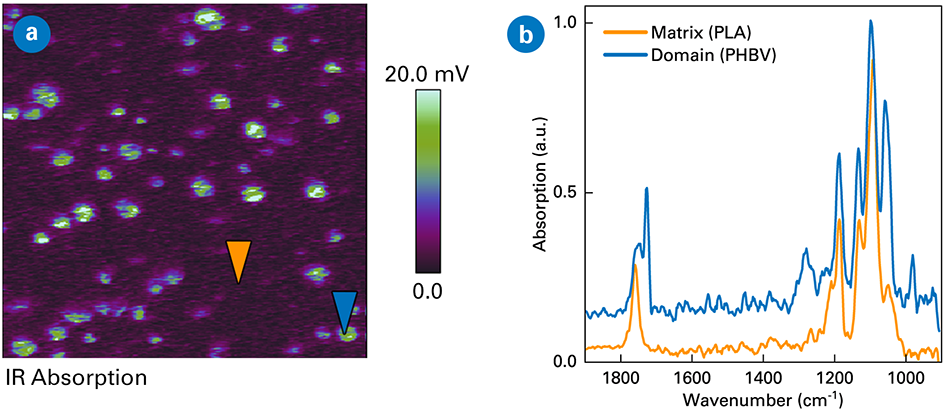
Figure 3 shows results for a blend with 10% PHBV content. IR absorption images were recorded at 1750 cm‑1 (PHBV) and 1760 cm‑1 (PLA), and the ratio image (1750/1760) in Figure 3a shows an inhomogeneous distribution of PHBV domains in the PLA matrix, with the size and shape of the domains varying with PHBV content. The AFM‑IR spectra in Figure 3b confirms PLA as the matrix and PHBV as the domains.
These results have significant implications for the properties of PLA/PHBV blends, particularly their crystallization and foaming behavior. At low PHBV content, small PHBV domains are hindered from crystallizing by the PLA matrix. As PHBV content increases, this hindrance also decreases. A higher PHBV content results in an increased complex modulus, which adversely affects foaming. Consequently, the foam morphology at higher PHBV content exhibited greater density, higher cell and nucleation densities, and smaller cell sizes.
Ferroelectric polymers
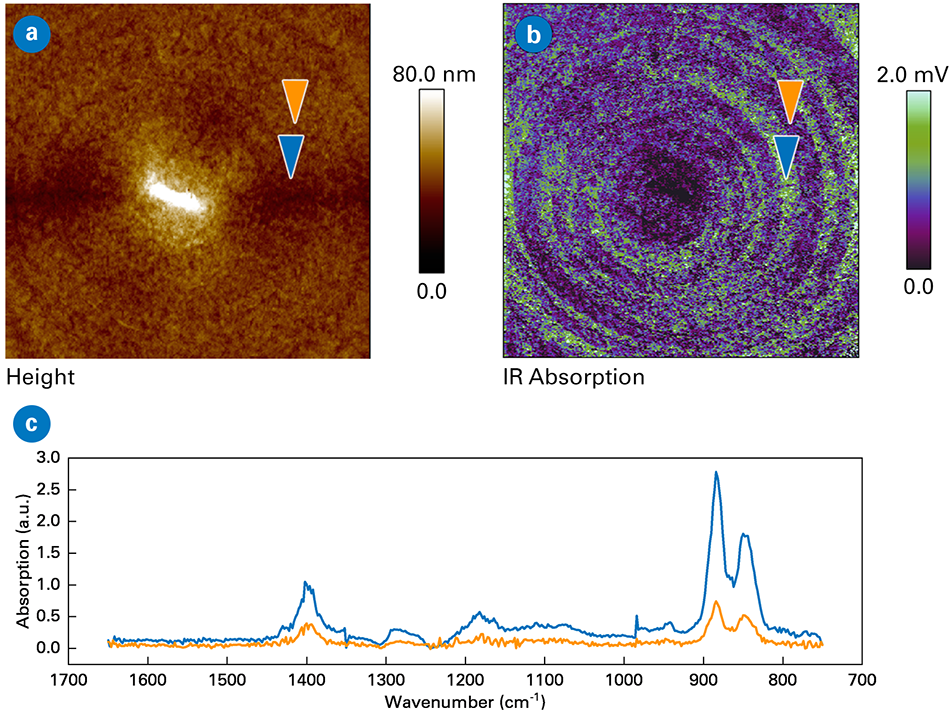
Ferroelectric polymers, such as poly(vinylidene fluoride) (PVDF) and its binary and ternary copolymers, have important applications in reconfigurable electronic devices. The AFM‑IR technique has been used to study P(VDF‑TrFE), which exhibits a dominant crystalline β phase with an all-trans conformational sequence.9 This work, published in Science, verified for the first time that the P(VDF‑TrFE) polymer forms a concentric toroidal polar topology.
AFM‑IR spectra recorded from the P(VDF‑TrFE) lamellae showed characteristic IR absorption bands, including one at 880 cm‑1 corresponding to the symmetric stretching of the CF2 group. The IR absorption image at this wavenumber displayed a spatially alternating pattern consistent with the toroidal topology, as seen in Figure 4. Such topology formation was driven by effective alignment of the P(VDF‑TrFE) lamellar crystals, with their interchain dipoles oriented perpendicular to the polymer chains. When the IR polarization was parallel to the film plane, a spatially periodic absorption pattern emerged due to the continuous variation in local absorptions of face‑on lamellae, resulting from the alternating toroidal ferroelectric polarizations.
Bonding mechanism in metal‑plastic hybrids
Metal‑plastic hybrids have attracted significant interest in engineering fields due to the growing demand for weight reduction. Achieving direct bonding between metal and plastic is particularly desirable in such hybrids. One recent study utilized the AFM‑IR technique to examine the aluminum/polyamide 6 (PA6) hybrid, providing direct evidence of strong hydrogen bonding formation at the interface.10
In this study, the aluminum plate was hydroxylated to create an amorphous AlOOH structure on its surface before being joined with PA6 via injection insert molding. AFM‑IR spectra were collected from five locations (Figure 5)—three within the bonding region, approximately 100 nm in size, and two in the PA6 bulk. While all spectra displayed the free C=O stretching band of PA6 at 1668 cm‑1, those from the bonding region revealed an additional peak at 1630 cm‑1. This new peak was attributed to the hydrogen‑bonded C=O stretching of PA6, indicating hydrogen bonding between the amorphous AlOOH and PA6. These hydrogen bonds contribute to the bonding strength between the aluminum plate and the PA6 polymer.

Correlative Study of Polymer Blends
When combined with other AFM modes, the chemical identification capability of AFM‑IR can be correlated with topographical, mechanical, and electrical information, thus offering a more comprehensive characterization of polymeric samples. Bruker's AFM‑IR platforms are equipped with AFM modes, such as PeakForce Tapping®, that enable correlative measurements either simultaneously or sequentially at the same sample locations. This powerful correlative approach provides unprecedented insights into sample properties.
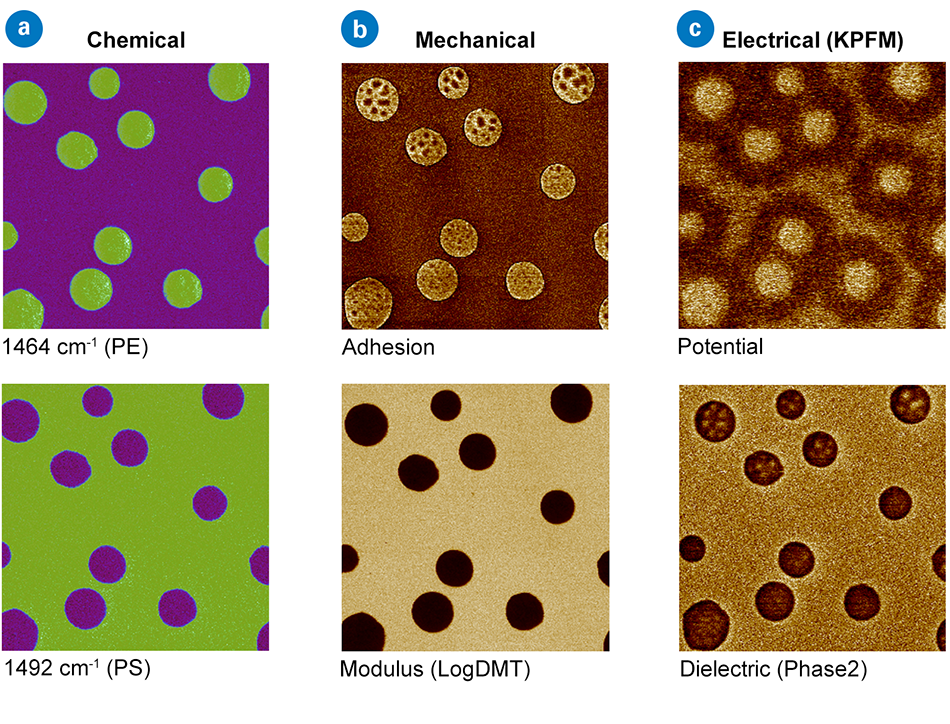
Various polymeric samples have been studied using correlative AFM and AFM‑IR modes. Figure 6 shows the chemical, mechanical, and electrical images of a PS/PE polymer blend. IR mapping at 1464 cm‑1, corresponding to the ‑CH2 ‑ bending mode, identifies the circular domain as PE, while the PS matrix shows stronger absorption at 1492 cm‑1 from its aromatic ring stretch. Mechanical mapping shows that the PE domains exhibited higher adhesion with some fine structures, as well as lower modulus. Kelvin probe force microscopy (KPFM) electrical mapping shows that PE has higher potential and lower dielectric. These techniques complement each other, providing a multifaceted view of the sample.
AFM-IR Provides Valuable Nanoscale Information for Polymers
AFM‑IR is a powerful, non‑invasive technique capable of identifying chemical compositions and their distributions on the nanoscale. This localized characterization provides valuable insights into the macroproperties and functions of polymeric materials. The information gained from AFM‑IR measurements is crucial for improving existing polymer manufacturing processes and for discovering and designing new functional polymers. When combined with other AFM modes, AFM‑IR also enables correlative studies of the chemical, mechanical, thermal, and electrical properties of polymers.
Authors
- Qichi Hu, Ph.D., Sr Staff Applications Scientist (qichi.hu@bruker.com)
- Chunzeng Li, Ph.D., Sr Engineer Development Application (chunzeng.li@bruker.com)
- Cassandra Phillips, Ph.D., Sr Product Manager Nanoscale IR Spectroscopy (cassandra.phillips@bruker.com)
- Peter De Wolf, Ph.D., Sr Director of Technology and Application Development (peter.dewolf@bruker.com)
References
- Dazzi, A., et al. 2005. “Local Infrared Microspectroscopy with Subwavelength Spatial Resolution with an Atomic Force Microscope Tip Used as a Photothermal Sensor.” Optics Letters 30 (18): 2388. DOI: 10.1364/OL.30.002388
- Hamadeh, A., et al. 2023. “Toward Conformational Identification of Molecules in 2D and 3D Self-Assemblies on Surfaces.” Communications Chemistry 6 (1): 246. DOI: 10.1038/s42004‑023‑01036‑8
- Yabuta, H., et al. 2023. “Macromolecular Organic Matter in Samples of the Asteroid (162173) Ryugu.” Science 379 (6634). DOI: 10.1126/science.abn9057
- Li, Y., et al. 2024. “Identification and Quantification of Nanoplastics (20–1000 Nm) in a Drinking Water Treatment Plant Using AFM-IR and Pyr-GC/MS.” Journal of Hazardous Materials 463 (February): 132933. DOI: 10.1016/j.jhazmat.2023.132933
- Tang, F., Peite Bao, and Zhaohui Su. 2016. “Analysis of Nanodomain Composition in HighImpact Polypropylene by Atomic Force Microscopy-Infrared.” Analytical Chemistry 88 (9): 4926–30. DOI: 10.1021/acs.analchem.6b00798
- Büttler, J. R., Thomas Bechtold, and Tung Pham. 2020. “Investigation of Interfacial Diffusion in PA/PP- g -MAH Laminates Using Nanoscale Infrared Spectroscopy.” Langmuir 36 (33): 9886–93. DOI: 10.1021/acs.langmuir.0c01447
- Ural, M. S., et al. 2022. “Quantification of Drug Loading in Polymeric Nanoparticles Using AFM-IR Technique: A Novel Method to Map and Evaluate Drug Distribution in Drug Nanocarriers.” The Analyst 147 (23): 5564–78. DOI: 10.1039/D2AN01079H
- Brütting, C., et al. 2023. “Sustainable Immiscible Polylactic Acid (PLA) and Poly(3-Hydroxybutyrate- Co -3-Hydroxyvalerate) (PHBV) Blends: Crystallization and Foaming Behavior.” ACS Sustainable Chemistry & Engineering 11 (17): 6676–87. DOI: 10.1021/acssuschemeng.3c00199
- Guo, M., et al. 2021. “Toroidal Polar Topology in Strained Ferroelectric Polymer.” Science 371 (6533): 1050–56. DOI: 10.1126/science.abc4727
- Zhao, S., et al. 2024. “Investigation of the Influence of Aluminum Surficial Water on Aluminum-Plastic Hybrids through a Combined Experimental and Simulation Approach.” Applied Surface Science 656 (May): 159694. DOI: 10.1016/j.apsusc.2024.159694
©2025 Bruker Corporation. All rights reserved. Dimension IconIR and PeakForce Tapping are trademarks of Bruker Corporation. All other trademarks are the property of their respective companies. AN208, Rev. A0.