PolyTools 2.0
Straightforward results
Average masses and end groups with one click

Polymer MS spectra interpretation done the easy way
Software for MS polymer data analysis
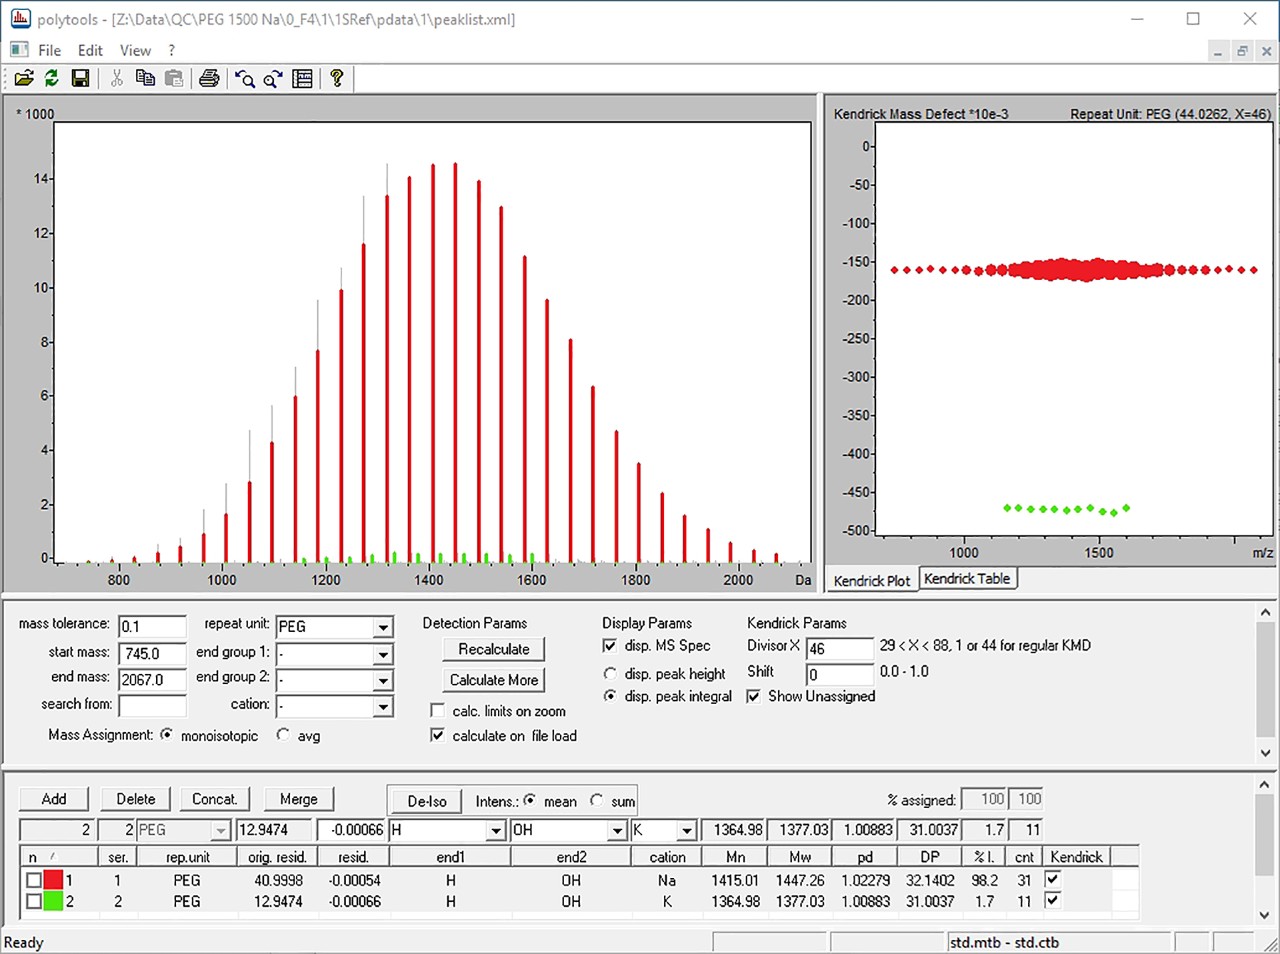
PolyTools can directly use peak lists created with flexAnalysis or other Bruker programs, or from other sources. PolyTools will automatically determine the monomer, end groups and cation that produced the measured mass spectrum. If isotopes are resolved in the peak list, lines belonging to the isotope distribution are identified and can be reduced to a monoisotopic series. For every series, the average molecular weights Mn and Mw, the dispersity ĐM and degree of polymerization are determined and suggestions for the end groups are made. New stick spectra calculated from all these data are displayed, together with the experimental spectrum for comparison.
Further, in PolyTools version 2.0, a new Kendrick plot function is implemented to give users a graphical overview of peak series observed in a spectrum, and to be helpful to organize and interpret peak series in spectra especially of complex mixture samples.

Simple, straightforward, specific

Independently if used for QC of incoming goods, a quick synthesis control or a detailed characterization of polymeric compounds: PolyTools is the ideal software for a quick answer to your polymer related questions and will therefore increase lab efficiency.
The use of MALDI-TOF MS together with PolyTools offers major advantages:
- Simple – deskilled technology with fast adaption
- Speed – fast time to results
- Direct access to molecular weight and end groups
- Flexibility for difficult analytes
- Complete solution with industry standard software
Quality control of incoming goods
From dissolving of the sample until PolyTools displays the results characterizing the analyzed polymer takes only a few minutes. Therefore, PolyTools in combination with the mass spectrometric analysis with a MALDI time of flight mass spectrometer is the ideal combination for getting fast and reliable information on incoming goods. Average molecular weights Mn and Mw as well as the observed end group combination can directly be compared with the reference compound.
In detail characterization of highly complex samples
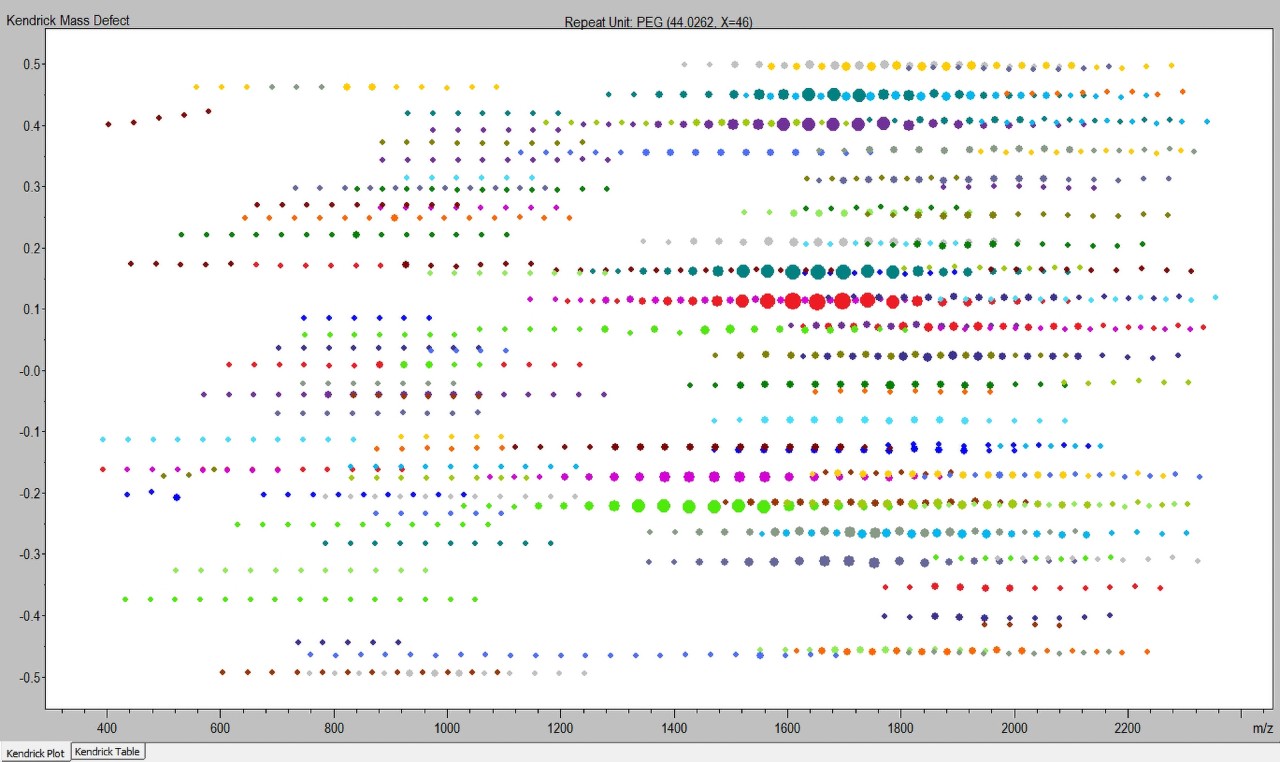
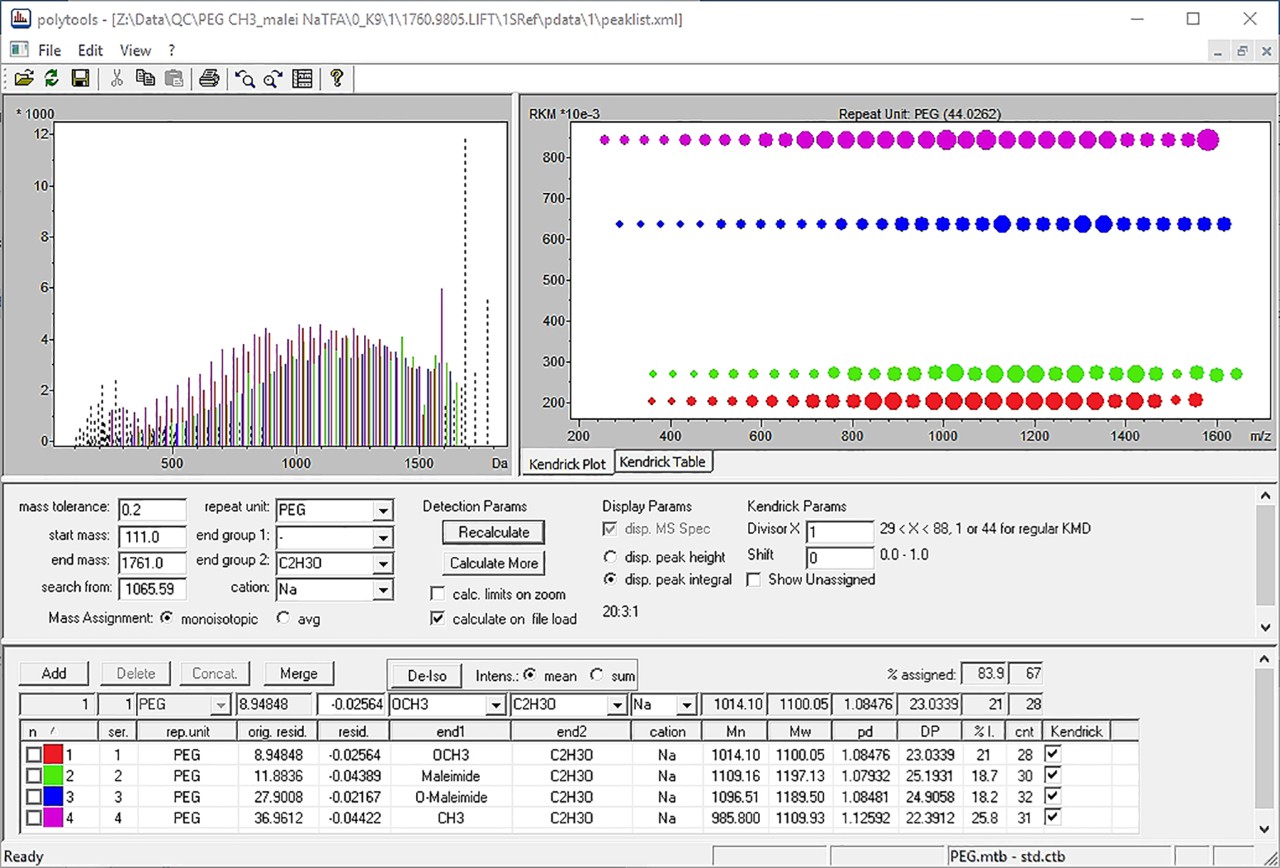
Complex mixtures of polymers like the non-ionic surfactant Tween requires a different visualization of the spectra: a simple simulation of found oligomeric ion series is not sufficient in this case. PolyTools offers the possibility to show the spectra in the form of Kendrick Mass Defect (KMD) plots and resolution enhanced KMD plots. For mass spectra obtained on instruments with a low resolving power or from the higher mass range where only oligomeric resolution can be achieved, PolyTools contains the remainders of Kendrick Mass (RKM) plot. This can be applied to increase the mass tolerance compared to regular and resolution enhanced KMD plots. Even mass range over 10 kDa or TOF/TOF spectra can be reasonably visualized.
For the end group analysis PolyTools 2.0 offers two plots using the remainder of Nominal Kendrick Mass (RNKM): KMD - RNKM and RKM – RNKM. As a part of PolyTools 2.0 the PolymerTable editor allows the convenient setup of monomer units, end groups and cations in tables that serve as databases for the spectrum interpretation in PolyTools 2.0.
MS/MS analysis of synthetic polymers
In an MS experiment intact, oligomeric species are detected. The observed masses are composed of a certain number of monomer units, the ionizing cation, and the masses of the two end-groups. Therefore, a single end group analysis cannot be obtained this way. An MS/MS experiment can provide this information as every fragment only carries one singe end group [1].
Another application where MS/MS can give a deeper insight into the structure of a polymer sample is the determination of the block length in a block copolymer [2].
[1] Knop et al.; Systematic MALDI‐TOF CID Investigation on Different Substituted mPEG 2000; Macromol. Chem. Phys. 2010, 211, 677–684
[2] Weidner et al.; A novel software tool for copolymer characterization by coupling of liquid chromatography with matrix-assisted laser desorption/ionization time-of-flight mass spectrometry; Rapid Commun. Mass Spectrom. 2007; 21, 2750–2758
Related Videos

I downloaded and installed the latest version. And it runs fantastic. By the way, I am analyzing MALDI spectra of paraffin oil and petroleum jelly, which I measured without matrix with silver cations. With PolyTools I can then calculate the distribution of masses and so we are able to instantly compare the quality of different raw material batches.
Dr. Julia Pruns, Chromatography, Beiersdorf AG, Hamburg, Germany

Our company manufactures electronic components in which various polymers are used. The PolyTools can automatically classify signal series in mass spectra of such polymers with different kinds of monomer units and end-group structures to facilitate structural analysis. In addition, newly deployed Kendrick Mass Defect analysis allows for more intuitive and quick analysis.
Kyosuke Kaneda, Materials Analysis, KYOCERA Corp., JAPAN


For Research Use Only. Not for use in clinical diagnostic procedures.