Automated Measurement Recipes for Photothermal AFM‑IR
AutoMET Enables Push-Button Operation for Photothermal AFM-IR
Recipe‑based automation for atomic force microscopy (AFM) workflows ensures consistent, repeatable data acquisition, reduces operator dependency, and streamlines complex measurement routines. Bruker’s AutoMET® automation software, widely adopted for conventional AFM characterization, now also brings automation to nanoscale IR (nanoIR) spectroscopy and imaging. AutoMET provides exceptional ease of use and adaptability for critical‑to‑quality measurements in production, QA/QC, or other high‑volume metrology applications, such as machine learning–based studies.
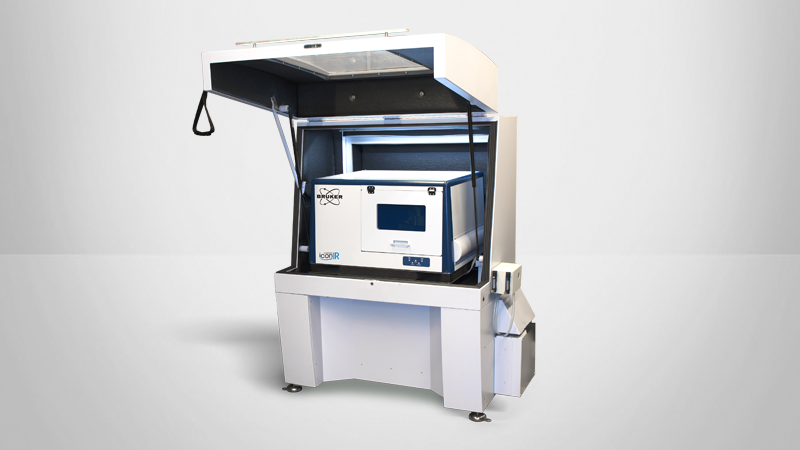
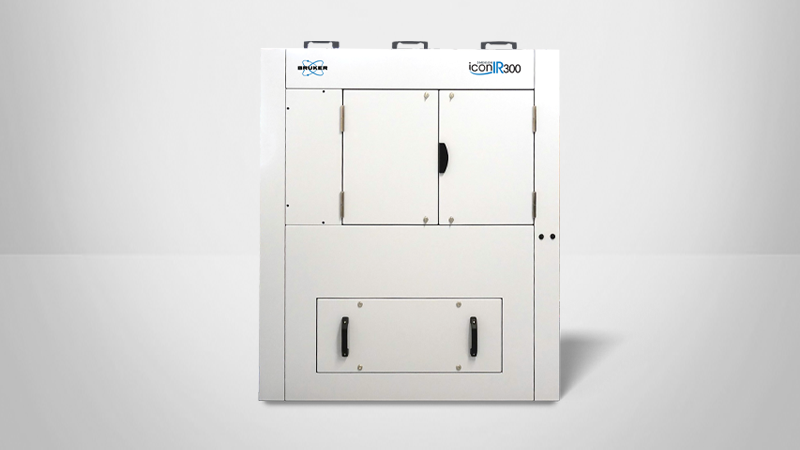
This technical note describes the workflows and recipe process, then presents case studies demonstrating AutoMET’s utility for defect review and multi‑sample analysis, using the Dimension IconIR® and IconIR300 systems.
Readers can expect to find:
- Benefits of AutoMET for Dimension IconIR systems
- A step-by-step procedure for recipe creation
- Two case studies illustrating the real-world value of automated AFM-IR workflows
KEYWORDS: Nanoscale Infrared Spectrometers; Nanoscale IR Spectroscopy; nanoIR; AFM-IR; TN202; Bruker; Technical Note; Dimension IconIR; Dimension IconIR300; AutoMET

Recipe‑based automation for atomic force microscopy (AFM) workflows ensures consistent, repeatable data acquisition, reduces operator dependency, and streamlines complex measurement routines. Bruker’s AutoMET® automation software, widely adopted for conventional AFM characterization, now also brings automation to nanoscale IR (nanoIR) spectroscopy and imaging. AutoMET provides exceptional ease of use and adaptability for critical‑to‑quality measurements in production, QA/QC, or other high‑volume metrology applications, such as machine learning–based studies. This technical note describes the workflows and recipe process, then presents case studies demonstrating AutoMET’s utility for defect review and multi‑sample analysis, using the Dimension IconIR® and IconIR300 systems.
Benefits of AutoMET for Dimension IconIR Systems
Recipe‑based automation enhances instrument throughput and reduces the risk of user error. AutoMET provides these benefits for AFM and photothermal AFM-IR workflows while maintaining a straightforward user experience in both operator and engineer modes (UI in Figure 1). Available for Dimension IconIR and Dimension IconIR300 platforms, AutoMET offers:
- Automated high‑resolution topography, roughness, nanomechanical, and nanoelectrical measurements (including analysis)
- Automated high‑resolution AFM‑IR imaging at recipe‑defined settings, such as IR wavelength (including analysis)
- Automated navigation to recipe‑defined sites for local IR spectroscopy
- Image placement accuracy of ±2 μm with optical pattern recognition, and nanometer positional accuracy with SPMZoom

Workflows and Recipe Process
Operator Mode
Designed for simplicity and efficiency, AutoMET’s operator mode consists of only two functions: conducting the probe setup and running a pre‑defined recipe. An operator simply moves through the probe setup procedure, makes the appropriate selections, and clicks on the Run Recipe button to start data collection.
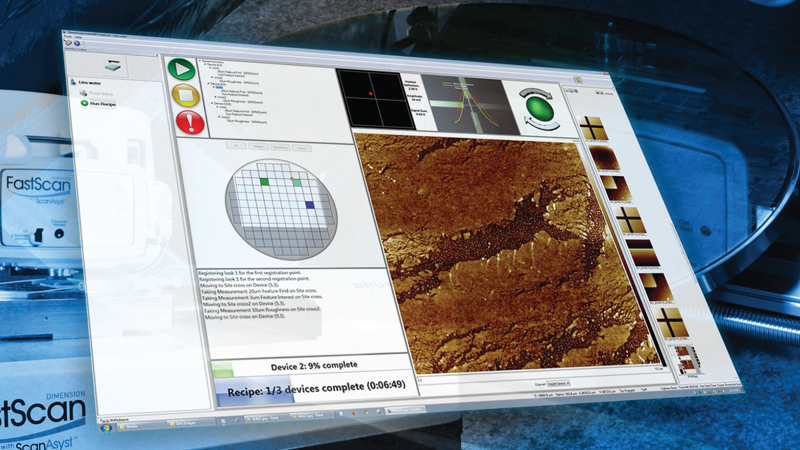
Figure 2 shows the AutoMET software as viewed by the operator, who can launch a recipe with a single click. No prior knowledge of AFM or AFM‑IR is required for the operator to run recipes. A status window displays the steps already executed and results from any analyses embedded into the recipe. The current activity (AFM‑IR imaging or spectroscopy at selected positions) is clearly indicated.

Engineer Mode
AutoMET recipes use the simple but powerful modular structure exemplified schematically in Figure 3. Each site, measurement, and analysis is a block that can be created, reused, and linked in any way the engineer chooses.
Once the recipe is set up and saved, a simple, one‑button click is all that is needed to start the measurement session. Recipes created on one Bruker system can also be transferred to others, simplifying test setup for any system operator, as well as an exchange and optimization of recipes with the Bruker applications team.


In engineer mode, the recipe structure is translated into a step‑by‑step workflow (Figure 4):
- Define sample layout (Sample Configuration): To support the many types of samples characterized by AFM, multiple sample measurement layout configurations are provided. Common configurations include grid‑based, photomask, and wafer‑based layouts.
- Create Scan Sites: Scan site locations define where imaging and spectroscopy can be conducted according to instructions given in the final stage of recipe setup.
- Create/Edit Measurements: Measurement settings are incredibly flexible, offering both AFM and AFM‑IR imaging modes.
- Create/Edit Actions: AFM‑IR point spectroscopy measurements can be created as measurement actions.
- Assign Measurements: Measurements are assigned to the sites following the modular principle from Figure 3.
Case Studies
Case Study 1: Characterization of Nanocontaminants on Bare Wafers
Nanocontaminants on bare wafers during the semiconductor manufacturing process can lead to degradation in performance, yield, and reliability. Characterization of these defects is a critical first step for their mitigation. The AutoMET software provides a fully automated defect review process that includes the following:
- Import of defect maps (such as KLARF maps): KLARF coordinate file–based navigation enables precise targeting of known contamination sites, enhancing both detection and redetection efficiency. Figure 5a shows the KLARF import function as well as the defect distribution map.
- Wafer registration: AutoMET's unique registration process does not require any reference marker on the bare wafer, but instead uses optical viewing of the wafer edge, wafer notch, and optional defect locations.
- Acquisition of survey scans: Review topographic IR maps are collected at selected KLARF coordinate sites.
- Zoom‑in scan imaging of defects: Targeted, high‑resolution scans are performed with the designated modes in the designated locations.
- Collection of IR spectra at and near defects: Imaging can be complemented with AFM‑IR point spectroscopy.
Defect review recipes typically begin by collecting topographic images at each selected defect site. Built‑in analysis extracts characteristics — such as defect height (or depth), defect diameter, and defect volume — and displays results during the recipe run while also storing and summarizing them in a single results file.
Further identification of defect type is enabled by simultaneous photothermal AFM‑IR mapping at specific wavenumbers. A chemical adsorption map generated by AFM‑IR can then be complemented with corresponding IR spectra to produce detailed information on a defect or contaminant’s chemical fingerprint. AFM‑IR imaging can also be used to visualize the distribution of selected chemistries at and around the defects. All of this rich chemical information enhances the identification of root causes for contamination or faults.1
During the example shown in Figure 5, KLARF navigation guided the AFM‑IR system to a cluster of nanocontaminants ranging from 50 to 200 nm in diameter. While topographic AFM imaging alone could not distinguish between different contaminant types, IR maps collected at different wavenumbers revealed five unique chemical functionalities. A composite image of IR absorption maps collected at the five distinct wavenumbers shows contaminant distribution (Figure 5c), while spectra collected from each contaminant type enabled clear chemical differentiation (Figure 5d).

Case Study 2: Characterization of Multiple Samples in a Single Recipe Run
Recipe automation of photothermal AFM‑IR workflows is essential for scaling nanoscale characterization up to large sets of samples, such as those required for machine learning (ML). ML datasets often comprise spectral and spatial information across varied materials, serving as training inputs for predictive models aimed at uncovering structure‑property relationships or identifying anomalies. Considerable time is saved when workflows for these large ML sample sets can be automated.
AutoMET’s recipes provide both automated acquisition and built‑in analysis. By automating the acquisition process, researchers can efficiently gather high‑volume, high‑quality datasets. By using built‑in analysis steps within the automated recipes, users can extract and summarize critical parameters without needing to manually interpret intermediate image data. This focused output not only accelerates decision‑making, but also ensures that downstream analyses, whether statistical or algorithmic, are based on the most relevant features.
Figure 6 illustrates the ability to efficiently analyze a multitude of samples with a single recipe. A set of ten PS/PMMA polymer composite samples2 prepared by microtomy were mounted onto the sample stage, which can easily accommodate large samples or a multitude of smaller samples. The recipe automatically collected optical images of each sample and performed photothermal AFM‑IR imaging at preset wavenumbers that corresponded to the aromatic ring stretch from PS (1493 cm‑1) and carbonyl stretch from PMMA (1730 cm‑1). Built‑in analysis extracted the surface coverage of PMMA and PS components. This recipe can easily be expanded to cover more samples, more sites on a given sample, a wider set of wavenumbers, or to pause at specific moments to perform local AFM‑IR spectroscopy.

AutoMET Introduces Push‑Button Operation for Photothermal AFM‑IR
AutoMET includes an intuitive and simple recipe‑writing environment that makes it extremely easy to reduce complex measurement routines to simple, push‑button operations. Operators of all experience levels can obtain detailed, accurate AFM and AFM‑IR measurements on thousands of samples by running pre‑defined recipes.
Authors
- Peter De Wolf, Ph.D., Sr Director of Technology and Application Development (peter.dewolf@bruker.com)
- Qichi Hu, Ph.D., Sr Staff Applications Scientist (qichi.hu@bruker.com)
- Cassandra Phillips, Ph.D., Sr Product Manager Nanoscale IR Spectroscopy (cassandra.phillips@bruker.com)
Acknowledgement
Samples from Reference 2 created by Guillaume Miquelard-Garnier, Cyrille Sollogoub and Alain Guinault, laboratoire PIMM, 155 boulevard de l'Hôpital 75013 Paris, France. Sample preparation by Pierre Alcouffe, Polymer Materials Engineering Laboratory (IMP, UMR CNRS 5223), France.
References
- First, M., Gomar‑Nadal, E., Hsiao, J., et al. 2024. “AFM Nano‑IR for Photomask in‑Line Defect Characterization.” In Photomask Technology 2024, edited by Lawrence S. Melvin and Seong‑Sue Kim. SPIE. DOI: 10.1117/12.3037631
- Bironeau, A., Salez, T., Miquelard-Garnier, G., and Sollogoub, C. 2017. “Existence of a Critical Layer Thickness in PS/PMMA Nanolayered Films”, Marcomolecules, 50 (10). 4064-4073. DOI: 10.1021/acs.macromol.7b00176
©2026 Bruker Corporation. AutoMET and Dimension IconIR are trademarks of Bruker. All other trademarks are the property of their respective companies. All rights reserved. TN202, Rev. A0.