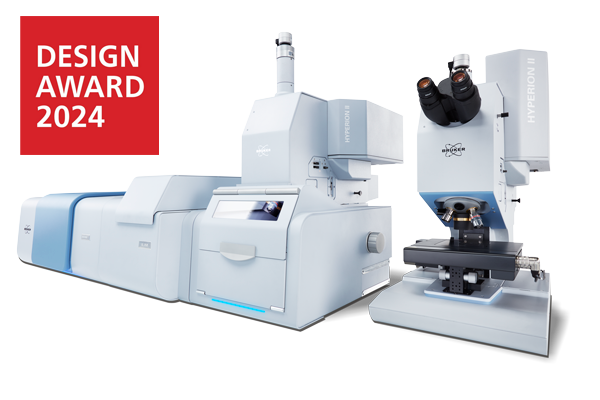
HYPERION II
傅立叶变换红外(FT-IR )结合 红外激光成像(QCL)
分析能力与创新
红外显微镜和成像研究平台
Hyperion II 有什么新内容:
我们如何集成红外激光成像:
我们的专利空间相干性降低技术:
QCL加强的 FT-IR 显微镜|红外激光成像
HYPERION II是红外显微镜领域的创新力量。它提供低至衍射极限的红外成像,并在ATR显微镜中设定基准。它首次将FT-IR和红外激光成像(ILIM)显微镜结合在一个设备中,提供了三种测量模式:透射、反射和ATR。
Hyperion II 功能:
- μ-FT-IR 探测器的选择:
宽,中,窄频段LN2-MCT,
热电冷却 (TE) MCT。 - 用于红外成像的焦平面阵列探测器(64 x 64 或 128 x 128 像素)。
- 通过激光红外成像模块(ILIM,激光等级1)实现可选QCL
- 物镜选择:3.5x/15x/36x IR、20x ATR、15x GIR、4x/40x VIS。
- 光谱范围扩展 - 从近红外线 (NIR) 到远红外线 (FIR)
- 光阑选择:手动刀口,孔径轮自动刀口。近红外的金属孔
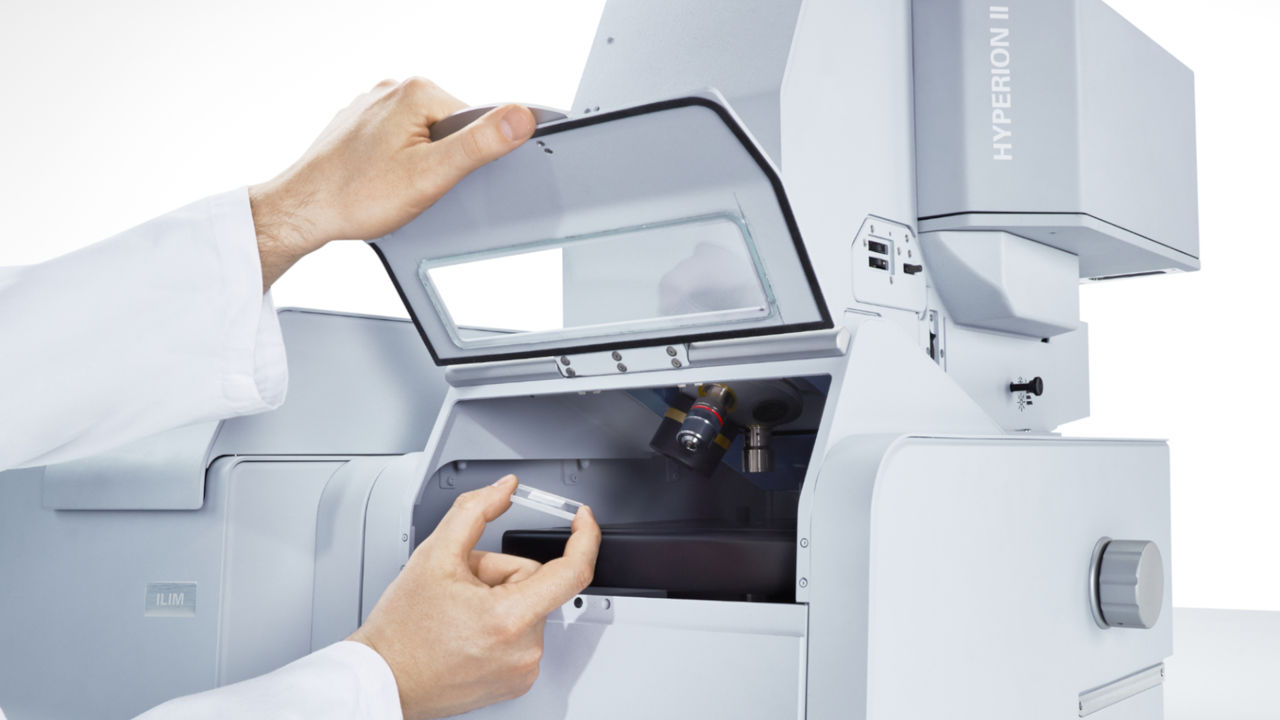
- 附件和样品台的选择:宏程序红外成像配件、冷却/加热样品台、样品仓等。
- 视觉/光学工具的选择:暗场照明、荧光照明、可见光偏振器、红外偏振器等。
Hyperion II 提供:
- 光谱和可见光图片的完美匹配。适用于任何测量模式(包括 ATR 成像)。
- 突破衍射极限的高灵敏度 FT-IR 显微镜和焦平面阵列(FPA)检测器成像。
- 首次通过(可选)红外激光成像模块(ILIM,激光等级1)将FT-IR和QCL技术结合起来。
- 所有测量模式下的红外激光成像(ATR、透射、反射)。
- 专利相干降低技术为非人为处理的激光成像测试,无灵敏度或速度损失。
- 高成像速度:
0.1 毫米2每秒 (FPA, 全频谱)
6.4 毫米2 每秒(ILIM,单波数) - 可选的TE-MCT探测器,用于在无液氮的情况下进行高空间分辨率和灵敏度的红外显微镜检测。
- 发射光谱功能和可选光谱范围扩展。
Hyperion II 应用领域:
- 生命科学|细胞成像
- 药物
- 发射率研究(例如 LED)
- 失效和原因分析
- 刑侦
- 微塑料
- 工业研发
- 聚合物和塑料
- 表面表征
- 半导体
英国《金融时报》-面向先驱和创新者的傅立叶变换红外(FT-IR)研究级显微镜
几乎没有任何红外显微镜能像 HYPERION II 那样赋予我们的使用者:
灵活、精确、可配置、适应性强,始终处于可能的极限。
完全控制
最重要的是,它意味着可以完全控制仪器。访问实验、样本和参数。这是 HYPERION II 的基础及其最重要的一点:提供完全控制。
无论是单点模式下的FT-IR测量、还是使用不同的检测器或物镜,特殊样品台或ATR或掠角物镜进行成像。 在任何时候,你都可以决定你的结果 - 并使它们变得更好。
这是我们与LUMOS II红外显微镜的明显区别。LUMOS II将用户从繁琐的实验细节中解放出来,并使测量过程自动化,但是除此之外,HYPERION II还是一个精密的工具,充分满足用户的要求。

历史的丰碑
许多用户通过其前身了解 HYPERION II 及其优势。近20年来,它一直是红外显微镜和成像领域的创新力量。使 Hyperion 成为出色的 Ft - IR 显微镜的因素仍然存在 - 只有更好, 更快和改进。
HYPERION II 仍然具备您日常研究所需的所有功能:液氮和热电冷却 MCT、焦平面阵列成像检测器、可见和红外增强工具,当然还有大量专用配件。
最后,我们希望通过引进新的和令人振奋的技术,同时保持既定和有价值的方法,再次树立FT-IR显微镜和成像的基准,不辜负我们作为创新领导者的美名。

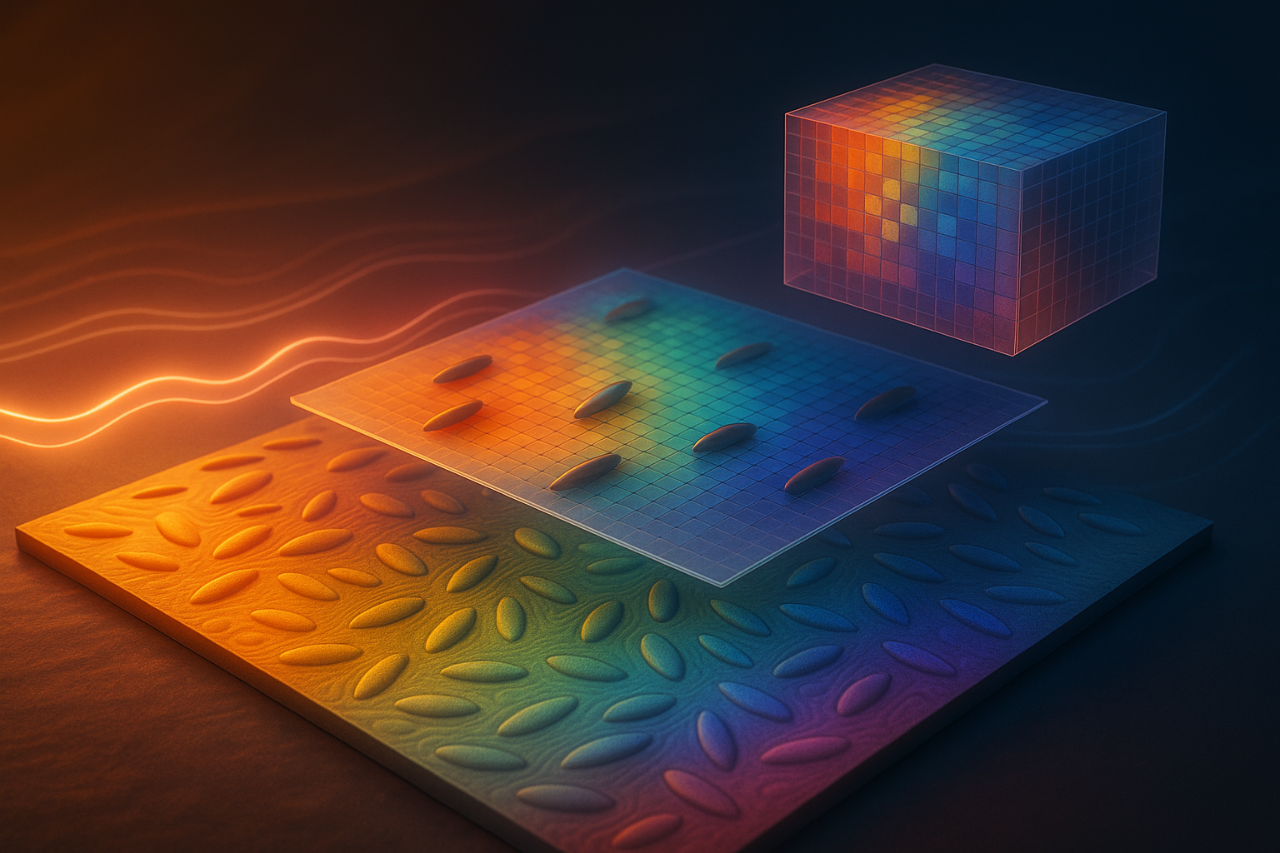
通过激光红外成像 (QCL) 增强 FT-IR
一台仪器中的QCL 和 FT-IR
用户首次可以使用在一台仪器中结合了FT-IR和QCL技术的红外显微镜。这样,我们为生命科学和材料研究打开了一扇全新的大门。
收集FT-IR光谱,选择您想使用QCL的波长,并在几秒钟内创建令人惊叹的化学图像。
通过这种全新的FT-IR和红外激光成像方法,我们终于为用户、研究人员和科学家提供了一种开发新应用的工具,同时也为改进已经建立和验证的方法提供了一种工具。
性能卓越的真正的 QCL 显微镜
HYPERION II 在最先进的 FT-IR 显微镜中提供不折不扣的 QCL 显微镜。事实上,我们专门开发并申请了新型相干降低技术的专利,以实现无与伦比的红外激光成像性能—无需数字后处理。
说明:在传统的FT-IR中,空间相干性不起作用。然而,在具有QCL的红外显微测试中,不可避免地会出现空间相干现象。红外图像和光谱中的这些条纹和斑点通常被认为化学成像的干扰(见附件;DOI: 10.1002/jbio.201800015)。
事实上,将样品的化学信息与描述散射光子相位关系的物理信息区分开并非易事。HYPERION II 着实解决了这个问题,并通过智能硬件设计解决了这个问题,并允许您获取无人工处理的化学成像数据。
比较FT-IR和QCL光谱
比较这两项技术是否意味着两者都能同样出色地完成同一项任务——这是一种普遍的误解。FT-IR和红外激光成像具有明显的优势,只有将两者结合起来才能达到最佳效果。
我们知道,大多数科学家和研究人员不想失去FT-IR的普适性。他们也不喜欢只局限于缺少参照的单一的,尖端技术上。幸运的是,HYPERION II 可以同时兼顾:出色的 FT-IR 成像显微镜和潜力无限的 QCL 显微镜。
我们已经解决了这种二元性问题,虽然 QCL技术在相同信噪比下记录数据的速度明显加快,但局限于小测试范围的MIR。同样,我们忠实于HYPERION II的概念。您选择。您有完全的控制权。

红外显微镜应用(FPA、MCT、QCL)
生物组织分析

材料科学

刑侦学

药物开发

地质学和矿物学

微塑料分析

Energy Materials / Photonic Crystals

In the study by Arpin et al. (2013), 3D self-assembled tungsten photonic crystals retain their structure up to ~1,400 °C, while exhibiting tailored IR reflectance/emissivity spectra that show enhanced useful thermal emission and suppressed undesired IR emission.
The role of HYPERION: researchers used reflectance IR to infer spectral emissivity via Kirchhoff’s law and applied reflectance analysis to directly link to emissivity control of tungsten photonic crystals.
Nanophotonics / Bioanalytics

Amenabar et al. (2013) demonstrated infrared nanospectroscopy (nano-FT-IR) mapping of individual protein complexes (e.g. ferritin, insulin fibrils) with ~30 nm lateral resolution, interpreting local broadband spectra in the amide I/II region to deduce secondary structure at the nanoscale.
The role of HYPERION: FT-IR spectra were acquired as reference spectra and to compare peak positions and band shapes with the nano-FT-IR data, thereby supporting assignments of local secondary-structure resonances.
Plastmonics / Supercrystals

Mueller et al. synthesized three-dimensional, self-assembled gold nanoparticle “supercrystals” and demonstrated that plasmon polaritons in these crystals induce strong near-field enhancement across visible to mid-IR bands, enabling both SERS and SEIRAS of ligand molecules.
The role of HYPERION: IR reflectance and transmittance spectra on plasmonic supercrystal films where collected demonstrating coupling between plasmonic modes and molecular vibrations and quantifying SEIRAS enhancement.
On-Chip-Screening / Biomedical
In Benz et al. (2020) a dendrimer-based, patterned indium-tin-oxide (ITO) slide was used to generate >50,000 nanodroplet vessels per plate, enabling on‐chip chemical synthesis and ultra-sensitive MALDI-TOF MS, UV–Vis reaction monitoring (RM) and on-chip IR spectroscopy for RM and characterization in high-throughput drug discovery.
The role of HYPERION: IR spectra from the droplet array spots provided molecular vibrational absorption signatures to complement MS and UV-Vis data, thus supporting high-throughput characterization of the synthesized library.
Plasmonics / Metamaterials
Paggi et al. (2023) demonstrate an over-coupled metasurface resonator that enhances molecular vibrational absorption across the mid-IR range (5–10 μm) by coupling weak plasmonic modes to molecular vibrations, achieving reflectivity variations up to 1% per nanometer of molecular layer thickness.
The role of HYPERION: IR spectra in the mid-IR allowed to assess the influence of the metasurface resonator on vibrational modes, shed light onto the broadband SEIRA mechanism and supported the design of detection platforms.
Polariscopy / Nanomaterials
Honda et al. (2019) demonstrated infrared (IR) polariscopy using hyperspectral imaging with a focal plane array (FPA) detector in the IR spectral region under illumination by thermal and synchrotron light sources. They show that the time required for polariscopy at IR wavelengths can be substantially reduced by the FPA-FTIR imaging.
The role of HYPERION: Both the offline FPA-FT-IR experiments and the synchrotron based hyperspectral imaging were performed on the Hyperion enabling the analysis of the targeted sub-wavelength features via polariscopy.
Energy Materials / Metamaterials

Dyachenko et al. report the design and fabrication of a refractory multilayer metamaterial composed of tungsten and hafnium dioxide that exhibits an optical topological transition between epsilon-near-zero and hyperbolic dispersion. This transition allows control over the material’s thermal emission properties at high temperatures, enabling selective tuning of emissivity.
The role of HYPERION: Reflectance spectra were collected in the NIR region to determine the spectral position and strength of optical resonances in the multilayer structure.
Optics / IR Imaging

Stavitski et al. (2013) achieved diffraction-limited spatial resolution by coupling synchrotron infrared (IR) beamlines to focal plane array detectors (FPA), enabling full-field imaging with high chemical sensitivity and rapid acquisition times. Using this approach, they successfully map chemical composition in heterogeneous samples with spatial resolution down to approximately 5 µm.
The role of HYPERION: Equipped with an FPA detector, the HYPERION served as the imaging platform coupled to the synchrotron which was used for the chemical and compositional analysis.
Catalysis / Energy Materials

Cao et al. report using operando synchrotron radiation FT-IR (SR-FT-IR) under working potentials to detect a reversible vibrational absorption band at ~764 cm⁻¹ of an atomically dispersed Ru₁–N₄ catalyst, which they attribute to the adsorption/desorption of an oxygen intermediate (O*), thereby revealing the dynamic involvement of O species at the Ru site during catalysis.
The role of HYPERION: An operando SR-FT-IR setup was used to spatially and spectroscopically interrogate the catalyst under bias, capturing the vibrational signature of O* on the Ru site and supporting direct linkage between intermediate adsorption and catalytic function.
Catalysis / Energy Materials

In Su et al., the authors design CuO clusters supported on N-doped carbon and show that under applied potential the clusters dynamically reconstruct into Cu₂–CuN₃ species with charge asymmetry, which correlate with high Faradaic efficiency toward C₂⁺ products (notably ethanol). They combine operando XAS, quasi-in situ XPS, and operando FT-IR (with DFT support) to trace structural, electronic, and adsorbate changes in real time.
The role of HYPERION: As part of their operando FTIR setup, it was used to focus the synchrotron-based IR beam into the reaction cell and collect reflectance spectra under applied potentials. These measurements enable tracking of molecular vibrational features and charge-asymmetry signatures linked to the Cu₂–CuN₃ clusters and thus substantiate the structure–activity correlations under working conditions.
红外采样附件和物镜
验证板

多功能样品支架

ATR 宏成像配件

过滤器支架

冷热台

3.5 倍成像物镜

标准透射物镜

ATR 物镜

掠角物镜

金刚石压池

OPUS Release 9.0 Highlights for HYPERION II | Q1 2025
New Feature: The Autonomous Composition Identifier (A.I.D.) simplifies search and identification.
The Autonomous Composition Identifier (A.I.D.) is an AI-driven software tool for identifying the chemical composition of samples based on IR or Raman spectral data. It incorporates the previous O/SEARCH features and adds a multi-step algorithm to find the best match from reference spectral databases, whether dealing with pure substances or complex mixtures. A.I.D. intelligently evaluates and recommends optimal matches with a balance of reliability and sensitivity—automatically generating diagnostics and visual reports, including residual spectra and hit quality graphs. It delivers high-performance results in seconds and supports in-depth, interactive analysis of alternative identifications.

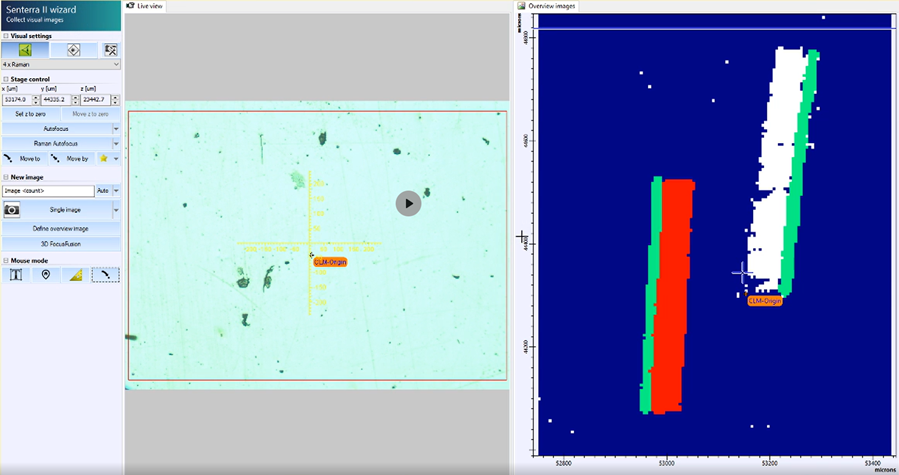
New Feature: Co-local Measurement – Unified Analysis Across IR and Raman
The Co-local Measurement function, part of the OPUS/OBJECT package, enables seamless analysis of the same region of interest on microscopic samples using both IR and Raman microscopy. It allows the transfer of overview images and measurement areas between LUMOS II, HYPERION II, and SENTERRA II instruments. This ensures that IR and Raman data are collected from precisely the same spot, enabling complementary chemical insights. Co-local Measurement bridges the gap between two techniques, improving data correlation and boosting confidence in results for heterogeneous or complex samples.
Updated Feature: OPUS/OBJECT now combines "Find Particle" and "Cluster ID"
The Particle Identification function (part of the OPUS/OBJECT package) combines the power of “Find Particles” and “Cluster ID” into one streamlined workflow. It detects particles within IR and Raman chemical images, determines their dimensions, and identifies their chemical makeup—all in one go. This integrated approach simplifies analysis and accelerates decision-making for complex samples.

OPUS Release 8.7 | HYPERION II | Q3 2021
新特性:通过新的自适应K均值聚类函数生成高性能化学图像
这个新功能是我们众所周知的聚类分析功能的下一个逻辑开发步骤。自适应K-means聚类函数基于一种新算法,该算法可以在成像或映射结果中无监督、自主地确定光谱方差。
- 由于该算法可以自行预测所有包含的化学类别,因此不再需要对化学类别的包含量进行预测或耗时的搜索。
- 这一主要功能对于大型数据集中未知样品或小型结构的所有类型的化学成像和分布分析都很重要。
- 尽可能简单地进行分析和评估,保护你宝贵的时间和神经。
新功能:“聚类ID”功能用于识别3D光谱数据中的类别
我们新的群集ID功能可以使用OPUS功能识别成像和地图数据中的群集:库中的频谱搜索、快速比较或身份测试。
- 易于确定颗粒、层压板层、药片组分和其他不均匀材料的分类样品组分的化学特性。
- 提供了有关所有分析结构的数量、尺寸和特性的可靠和全面的统计报告,并将颗粒和技术清洁度分析提升到一个新的自主水平。
更新功能:“查找粒子”功能现在包含一种新的粒子检测方法
经过验证的“查找粒子”软件现在可以同时应用于视觉和红外图像。有了这个更新的功能,你可以根据LUMOS II测量的化学图像进行粒子检测。
- 虽然灰白色滤膜上的低对比度结构和灰白色/透明颗粒/纤维的颗粒识别可能很繁琐,但基于化学红外图像的运行后颗粒测定允许您根据成像或映射结果确定颗粒的数量和大小。


资料室
下载相关资料,详细了解我们的 FT-IR 显微镜和解决方案。


