OPUS GA

Gas Analysis as Easy as can be.
EASY-TO-USE.
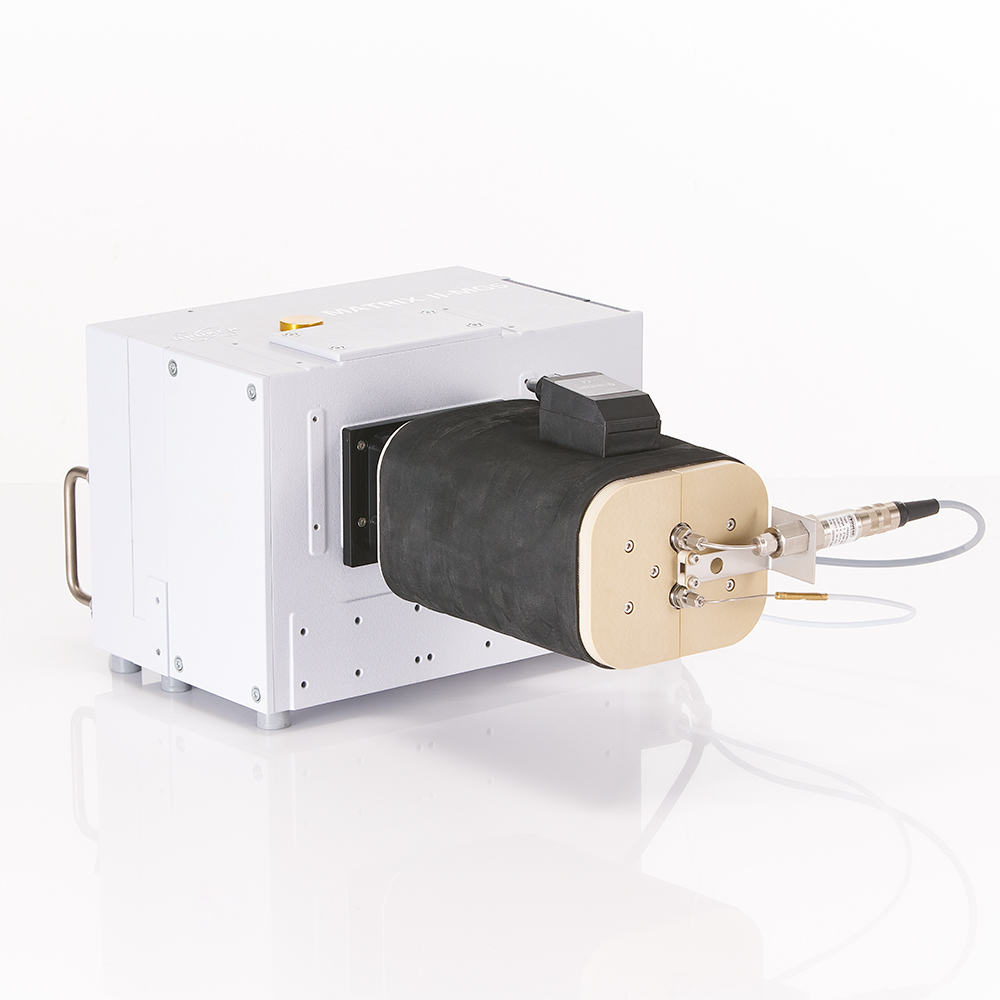
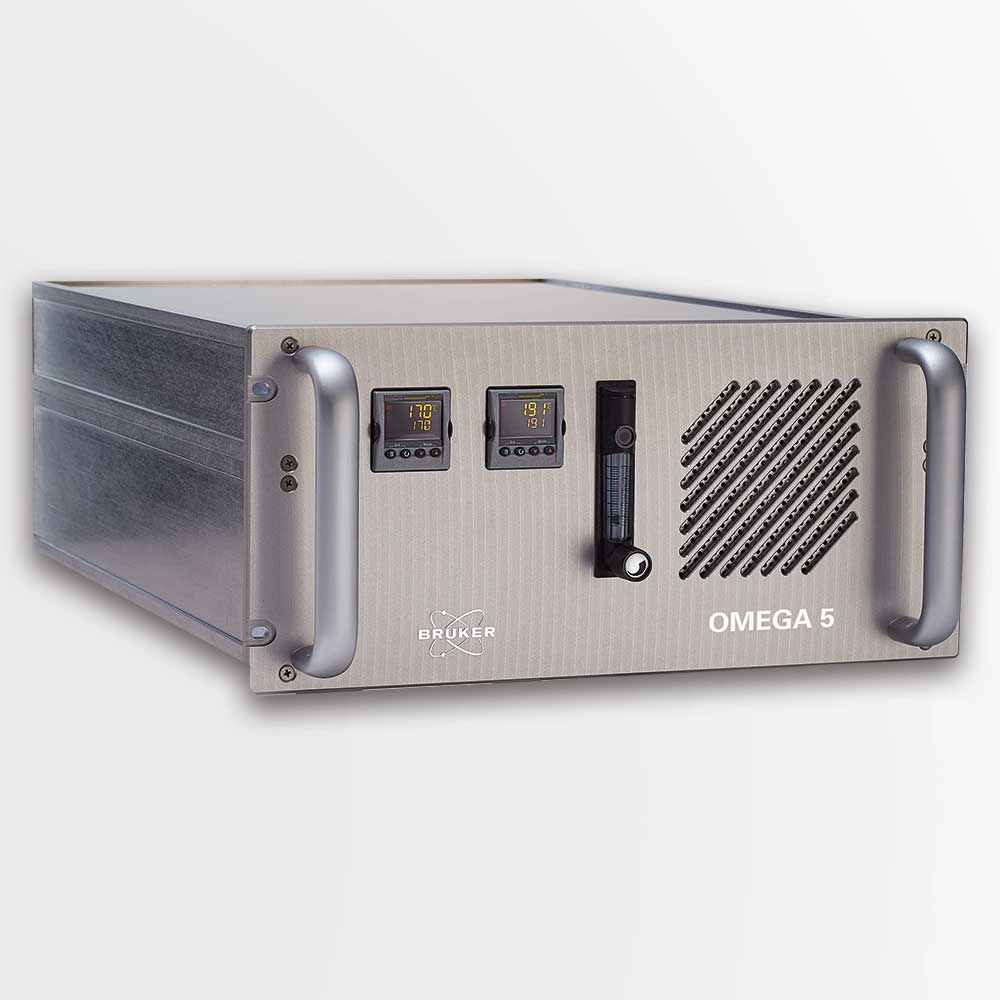
OPUS GA establishes an easy-to-use graphical user interface to control MATRIX-MG and OMEGA 5 gas analyzers. The user can conduct a fast, continuous and fully automated identification and quantification of gas compositions with minimum training effort. Expert knowledge in spectroscopy is not required.
ACCURATE.
The quantification of gas compounds is based on a unique non-linear fitting algorithm which fits a reference spectrum of the target compound to the measured spectrum. The algorithm allows for an accurate detection and quantification of compounds even in the presence of high concentrations of interfering gas compounds, which are also considered in the fitting procedure (more details). The influence of varying gas temperature and pressure is considered by the analysis routine.
INTEGRATABLE.
OPUS GA can be integrated into a process control system by means of the Modbus TCP/RTU module. Additionally, analog output and a web interface for the transmission of analysis results and the measurement status can be offered. Data from external devices, such as O2 or H2 sensors, can be displayed in OPUS GA via analog inputs.
FLEXIBLE.
With the available quantitative gas library B-GAS-LIBRARY, OPUS GA allows for the identification and quantification of more than 410 gas compounds without the need for calibration measurements. Adding a new quantification method for an additional compound just takes a few clicks in OPUS GA. Beyond that, individual reference spectra can be measured and added to the existing library. At any time, existing measurements can be re-analyzed based on an updated library or modified quantification methods without rerunning the measurement.
PREDICTIVE.
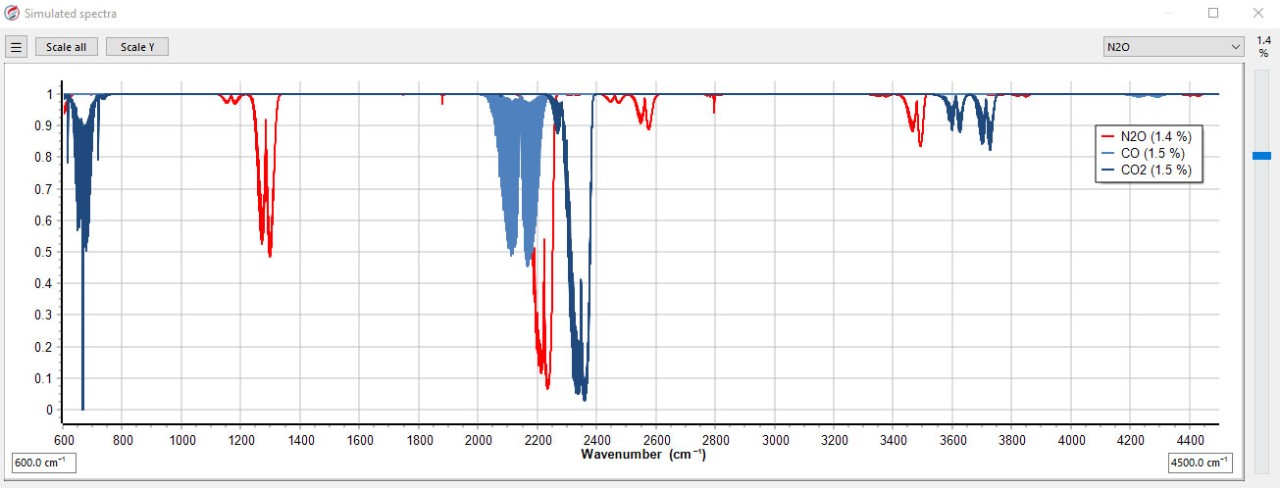
The sophisticated simulation tool within the OPUS GA software allows detailed simulations of the resulting spectra of gas mixtures considering variable gas concentrations. The spectra are simulated under real environmental conditions, like temperature, pressure, and the spectral resolution. Quantification methods can easily be defined through these simulations as the spectra of the analyte and of the interfering compounds are shown. As a fit is used for quantification, the IR signatures of unexpected gas species are directly visible.
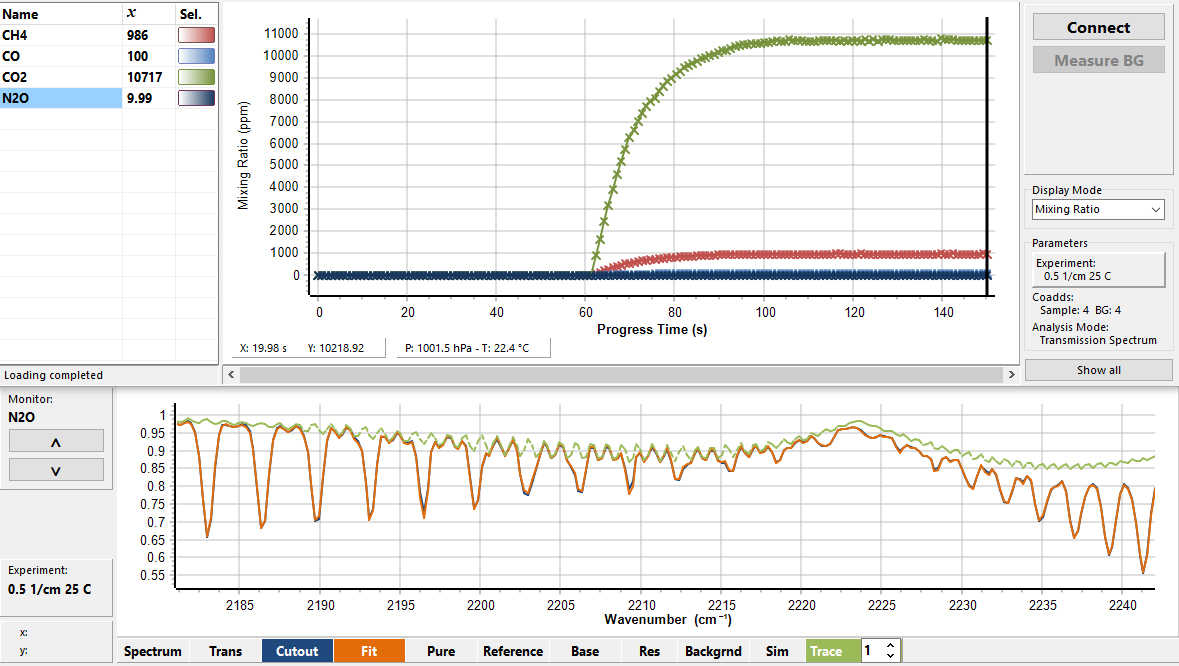
The time series window (top) displays the concentration of selected gas compounds as a function of time. In the Spectral Analysis window (bottom), the measured spectra can be investigated in detail. The measured spectrum (blue), the fit (orange) and the contribution of the target gas N2O (green) to the overall spectrum are shown in a selected spectral region. An excellent agreement between measured spectrum and fit is obtained.