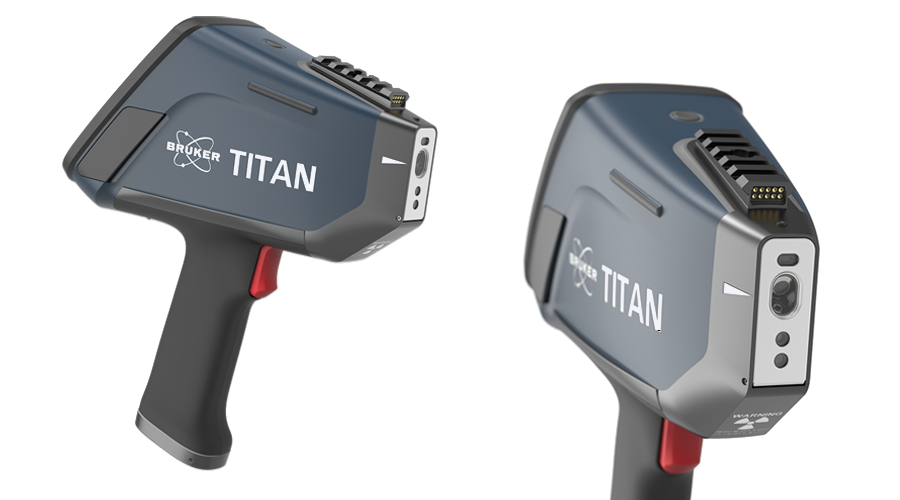
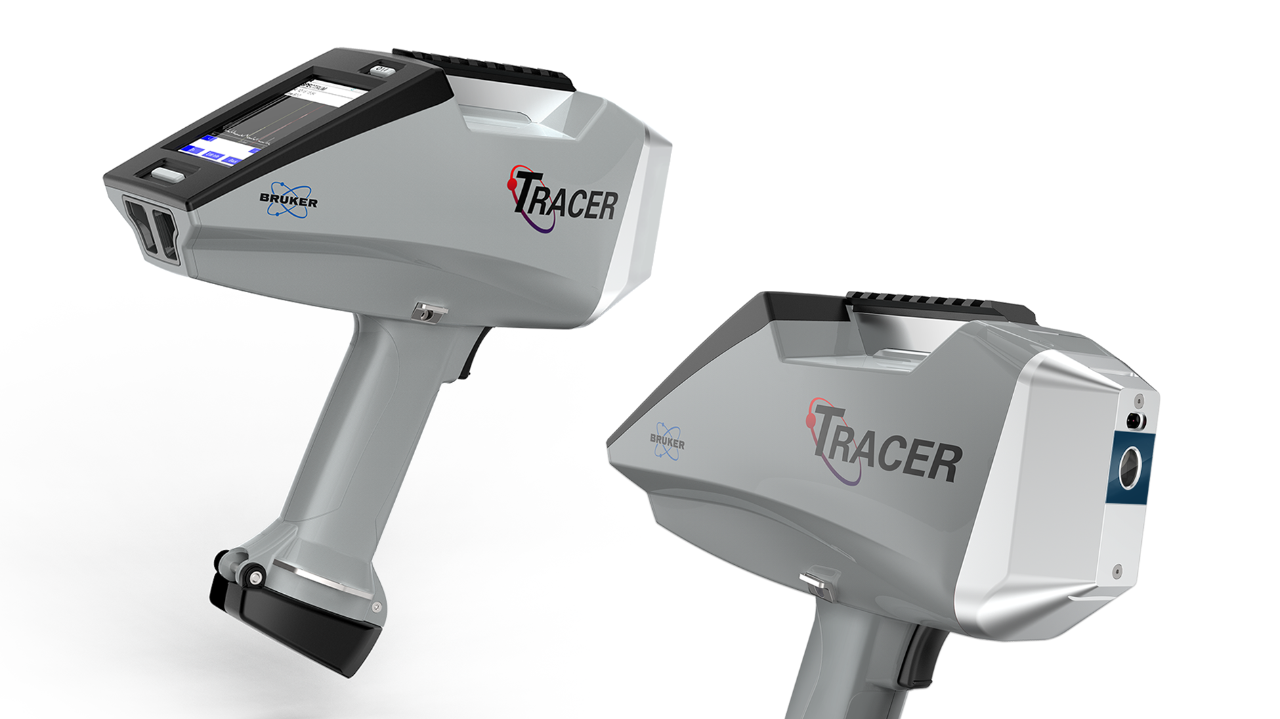
Quantitative XRF Data: Calibrations and Quantification
Quantitative XRF data informs the user as to the absolute quantity of an element present in a sample. This sort of data contains a number and a unit—usually ppm (parts per million) or % weight. Calibrations are created in order to make raw qualitative data into quantitative data. There are several types of calibrations. Two typical types are FP (fundamental parameters) and empirical calibrations. Calibrations are made by using samples with known concentrations of elements of interest to create a calibration curve that relates the specific known concentrations to peak heights. This curve can then be used to quantify samples of unknown concentrations by relating the peak height to the curve built from the known samples. There are some significant differences in how exactly these calibrations are created and how they work depending on the calibration type. Some rely more heavily on math, while others are purely made by analyzing known samples that are similar to the unknown samples the user wants to quantify.
Quantitative data can be calculated and reported completely by the instrument, with no additional input required from the user. However, it is important that users understand when quantitative data is reliable. For example, if you attempt an analysis of metal samples using a calibration that was intended for the analysis of soil samples, your instrument will generate numbers, but the numbers will be meaningless. For accurate quantitative data, the following four conditions must be met:
- Sample must be homogeneous (no layers, no rust, no inclusions, etc.)
- Calibration used for quantification must be appropriate to the material of the sample analyzed
- The sample must meet “infinite thickness” conditions, meaning that the sample must be thick enough to attenuate all primary x-rays from the XRF instrument, without any of the primary x-rays escaping out the other side of the sample
- There must be samples of known concentration available in order to check and/or create the calibration
Semi-Quantitative Data
In some instances the conditions for reliable quantitative data are not met, but qualitative data is not enough to answer the questions at hand. In these situations, there is a third option. Semi-quantitative data processing allows the user to compare spectral data from samples in order to obtain information regarding the relative concentrations of elements from sample to sample. While this method does not provide absolute concentration values, it can be used to ascertain relative element concentrations between samples; for example, this method would provide information such as “sample A contains approximately 20% more Ag (silver) than sample B.” This sort of data is extracted by calculating the area under each peak of interest, which is equivalent to the number of counts. This type of data is appropriate in situations where a calibration and/or samples of known concentrations do not exist, but comparing the samples in terms of element concentration is necessary. Click here and learn how Bruker can assist you with your data analysis!