QUANTAX EDS for SEM
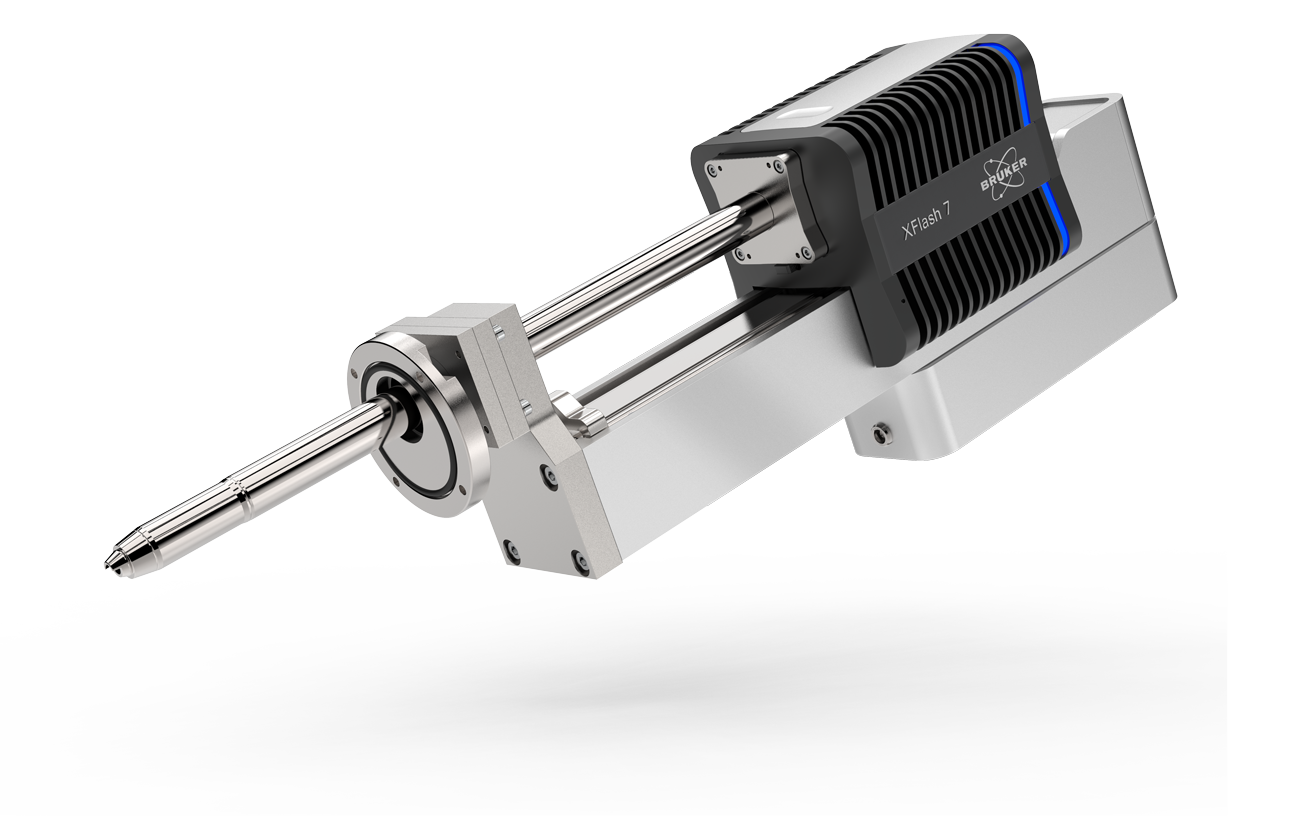
XFlash® 7 - The Latest EDS Detector Series
The Right Angle for Better Analysis
Fast. Precise. Reliable.
1,000,000
cps
Real analytical throughput up to 1,000,000 cps
Achieve unmatched analysis speed
> 2,200
Element lines
Quantify the most complex data using the most comprehensive atomic database incl. K, L, M and N lines
> 1.1
sr
Largest solid angle for X-ray collection
Maximize your sample throughput with optimum geometry for most efficient collection of the generated X-rays
Energy-Dispersive Spectrometry for SEM, FIB-SEM and EPMA
- Bruker's latest generation of QUANTAX EDS features the XFlash® 7 detector series, which provides the largest solid angle for X-ray collection (also called collection angle) and the highest throughput.
- The XFlash® 7 continues to set standards in performance and functionality in energy-dispersive spectrometry for the Scanning Electron Microscope (SEM), Focused Ion Beam (FIB-SEM) and Electron Probe Micro Analyzer (EPMA).
- The XFlash® 7 detector family also offers optimized solutions for EDS analysis of electron transparent specimens in TEM and SEM, as well as the unique XFlash® FlatQUAD, a detector made to answer your questions on challenging samples.
- Slim-line technology, large collection angle design and latest generation pulse processing.
- Increase system uptime with on-site SDD module exchange.
- Highest spectral performance obtained with best energy resolution.
- Increased accuracy of results by sophisticated quantification algorithms and a unique combination of standardless and standard-based methods.
Make Your Elemental Analysis more Efficient!

- Gain very precise results faster with individually optimized EDS systems. It ensures unmatched speed and precision.
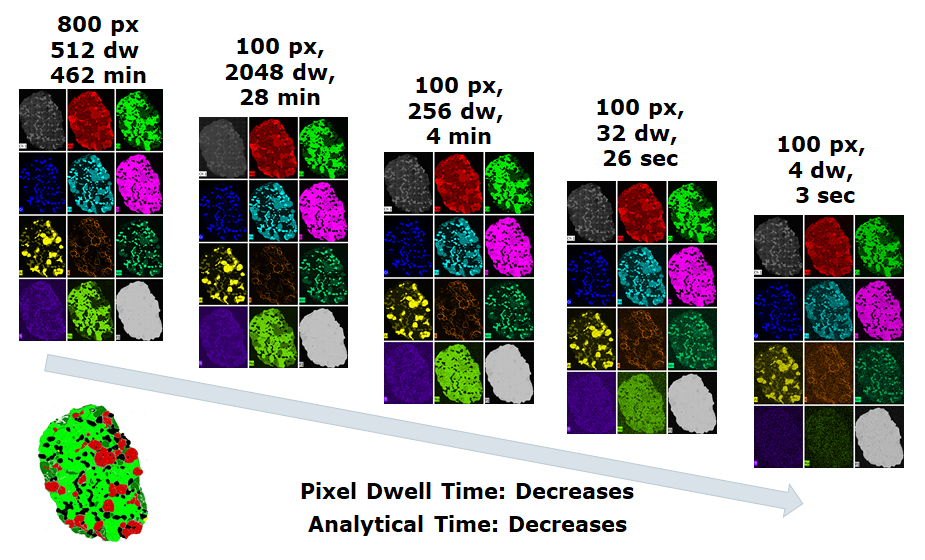
- Shorten measurement time with maximized throughput, enabling mapping and quantification at all settings with no limitation of data size.
- Analyze challenging samples now, thanks to the most efficient geometric collection of generated X-rays.
- Benefit from accurate and reliable quantification results with optimized geometry minimizing background and avoiding absorption.
- Detect small quantities with better detection limit, lower background and less absorption.
- One for all - seamless integration of EDS, WDS, EBSD, and Micro-XRF in the comprehensive ESPRIT analysis platform for any SEM, FIB-SEM and EPMA.
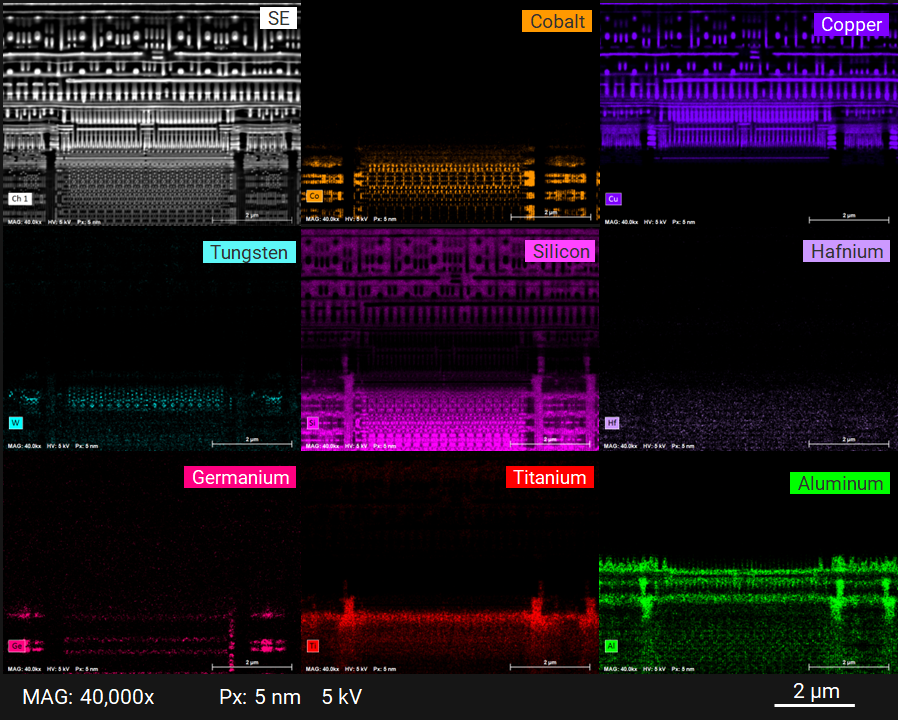
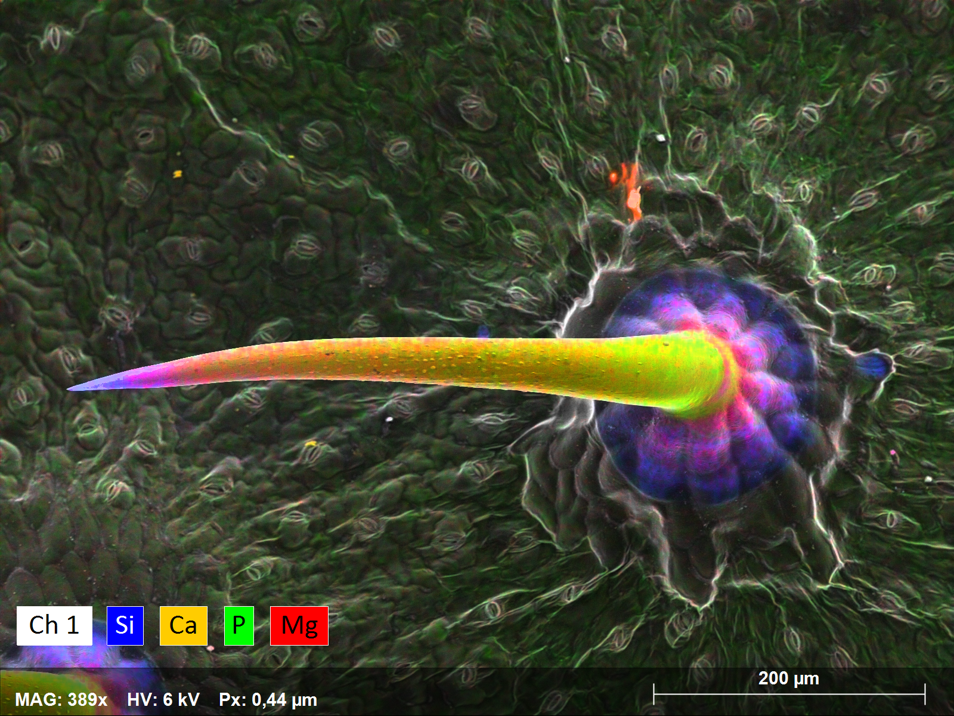
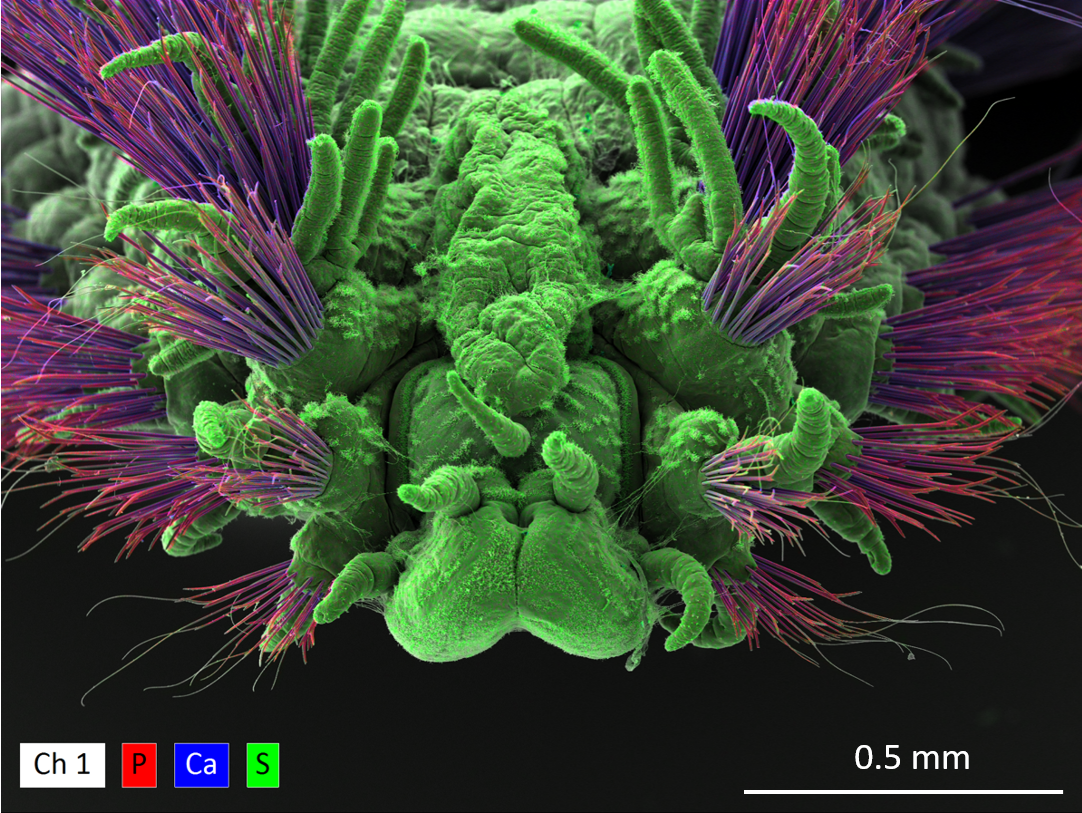
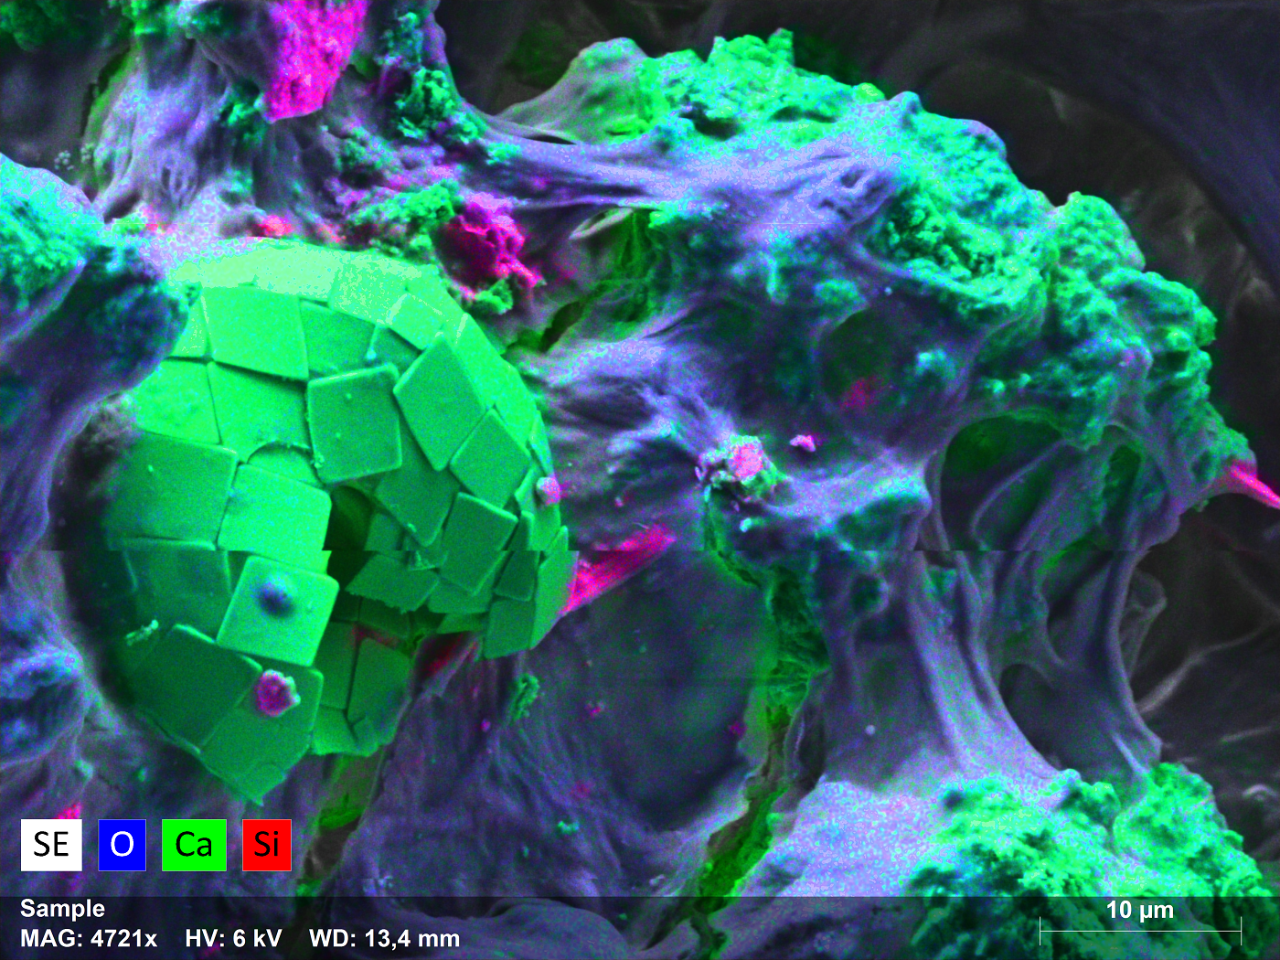
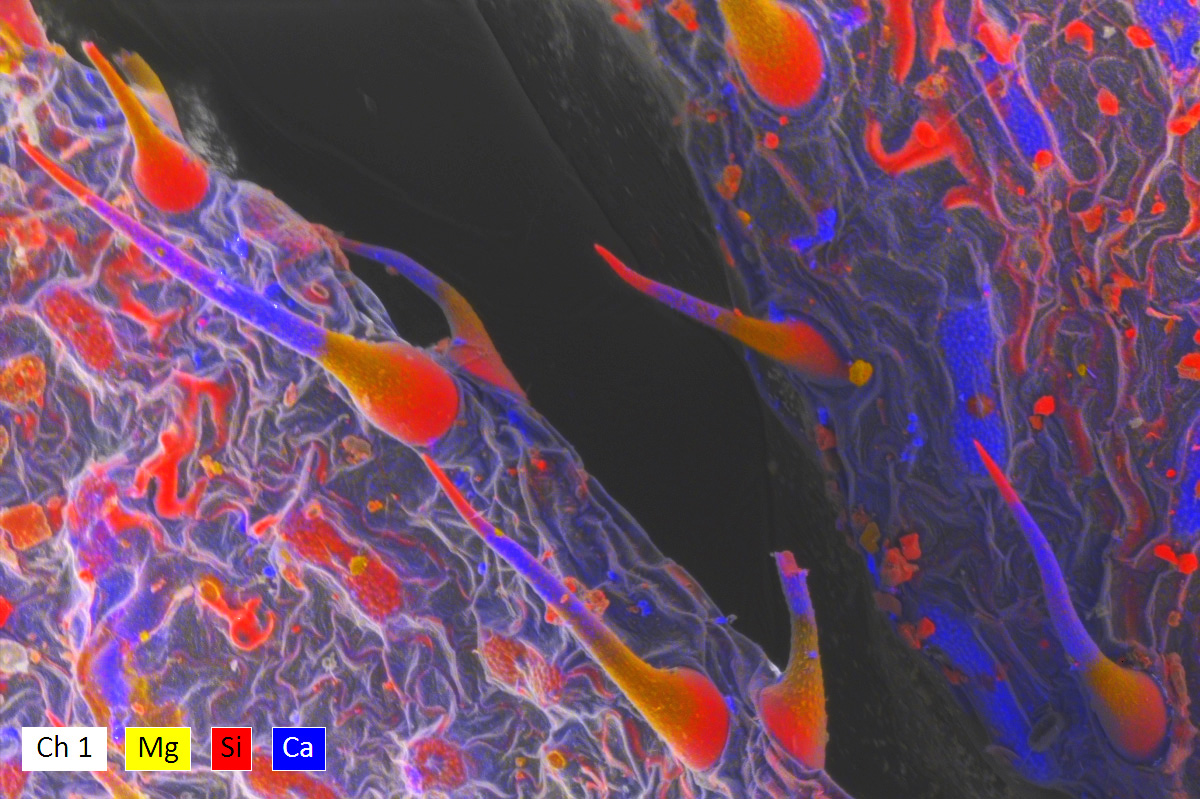
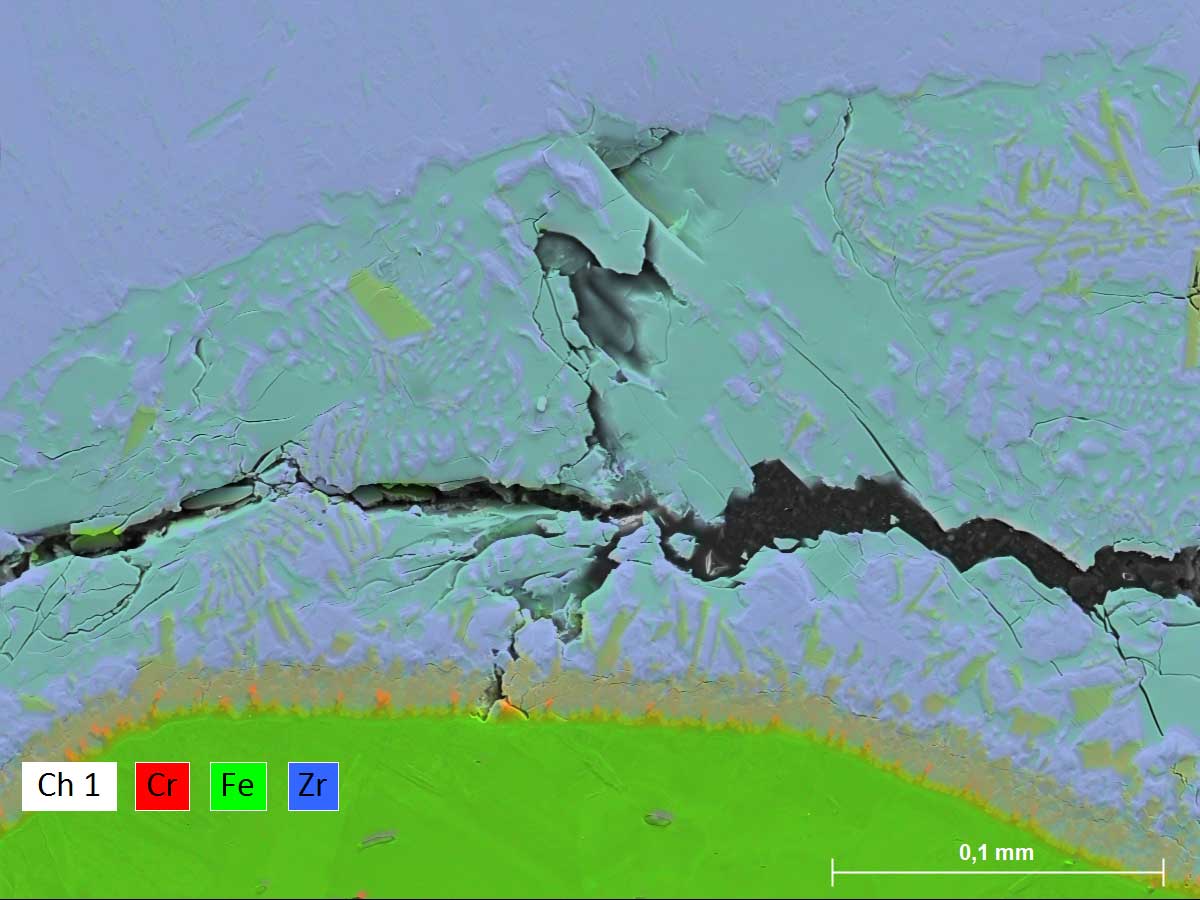
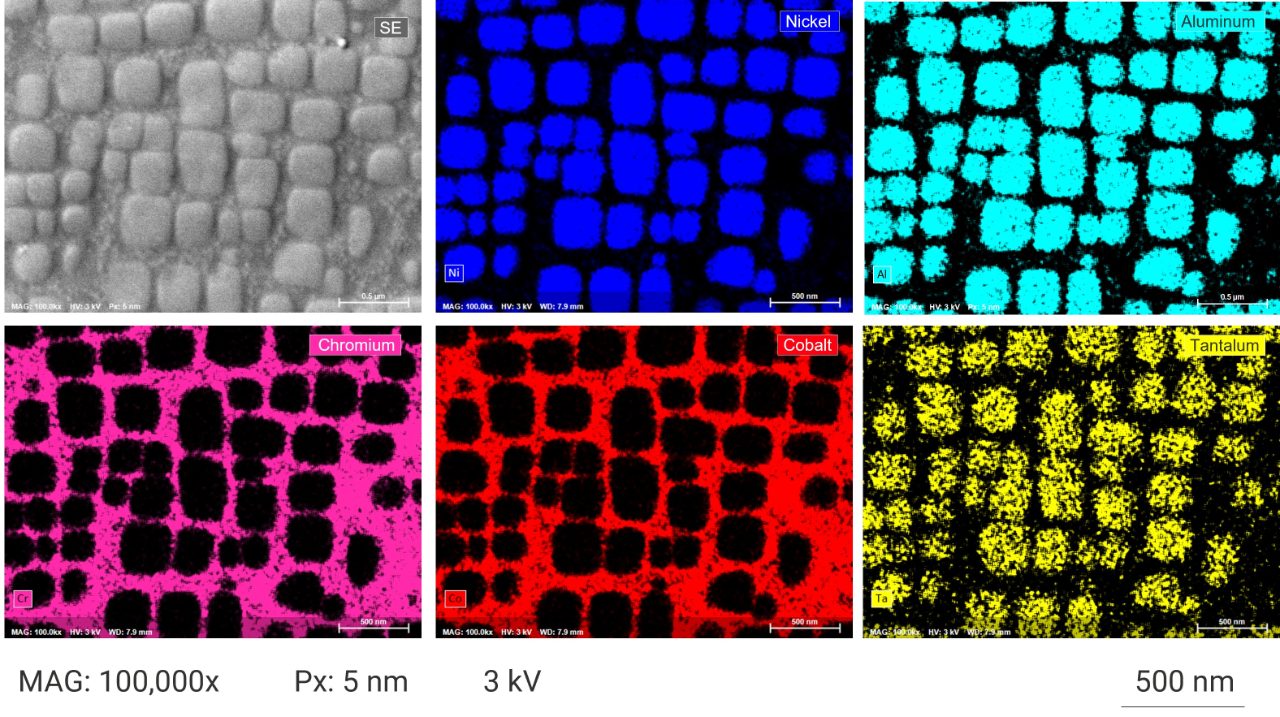
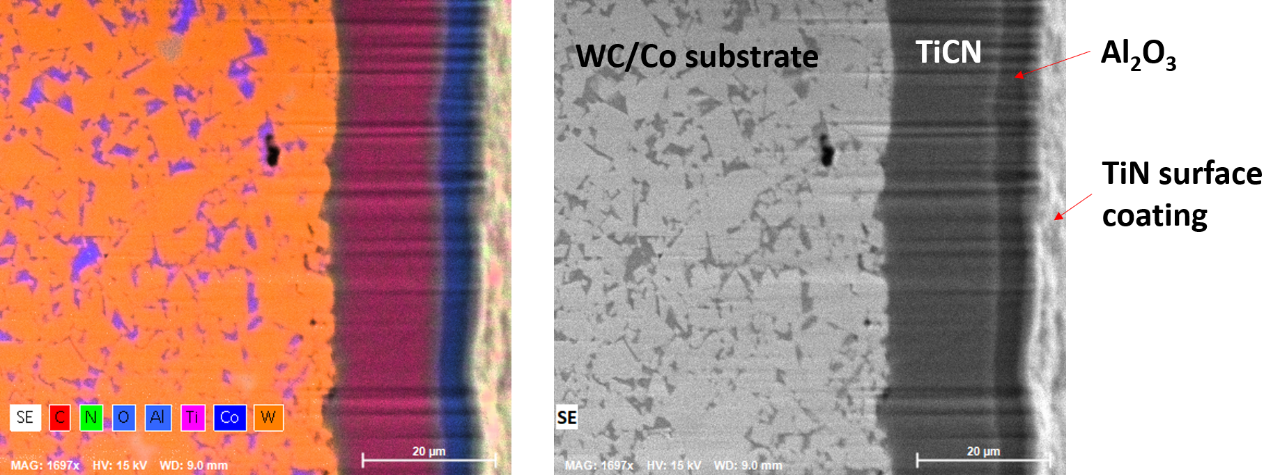
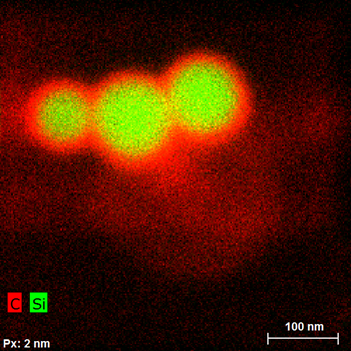
Applications of SEM EDS
Resources & Publications
Learn more about EDS
Interested in learning more about EDS? Visit our explainer page:
Learn about Full Range EDS - Combining EDS with micro-XRF on SEM
The combination of EDS with micro-XRF on SEM extends the energy range and elemental sensitivity. To find out more about this powerful combination visit our explainer page:
Application Notes
- EDS 01 - Comparison of standardless and standard-based quantification
- EDS 02 - Fast identification of mineral phases
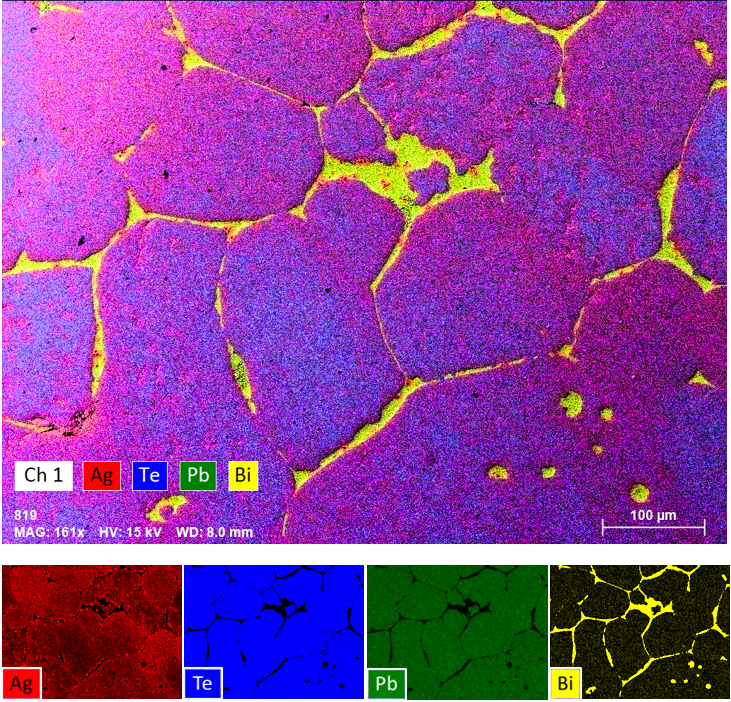
- EDS 03 - Spectroscopic phase analysis of a ternary alloy
- EDS 04 - Identification of trace elements & corresponding phases with hyperspectral imaging
- EDS 05 - Specific small particle search by mineral grain feature analysis and chemical evaluation
- EDS 06 - Determination of the alite to belite ratio in Portland cement
- EDS 07 - High-resolution mapping of an oceanic drill core
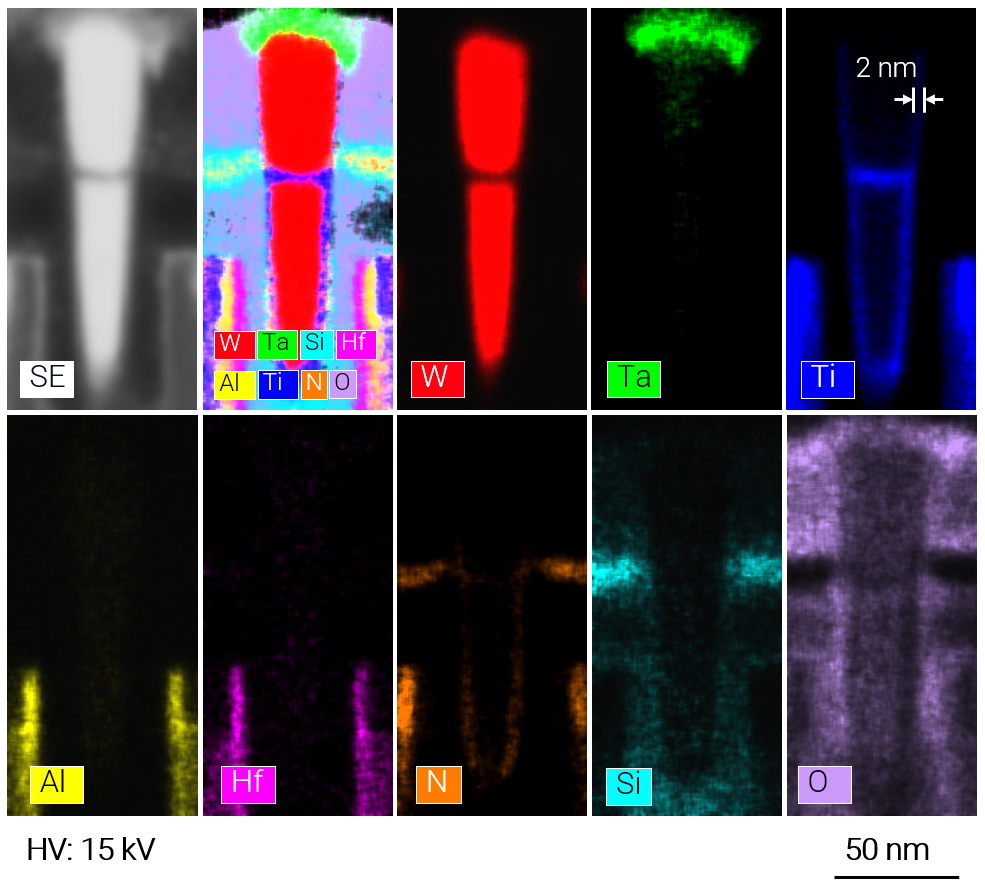
- EDS 08 - Determining gunshot residue using 15 kV acceleration voltage with optimized spectra deconvolution
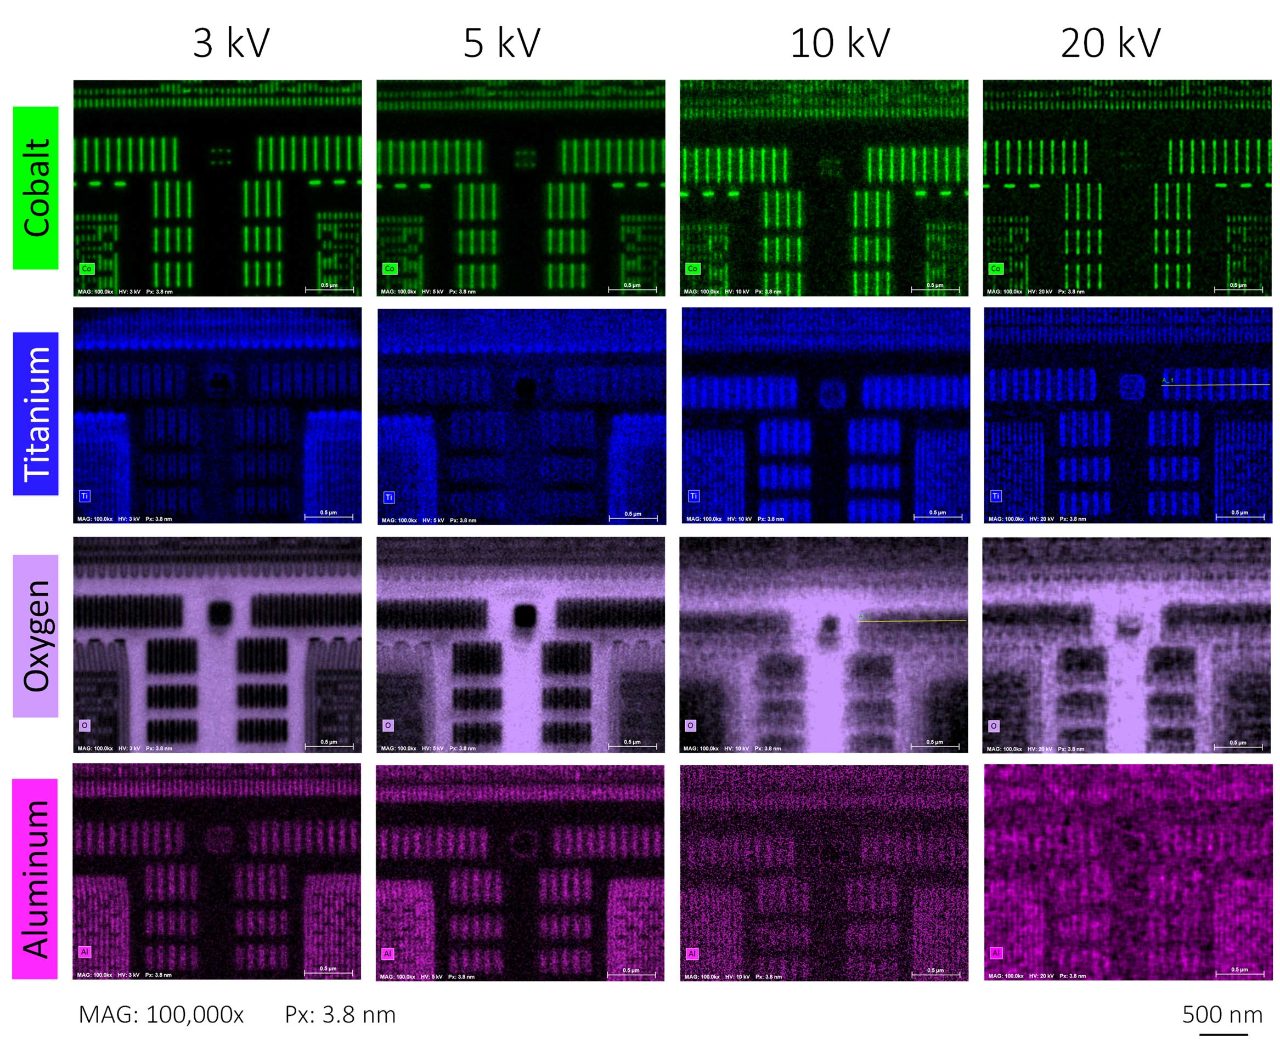
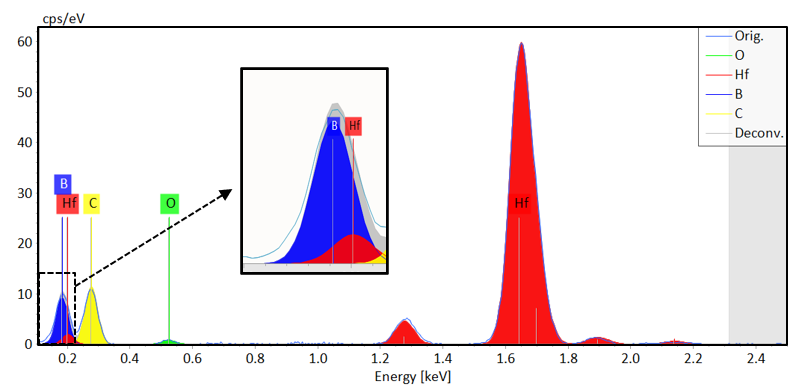
- EDS 09 - Light element quantification with TQuant: Analyzing boron nitride at different acceleration voltages
- EDS 10 - Advanced light element and low energy analysis of a ceramic material
- EDS 11 - Analysis of the elemental composition and thickness of a Fe-NI film on Si
- EDS 12 - High vacuum and low beam current analysis
- EDS 13 - Fast ore characterization
- EDS 14 - Low energy X-ray EDS analysis of ore mineralization
- EDS 16 - High-speed differentiation of mineral phases of similar BSE intensity
- Combined SEM Techniques 01 - Quantification of steel and alloys
Publications
- 2023 - Microscopy & Microanalysis: Improvement of Quantitative STEM/EDXS Analyses for Chemical Analysis of Cu(In,Ga)Se2 Solar Cells with Zn(O,S) Buffer Layers
- 2023 - Small: Boron and Sodium Doping of Polymeric Carbon Nitride Photoanodes for Photoelectrochemical Water Splitting
- 2022: Microscopy & Microanalysis: Measurement and Calculation of X-Ray Production Efficiencies for Copper, Zirconium, and Tungsten Get access Arrow
- 2022 - Surface and Interface Analysis: Elemental composition and thickness determination of thin films by electron probe microanalysis